| Param | Original file | Final file |
|---|---|---|
| Filename | modeM0/AS1A13_020T01_9000006040_44993cztM0_level2.fits | modeM0/AS1A13_020T01_9000006040_44993cztM0_level2_quad_clean.evt |
| Size (bytes) | 1,478,082,240 | 270,285,120 |
| Size | 1.4 GB | 257.8 MB |
| Events in quadrant A | 22,727,519 | 1,773,357 |
| Events in quadrant B | 8,585,623 | 1,857,186 |
| Events in quadrant C | 7,937,253 | 1,813,455 |
| Events in quadrant D | 14,138,438 | 1,553,600 |
| Mode SS | |||
|---|---|---|---|
| Quadrant | BADHDUFLAG | Total packets | Discarded packets |
| A | 0 | 350 | 0 |
| B | 0 | 350 | 0 |
| C | 0 | 350 | 0 |
| D | 0 | 350 | 0 |
| Mode M9 | |||
|---|---|---|---|
| Quadrant | BADHDUFLAG | Total packets | Discarded packets |
| A | 0 | 28 | 0 |
| B | 0 | 28 | 0 |
| C | 0 | 28 | 0 |
| D | 0 | 28 | 0 |
| Mode M0 | |||
|---|---|---|---|
| Quadrant | BADHDUFLAG | Total packets | Discarded packets |
| A | 0 | 79945 | 3 |
| B | 0 | 37250 | 3 |
| C | 0 | 35870 | 3 |
| D | 0 | 53744 | 3 |
| Quadrant | Total seconds | Saturated seconds | Saturation percentage |
|---|---|---|---|
| A | 17196 | 1083 | 6.297976% |
| B | 17196 | 255 | 1.482903% |
| C | 17196 | 156 | 0.907188% |
| D | 17196 | 1370 | 7.966969% |
Noise dominated data is calculated using 1-second bins in cleaned event files. If a bin has >2000 counts, and if more than 50% of those come from <1% of pixels, then it is considered to be noise-dominated and hence unusable.
| Quadrant | # 1 sec bins | Bins with >0 counts | Bins with >2000 counts | High rate bins dominated by noise | Noise dominated (total time) | Noise dominated (detector-on time) | Marked lightcurve |
|---|---|---|---|---|---|---|---|
| A | 19861 | 17200 | 156 | 156 | 0.79% | 0.91% | 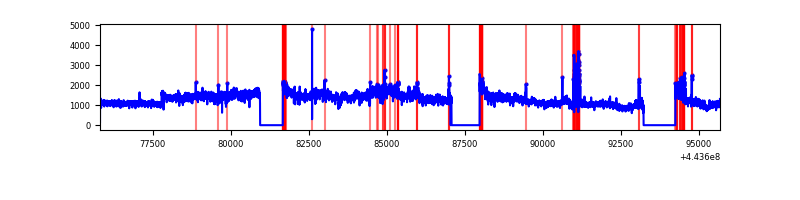 |
| B | 19861 | 17200 | 71 | 71 | 0.36% | 0.41% | 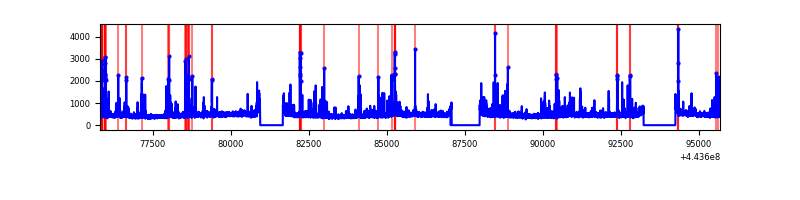 |
| C | 19861 | 17200 | 35 | 35 | 0.18% | 0.20% | 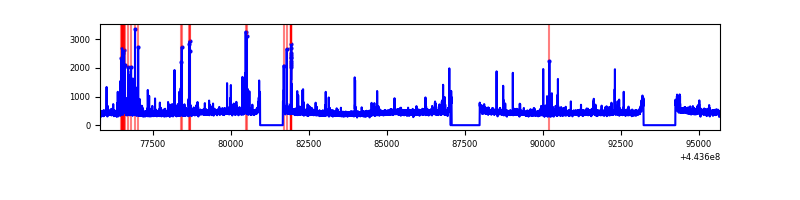 |
| D | 19861 | 17200 | 1096 | 1096 | 5.52% | 6.37% | 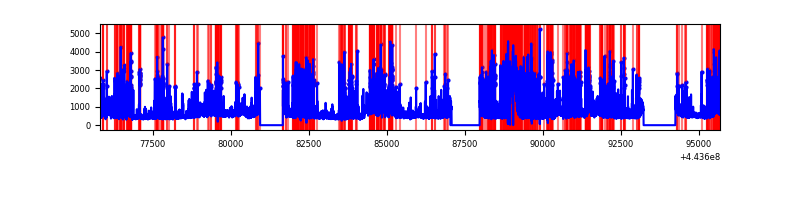 |
Top three noisy pixels from each quadrant. If the there are fewer than three noisy pixels in the level2.evt file, extra rows are filled as -1
| Pixel properties | Quadrant properties | ||||||
|---|---|---|---|---|---|---|---|
| Quadrant | DetID | PixID | Counts | Sigma | Mean | Median | Sigma |
| A | 0 | 247 | 8685757 | 21972.83 | 1893 | 1851 | 395.2 |
| A | 10 | 83 | 5924286 | 14985.5 | 1893 | 1851 | 395.2 |
| A | 0 | 226 | 547232 | 1379.97 | 1893 | 1851 | 395.2 |
| B | 5 | 255 | 372475 | 993.35 | 1916 | 1857 | 373.1 |
| B | 5 | 172 | 164279 | 435.33 | 1916 | 1857 | 373.1 |
| B | 0 | 168 | 105697 | 278.32 | 1916 | 1857 | 373.1 |
| C | 14 | 254 | 269513 | 593.59 | 1910 | 1922 | 450.8 |
| C | 1 | 3 | 116480 | 254.12 | 1910 | 1922 | 450.8 |
| C | 15 | 208 | 44915 | 95.37 | 1910 | 1922 | 450.8 |
| D | 13 | 249 | 4092336 | 8838.86 | 1838 | 1782 | 462.8 |
| D | 13 | 187 | 486627 | 1047.65 | 1838 | 1782 | 462.8 |
| D | 12 | 33 | 470501 | 1012.81 | 1838 | 1782 | 462.8 |
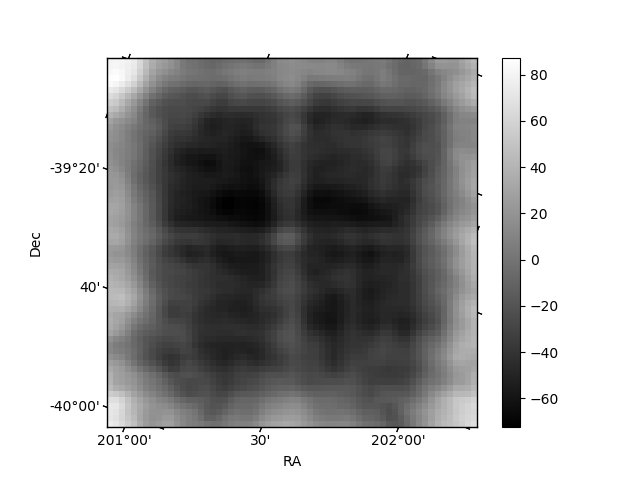
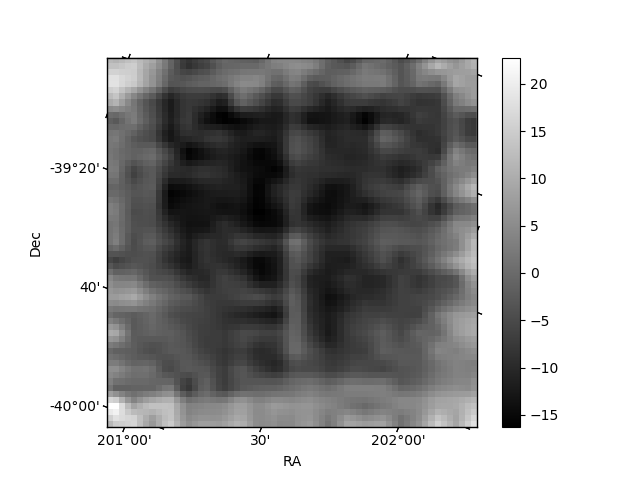
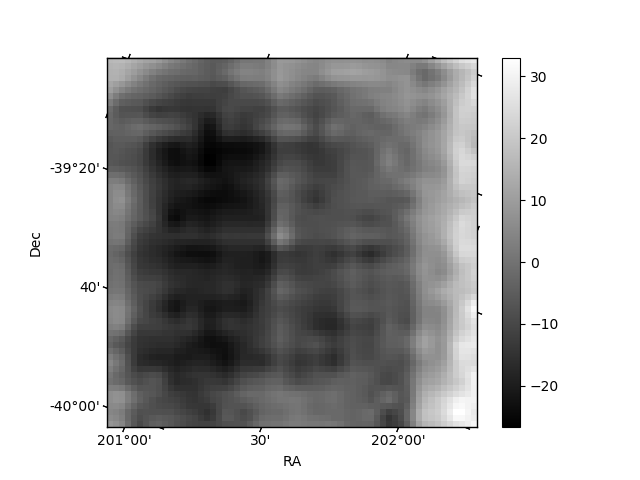
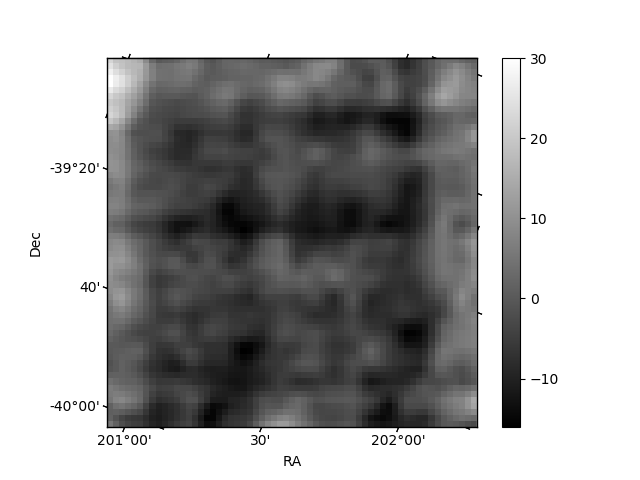
Histogram calculated using DETX and DETY for each event in the final _common_clean file
| Quadrant A | 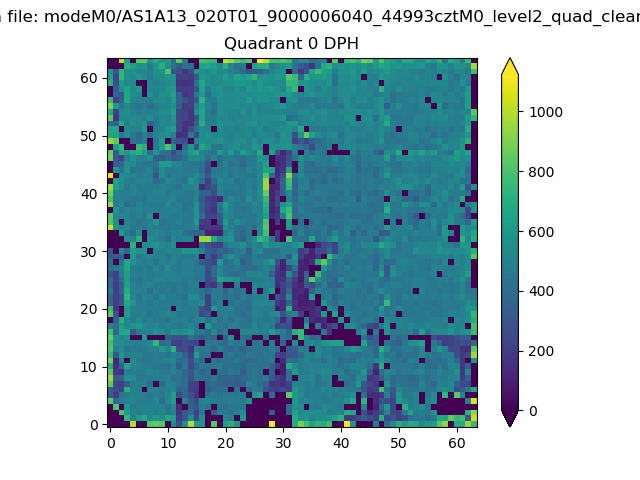 |
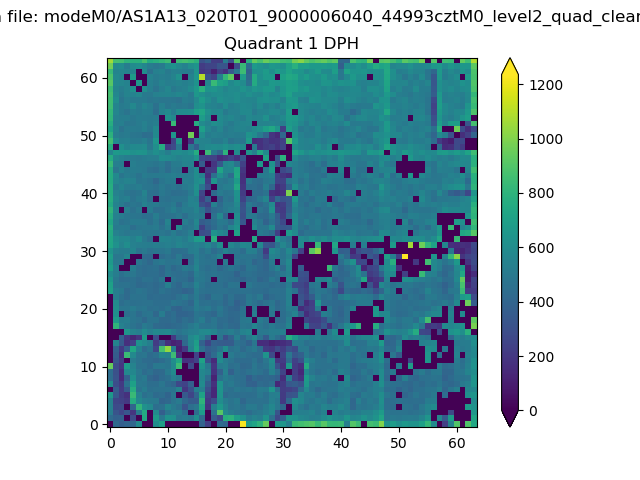 |
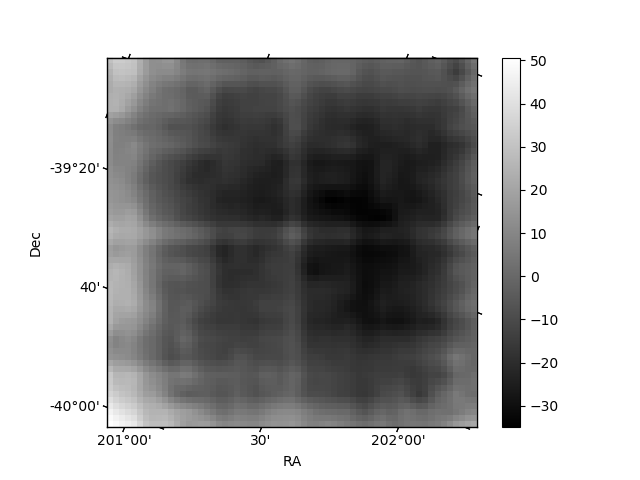
Quadrant B |
|---|---|---|---|
| Quadrant D | 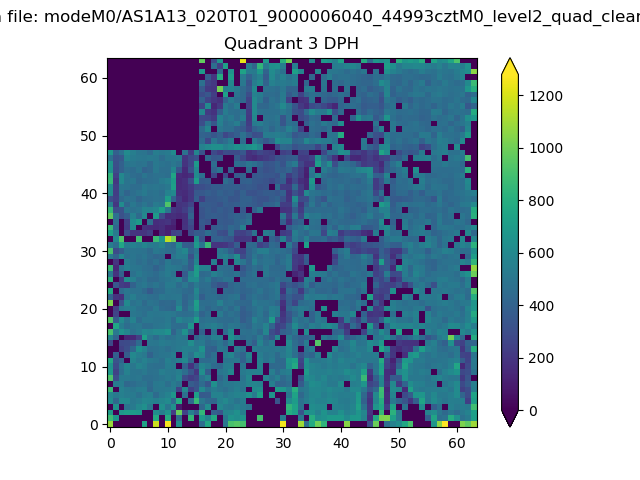 |
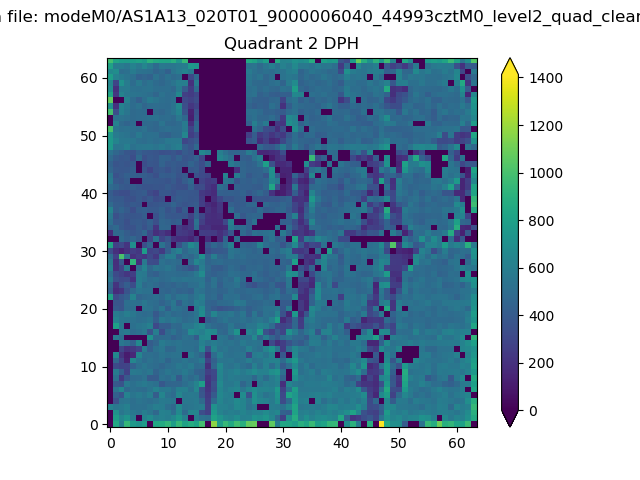 |
Quadrant C |
| Plot type | Count rate plots | Images |
|---|---|---|
| Comparison with Poisson distribution Blue bars denote a histogram of data divided into 1 sec bins. Red curve is a Poisson curve with rate = median count rate of data. |
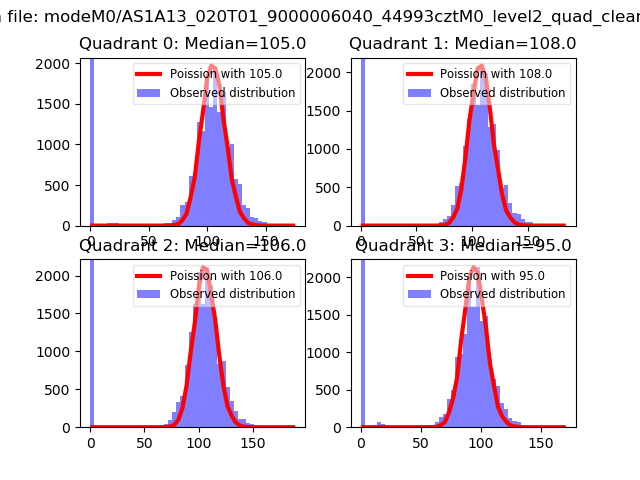 |
 |
| Quadrant-wise count rates Data is divided into 100 sec bins |
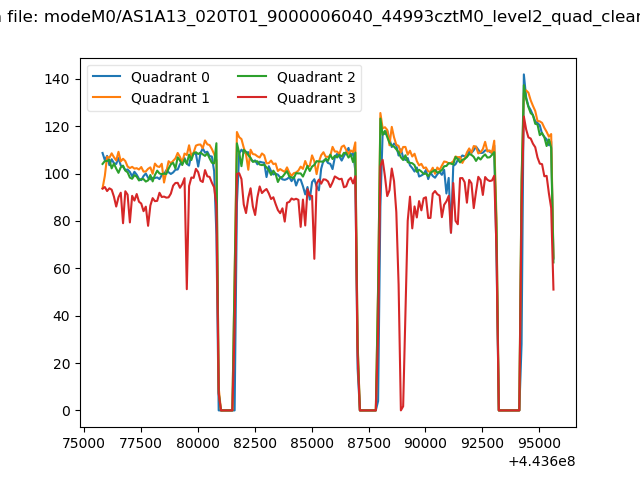 |
|
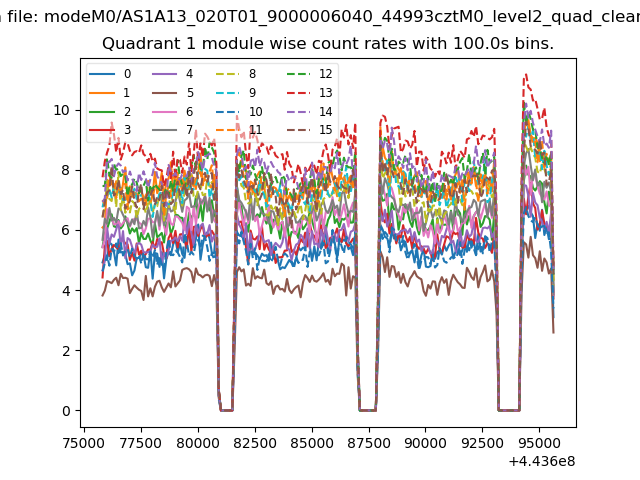
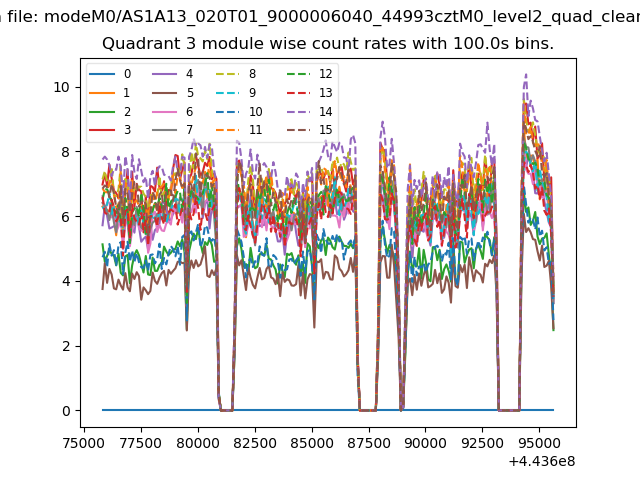
| Module-wise count rates for Quadrant A Data is divided into 100 sec bins |
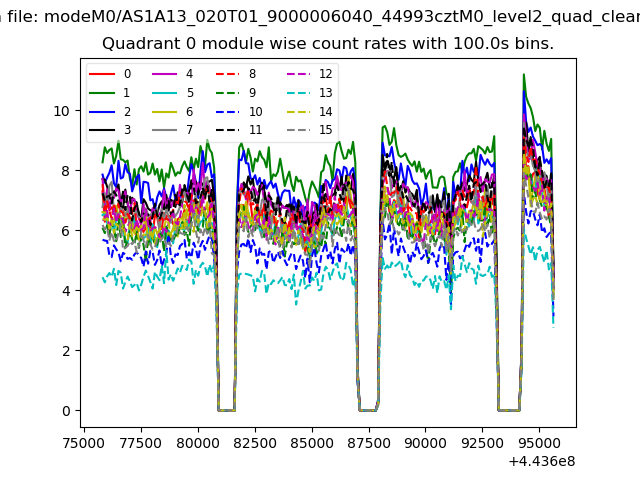 |
 |
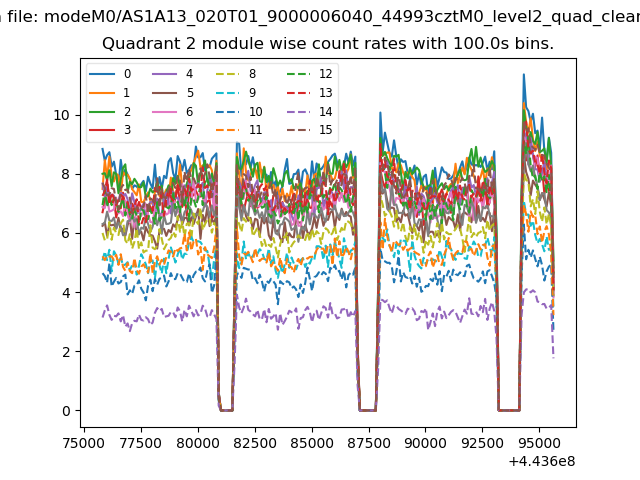
| Module-wise count rates for Quadrant B Data is divided into 100 sec bins |
 |
 |
| Module-wise count rates for Quadrant C Data is divided into 100 sec bins |
 |
 |
| Module-wise count rates for Quadrant D Data is divided into 100 sec bins |
 |
 |
| Parameter | Plot |
|---|---|
| CZT HV Monitor | 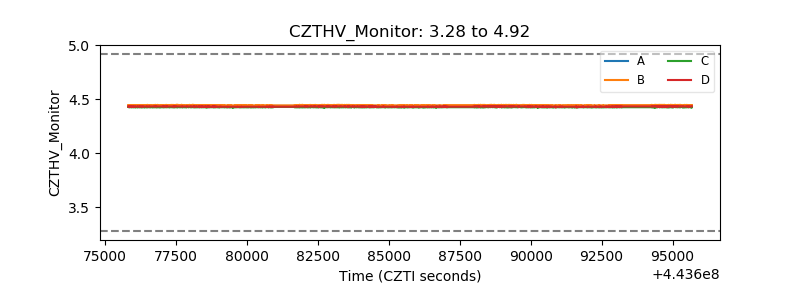 |
| D_VDD | 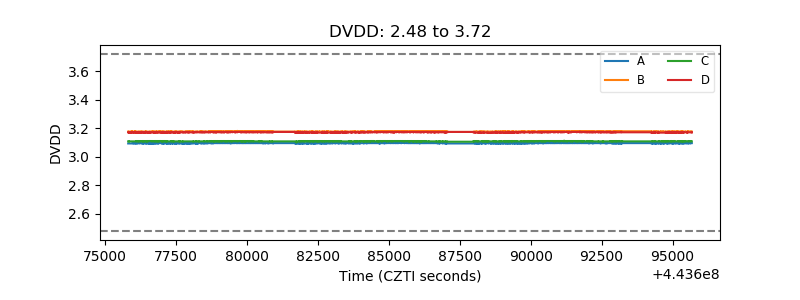 |
| Temperature 1 | 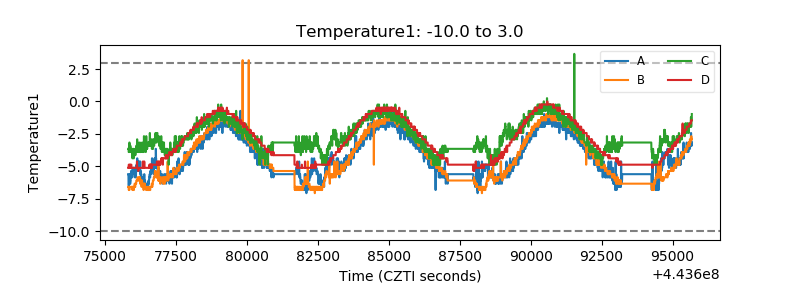 |
| Veto HV Monitor | 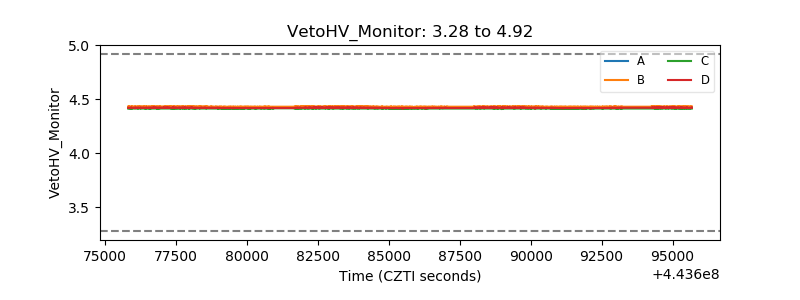 |
| Veto LLD | 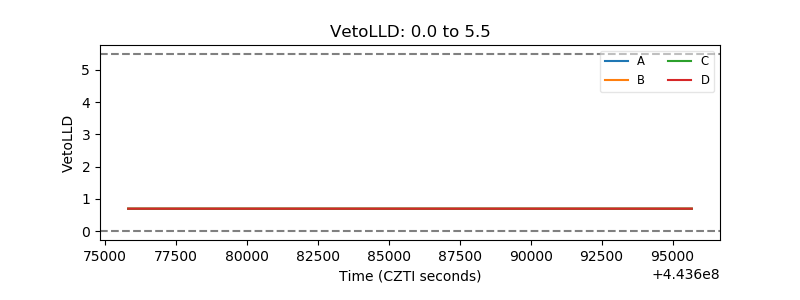 |
| Alpha Counter | 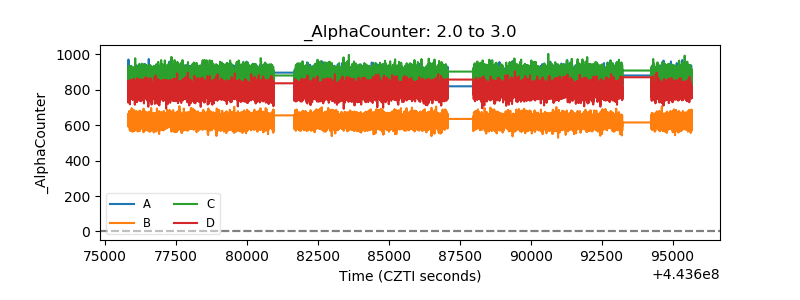 |
| _CPM_Rate | 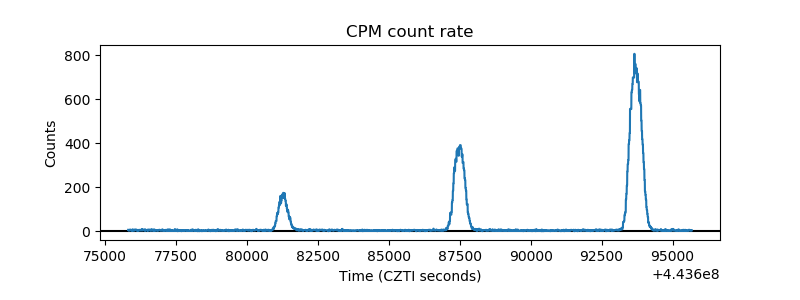 |
| CZT Counter | 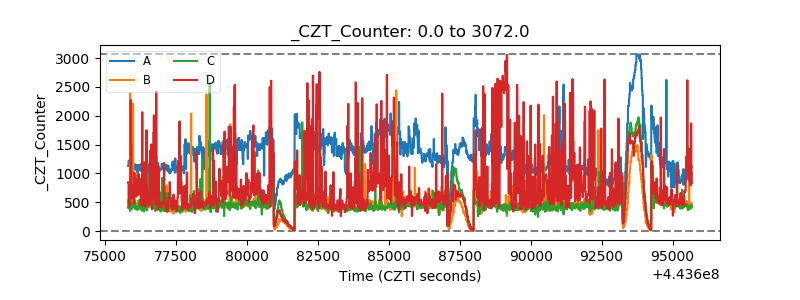 |
| +2.5 Volts monitor | 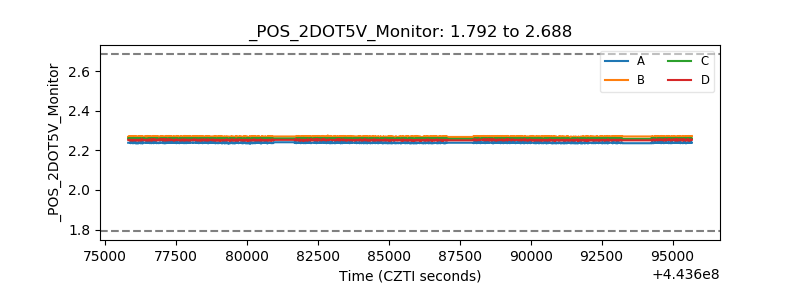 |
| +5 Volts monitor | 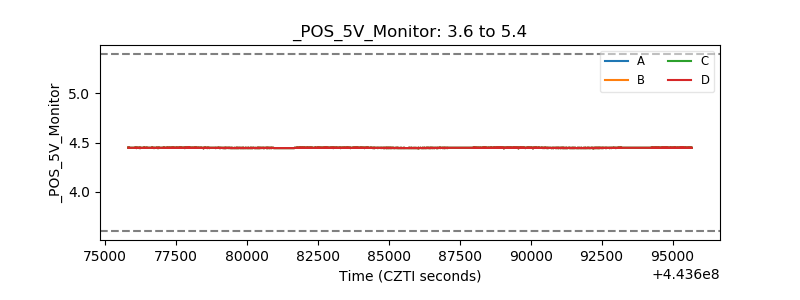 |
| _ROLL_ROT | 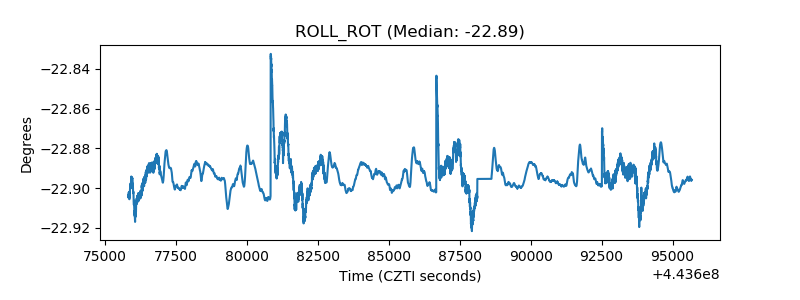 |
| _Roll_DEC | 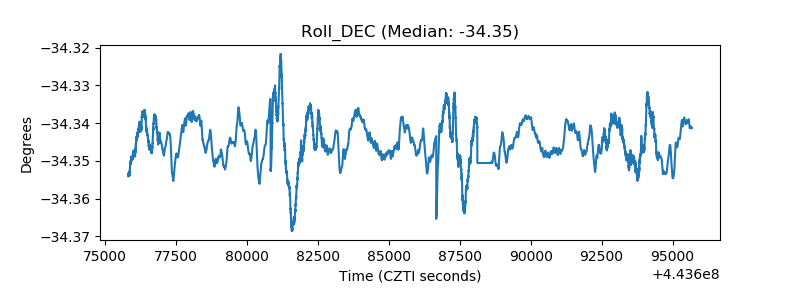 |
| _Roll_RA | 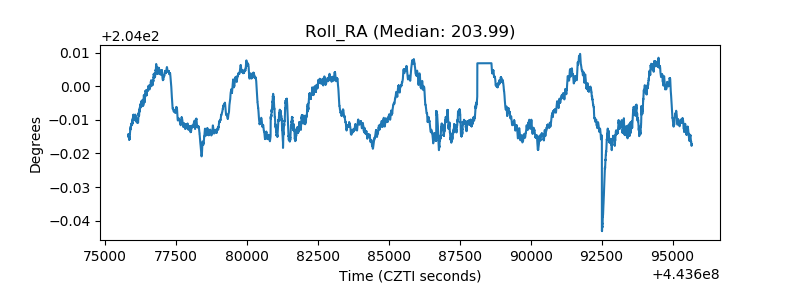 |
| Veto Counter | 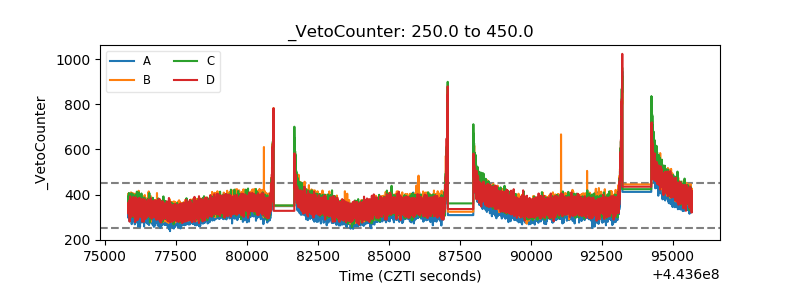 |