| Param | Original file | Final file |
|---|---|---|
| Filename | modeM0/AS1A13_020T01_9000006040_44994cztM0_level2.fits | modeM0/AS1A13_020T01_9000006040_44994cztM0_level2_quad_clean.evt |
| Size (bytes) | 586,543,680 | 97,623,360 |
| Size | 559.4 MB | 93.1 MB |
| Events in quadrant A | 8,770,910 | 596,446 |
| Events in quadrant B | 3,121,821 | 699,010 |
| Events in quadrant C | 2,864,547 | 680,923 |
| Events in quadrant D | 6,494,551 | 563,942 |
| Mode SS | |||
|---|---|---|---|
| Quadrant | BADHDUFLAG | Total packets | Discarded packets |
| A | 0 | 122 | 0 |
| B | 0 | 122 | 0 |
| C | 0 | 122 | 0 |
| D | 0 | 122 | 0 |
| Mode M9 | |||
|---|---|---|---|
| Quadrant | BADHDUFLAG | Total packets | Discarded packets |
| A | 0 | 11 | 0 |
| B | 0 | 11 | 0 |
| C | 0 | 11 | 0 |
| D | 0 | 11 | 0 |
| Mode M0 | |||
|---|---|---|---|
| Quadrant | BADHDUFLAG | Total packets | Discarded packets |
| A | 0 | 30130 | 4 |
| B | 0 | 13062 | 1 |
| C | 0 | 12613 | 1 |
| D | 0 | 23382 | 1 |
| Quadrant | Total seconds | Saturated seconds | Saturation percentage |
|---|---|---|---|
| A | 5942 | 1142 | 19.219118% |
| B | 5943 | 131 | 2.204274% |
| C | 5943 | 92 | 1.548040% |
| D | 5943 | 785 | 13.208817% |
Noise dominated data is calculated using 1-second bins in cleaned event files. If a bin has >2000 counts, and if more than 50% of those come from <1% of pixels, then it is considered to be noise-dominated and hence unusable.
| Quadrant | # 1 sec bins | Bins with >0 counts | Bins with >2000 counts | High rate bins dominated by noise | Noise dominated (total time) | Noise dominated (detector-on time) | Marked lightcurve |
|---|---|---|---|---|---|---|---|
| A | 7047 | 5943 | 978 | 978 | 13.88% | 16.46% | 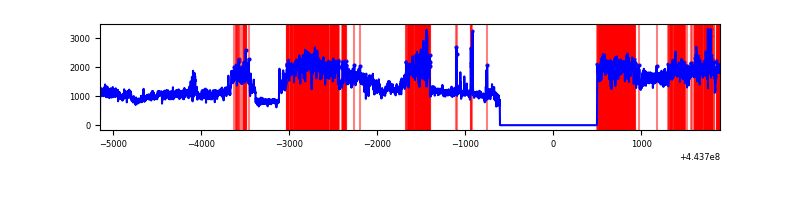 |
| B | 7048 | 5944 | 14 | 14 | 0.20% | 0.24% | 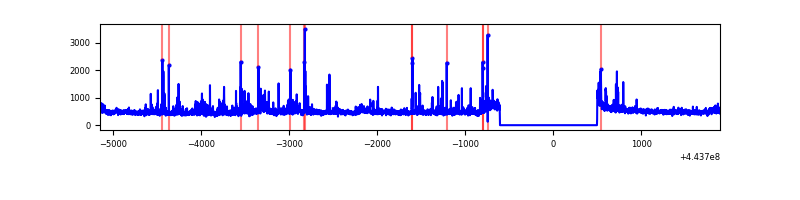 |
| C | 7048 | 5944 | 22 | 22 | 0.31% | 0.37% | 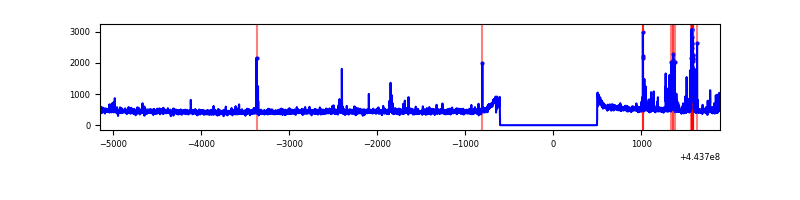 |
| D | 7048 | 5944 | 645 | 645 | 9.15% | 10.85% | 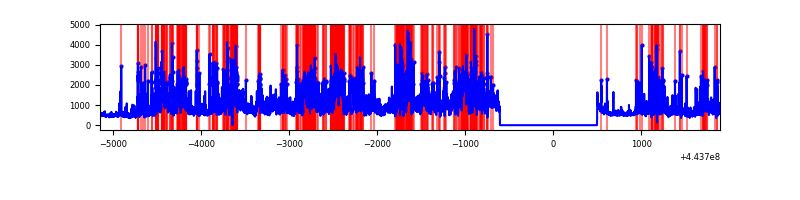 |
Top three noisy pixels from each quadrant. If the there are fewer than three noisy pixels in the level2.evt file, extra rows are filled as -1
| Pixel properties | Quadrant properties | ||||||
|---|---|---|---|---|---|---|---|
| Quadrant | DetID | PixID | Counts | Sigma | Mean | Median | Sigma |
| A | 0 | 247 | 3632407 | 25997.85 | 675 | 660 | 139.7 |
| A | 10 | 83 | 2104057 | 15057.16 | 675 | 660 | 139.7 |
| A | 0 | 226 | 280841 | 2005.67 | 675 | 660 | 139.7 |
| B | 5 | 255 | 98959 | 722.58 | 695 | 676 | 136.0 |
| B | 10 | 3 | 50249 | 364.46 | 695 | 676 | 136.0 |
| B | 0 | 155 | 41264 | 298.41 | 695 | 676 | 136.0 |
| C | 14 | 254 | 52465 | 320.22 | 691 | 696 | 161.7 |
| C | 1 | 3 | 52240 | 318.83 | 691 | 696 | 161.7 |
| C | 11 | 16 | 50752 | 309.62 | 691 | 696 | 161.7 |
| D | 11 | 241 | 1687222 | 10228.23 | 659 | 640 | 164.9 |
| D | 13 | 249 | 1451449 | 8798.39 | 659 | 640 | 164.9 |
| D | 5 | 171 | 229055 | 1385.22 | 659 | 640 | 164.9 |
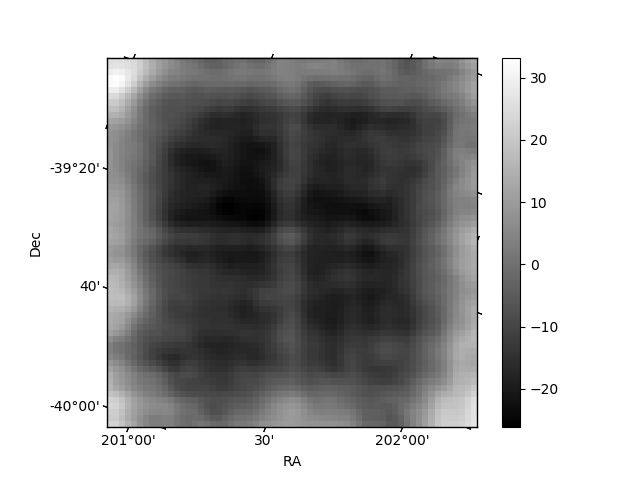
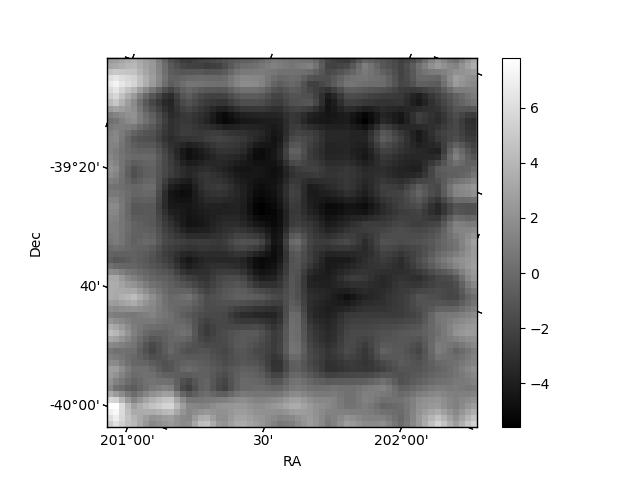
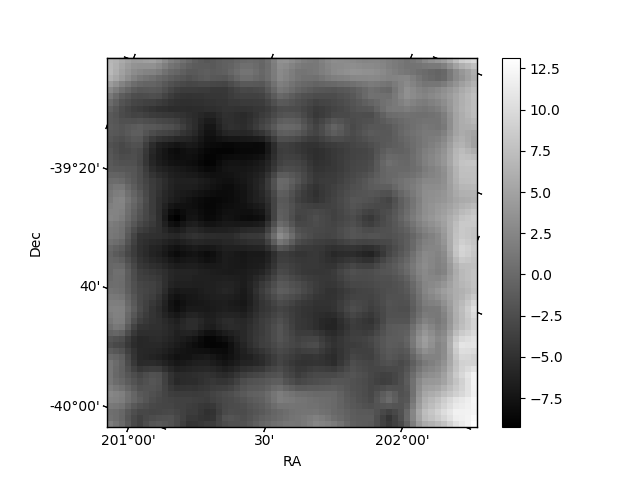
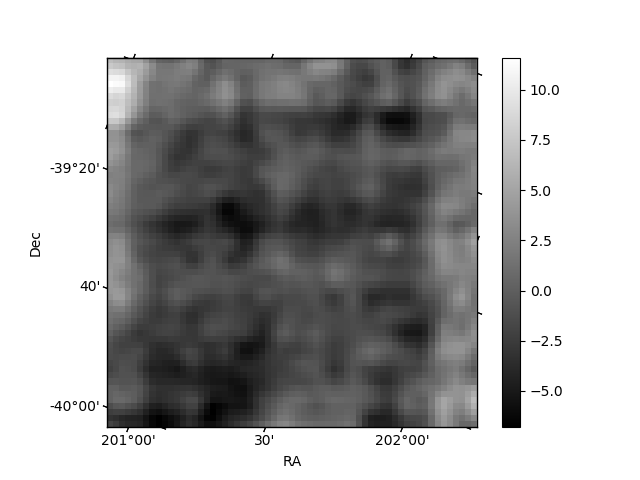
Histogram calculated using DETX and DETY for each event in the final _common_clean file
| Quadrant A | 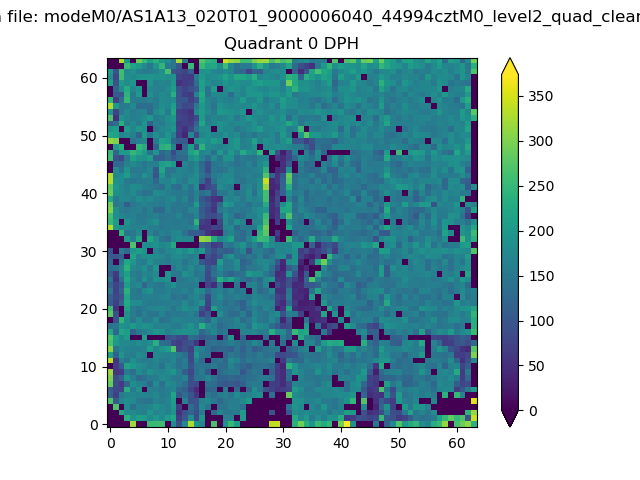 |
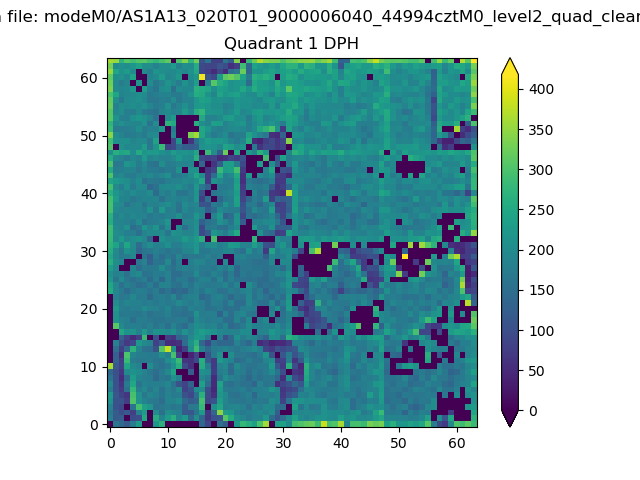 |
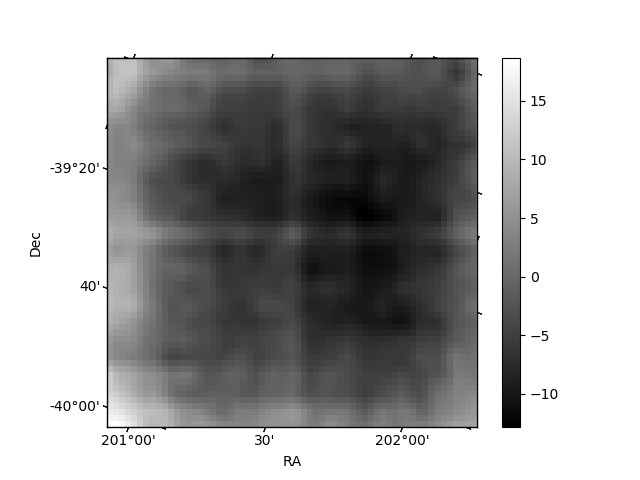
Quadrant B |
|---|---|---|---|
| Quadrant D | 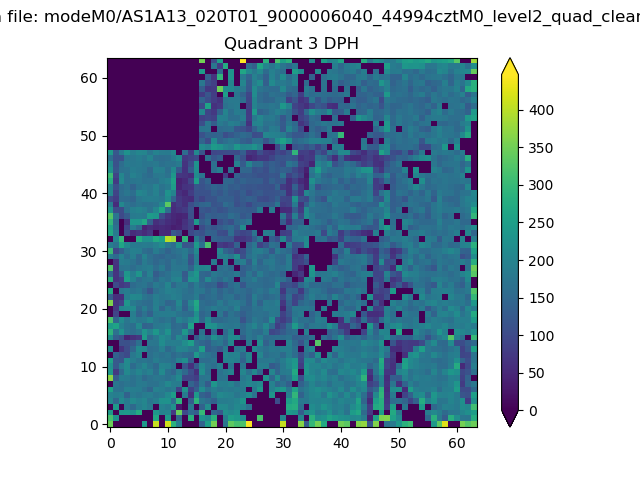 |
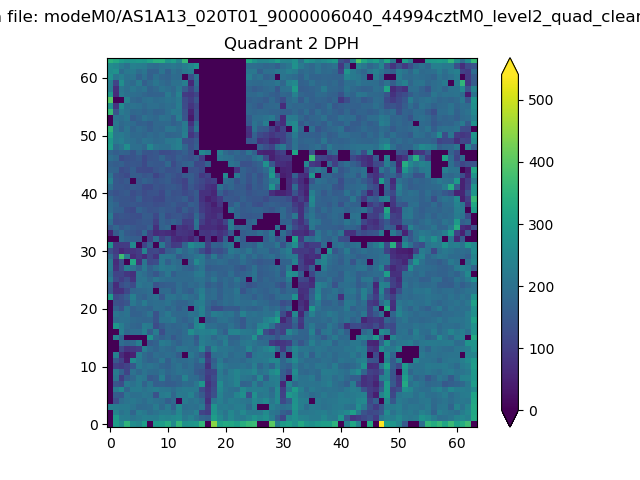 |
Quadrant C |
| Plot type | Count rate plots | Images |
|---|---|---|
| Comparison with Poisson distribution Blue bars denote a histogram of data divided into 1 sec bins. Red curve is a Poisson curve with rate = median count rate of data. |
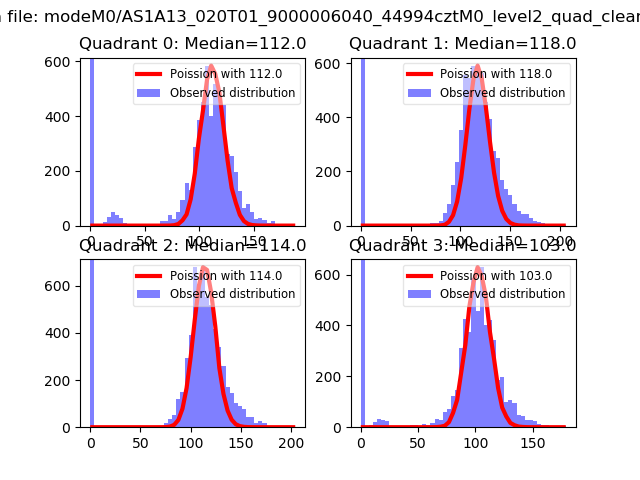 |
 |
| Quadrant-wise count rates Data is divided into 100 sec bins |
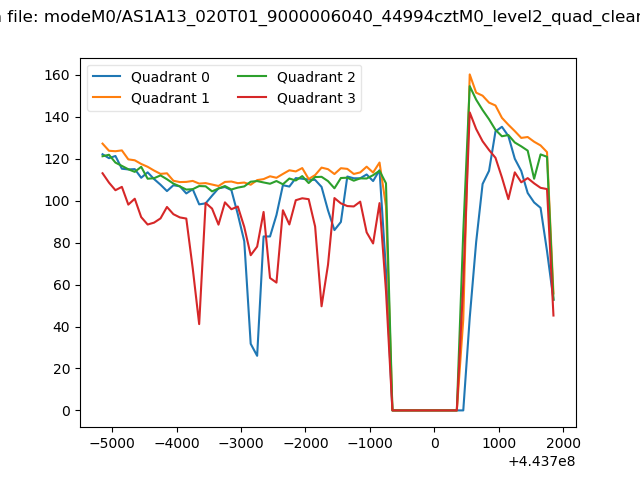 |
|
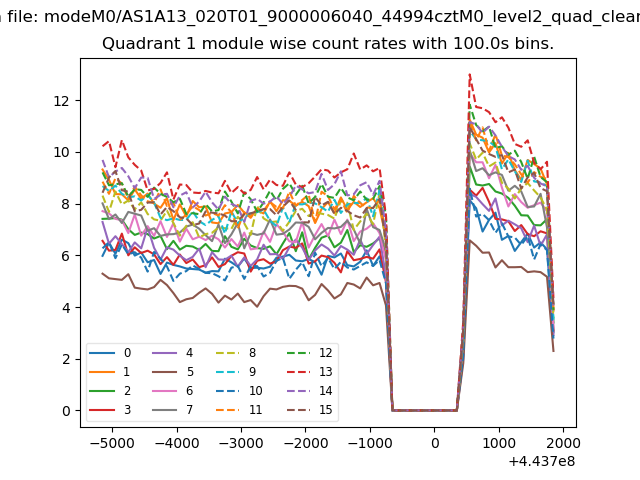
| Module-wise count rates for Quadrant A Data is divided into 100 sec bins |
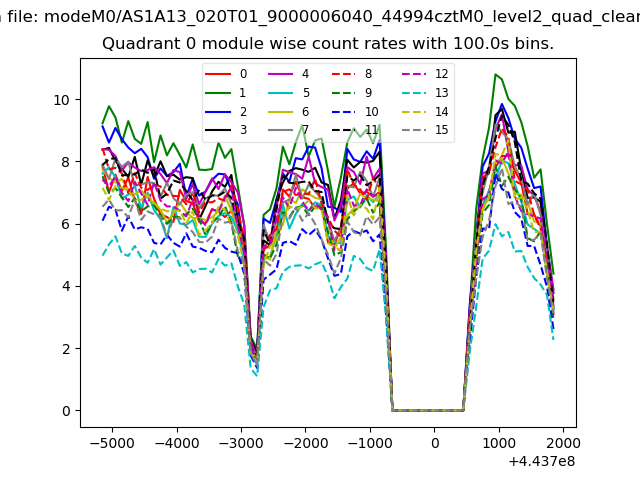 |
 |
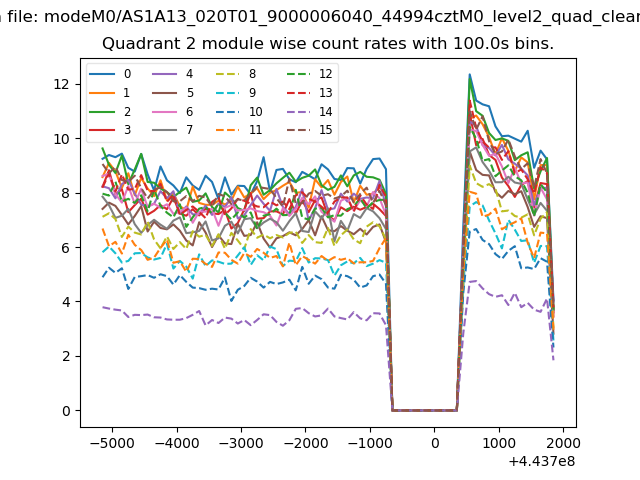
| Module-wise count rates for Quadrant B Data is divided into 100 sec bins |
 |
 |
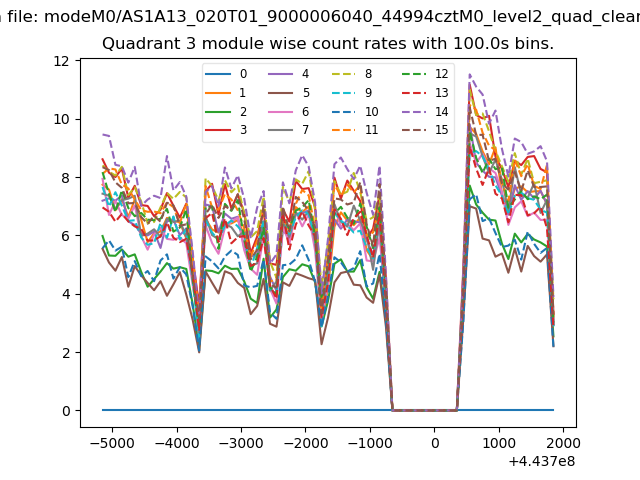
| Module-wise count rates for Quadrant C Data is divided into 100 sec bins |
 |
 |
| Module-wise count rates for Quadrant D Data is divided into 100 sec bins |
 |
 |
| Parameter | Plot |
|---|---|
| CZT HV Monitor | 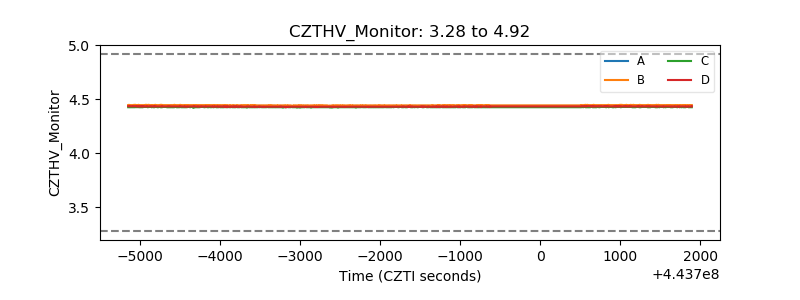 |
| D_VDD | 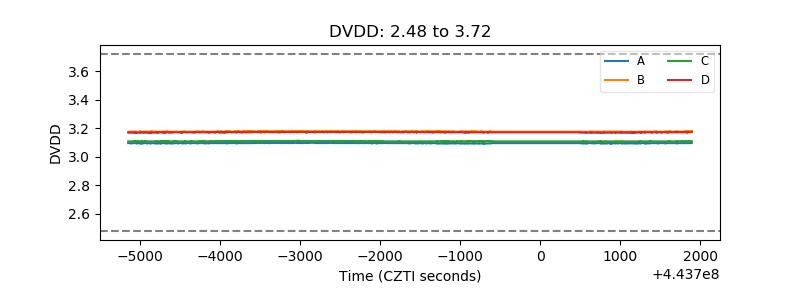 |
| Temperature 1 | 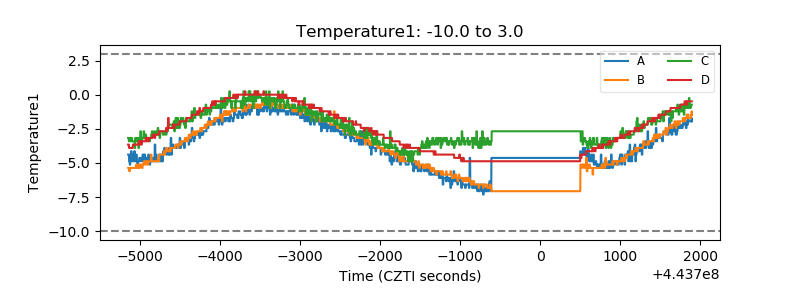 |
| Veto HV Monitor | 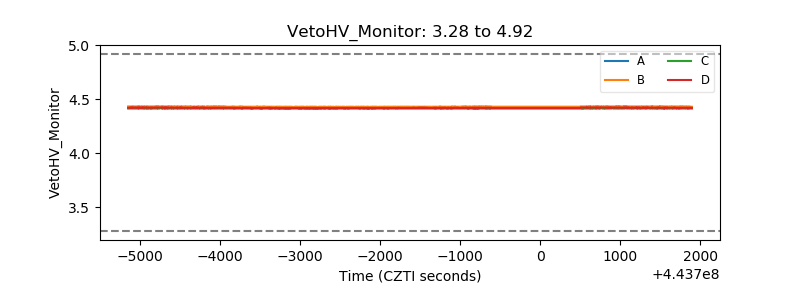 |
| Veto LLD | 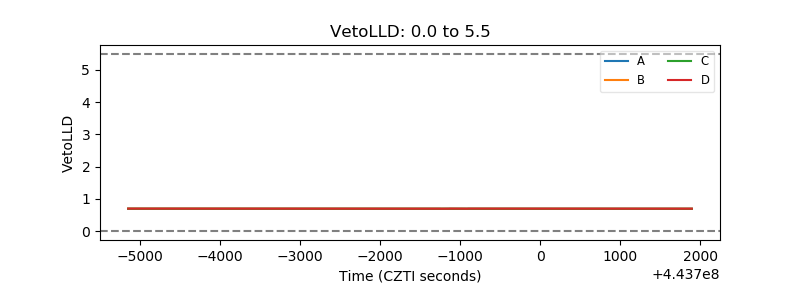 |
| Alpha Counter | 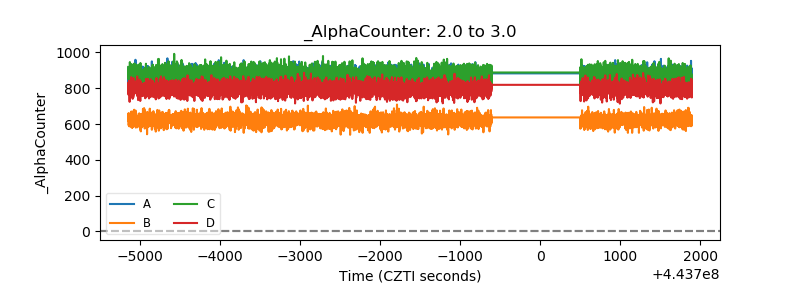 |
| _CPM_Rate | 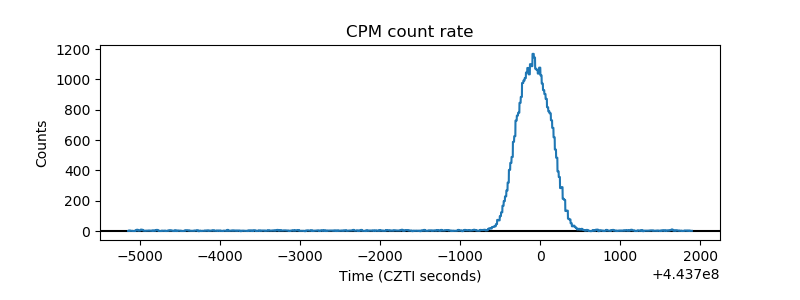 |
| CZT Counter | 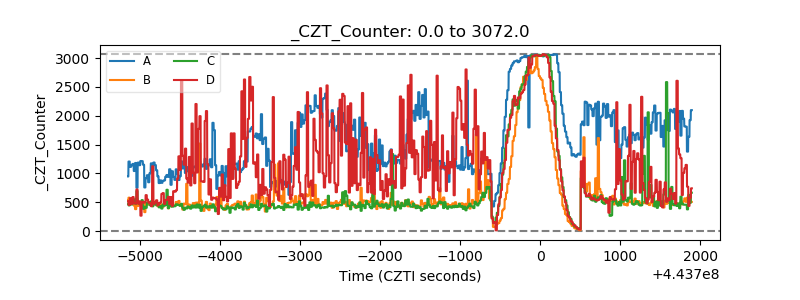 |
| +2.5 Volts monitor | 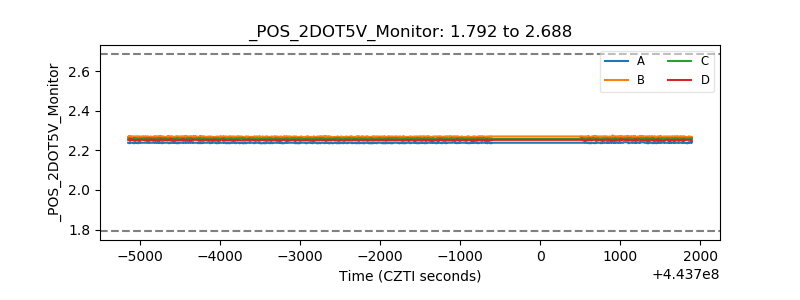 |
| +5 Volts monitor | 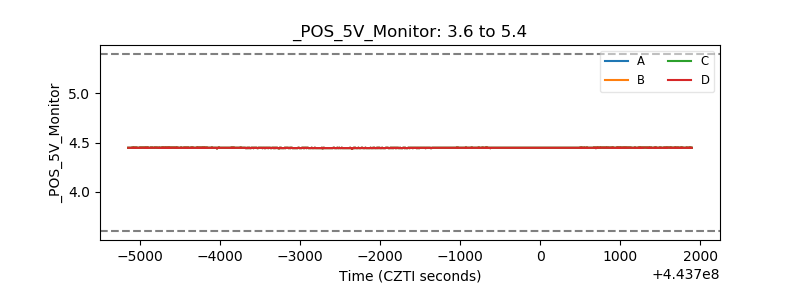 |
| _ROLL_ROT | 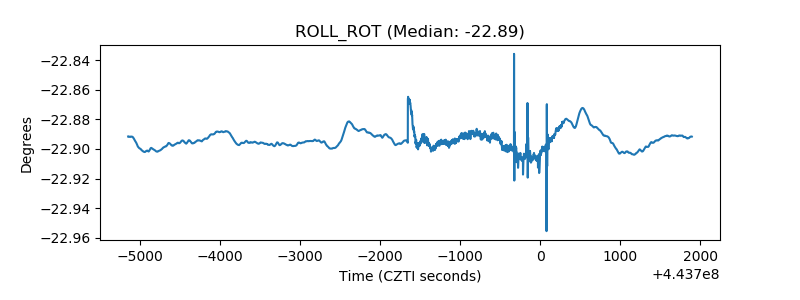 |
| _Roll_DEC | 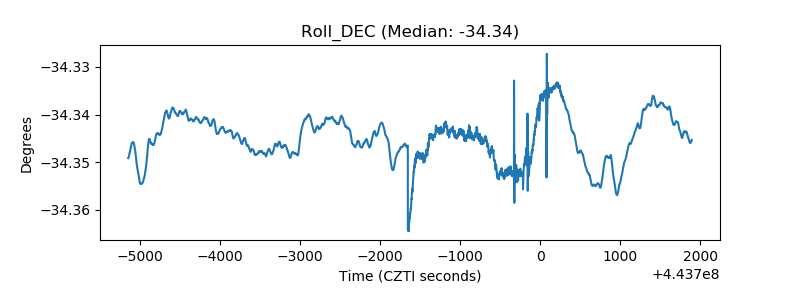 |
| _Roll_RA | 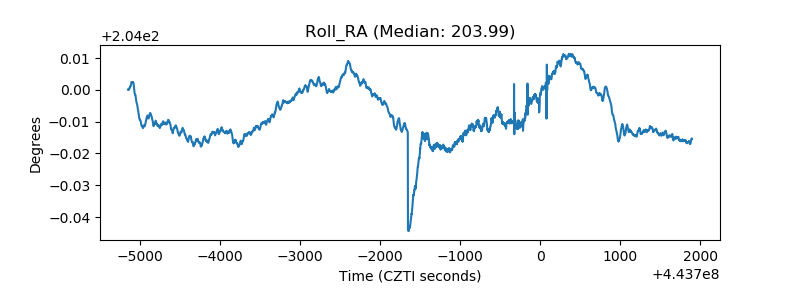 |
| Veto Counter | 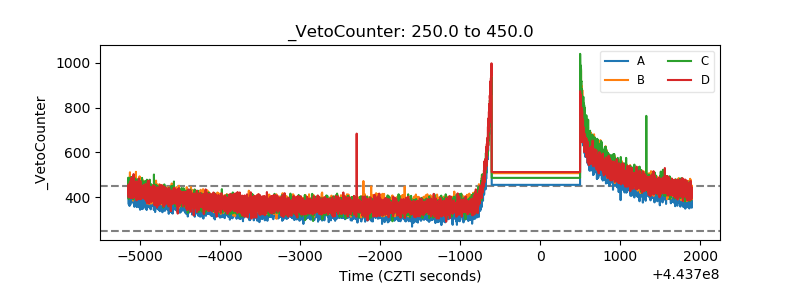 |