| Param | Original file | Final file |
|---|---|---|
| Filename | modeM0/AS1A13_020T01_9000006040_44995cztM0_level2.fits | modeM0/AS1A13_020T01_9000006040_44995cztM0_level2_quad_clean.evt |
| Size (bytes) | 652,089,600 | 96,001,920 |
| Size | 621.9 MB | 91.6 MB |
| Events in quadrant A | 10,096,169 | 487,154 |
| Events in quadrant B | 3,270,769 | 733,462 |
| Events in quadrant C | 3,172,941 | 705,407 |
| Events in quadrant D | 7,141,670 | 568,770 |
| Mode SS | |||
|---|---|---|---|
| Quadrant | BADHDUFLAG | Total packets | Discarded packets |
| A | 0 | 120 | 0 |
| B | 0 | 120 | 0 |
| C | 0 | 120 | 0 |
| D | 0 | 120 | 0 |
| Mode M9 | |||
|---|---|---|---|
| Quadrant | BADHDUFLAG | Total packets | Discarded packets |
| A | 0 | 12 | 0 |
| B | 0 | 12 | 0 |
| C | 0 | 12 | 0 |
| D | 0 | 12 | 0 |
| Mode M0 | |||
|---|---|---|---|
| Quadrant | BADHDUFLAG | Total packets | Discarded packets |
| A | 0 | 33915 | 1 |
| B | 0 | 13378 | 1 |
| C | 0 | 13231 | 1 |
| D | 0 | 25286 | 1 |
| Quadrant | Total seconds | Saturated seconds | Saturation percentage |
|---|---|---|---|
| A | 5897 | 2366 | 40.122096% |
| B | 5896 | 99 | 1.679104% |
| C | 5896 | 87 | 1.475577% |
| D | 5896 | 931 | 15.790366% |
Noise dominated data is calculated using 1-second bins in cleaned event files. If a bin has >2000 counts, and if more than 50% of those come from <1% of pixels, then it is considered to be noise-dominated and hence unusable.
| Quadrant | # 1 sec bins | Bins with >0 counts | Bins with >2000 counts | High rate bins dominated by noise | Noise dominated (total time) | Noise dominated (detector-on time) | Marked lightcurve |
|---|---|---|---|---|---|---|---|
| A | 7112 | 5898 | 2169 | 2169 | 30.50% | 36.78% | 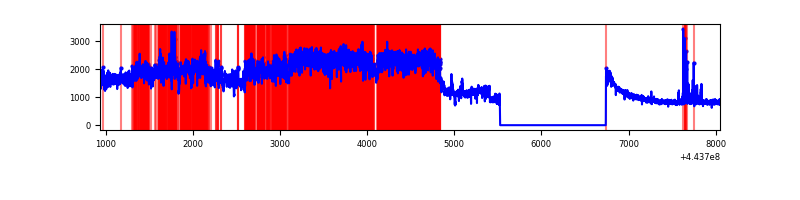 |
| B | 7111 | 5897 | 12 | 12 | 0.17% | 0.20% | 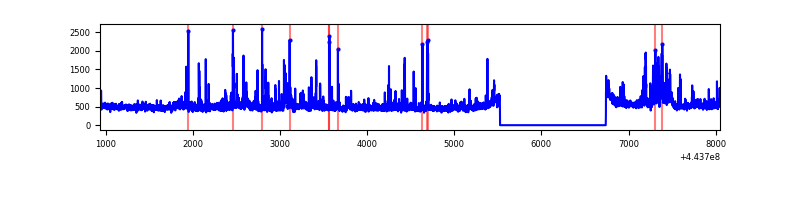 |
| C | 7111 | 5897 | 55 | 55 | 0.77% | 0.93% | 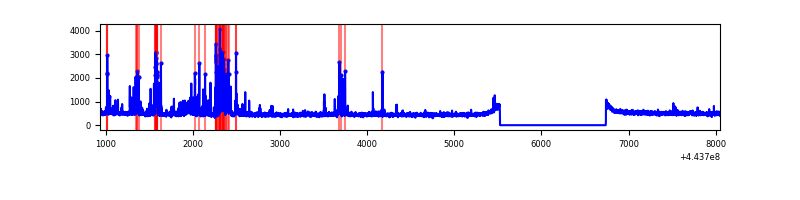 |
| D | 7111 | 5897 | 854 | 854 | 12.01% | 14.48% | 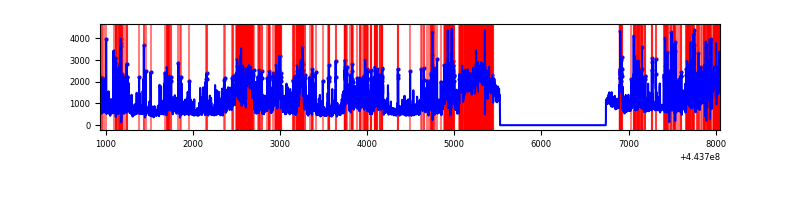 |
Top three noisy pixels from each quadrant. If the there are fewer than three noisy pixels in the level2.evt file, extra rows are filled as -1
| Pixel properties | Quadrant properties | ||||||
|---|---|---|---|---|---|---|---|
| Quadrant | DetID | PixID | Counts | Sigma | Mean | Median | Sigma |
| A | 0 | 247 | 5024365 | 36908.65 | 661 | 647 | 136.1 |
| A | 10 | 83 | 2031778 | 14922.47 | 661 | 647 | 136.1 |
| A | 0 | 226 | 351959 | 2581.05 | 661 | 647 | 136.1 |
| B | 3 | 112 | 127976 | 928.86 | 708 | 690 | 137.0 |
| B | 5 | 255 | 67961 | 490.91 | 708 | 690 | 137.0 |
| B | 4 | 171 | 66031 | 476.82 | 708 | 690 | 137.0 |
| C | 1 | 3 | 177773 | 1082.7 | 701 | 706 | 163.5 |
| C | 14 | 254 | 78404 | 475.09 | 701 | 706 | 163.5 |
| C | 11 | 16 | 50766 | 306.1 | 701 | 706 | 163.5 |
| D | 11 | 241 | 3240209 | 19127.25 | 670 | 650 | 169.4 |
| D | 13 | 249 | 796320 | 4697.86 | 670 | 650 | 169.4 |
| D | 2 | 249 | 175393 | 1031.73 | 670 | 650 | 169.4 |
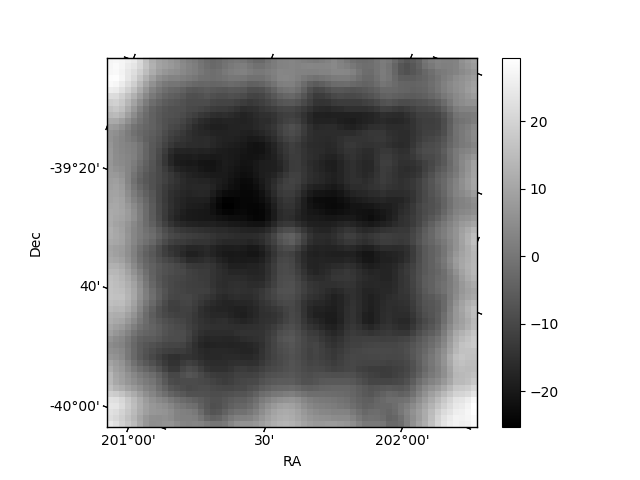
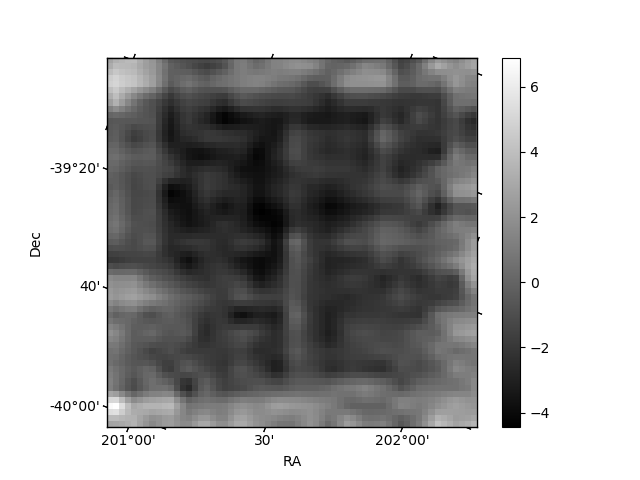
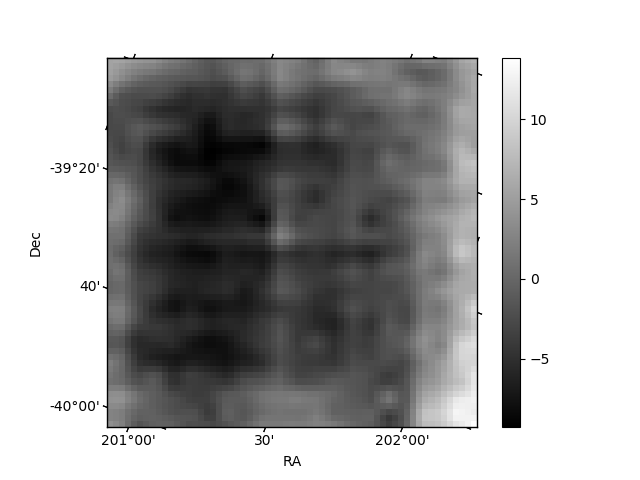
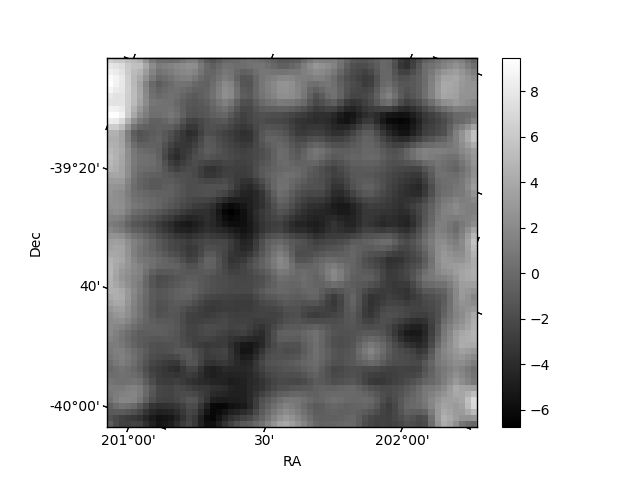
Histogram calculated using DETX and DETY for each event in the final _common_clean file
| Quadrant A | 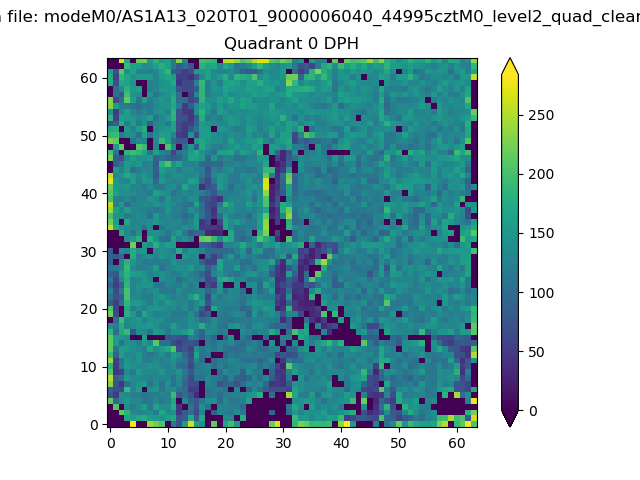 |
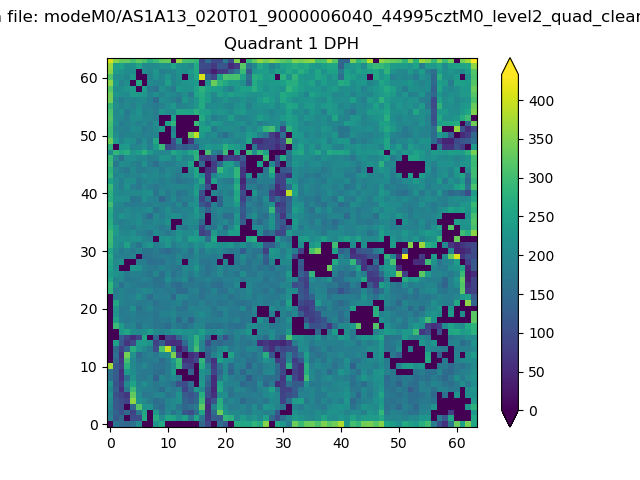 |
Quadrant B |
|---|---|---|---|
| Quadrant D | 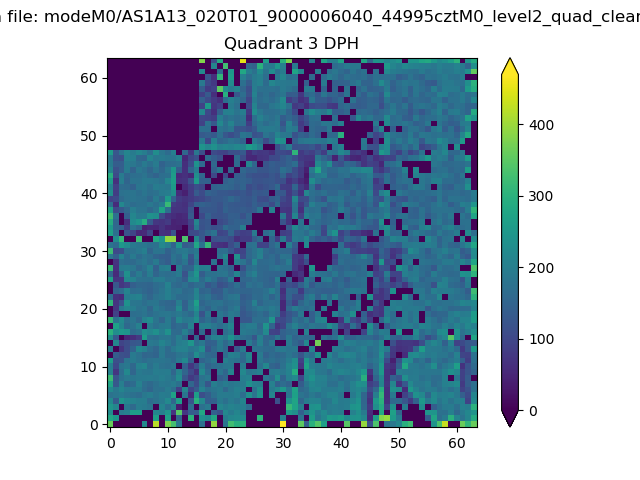 |
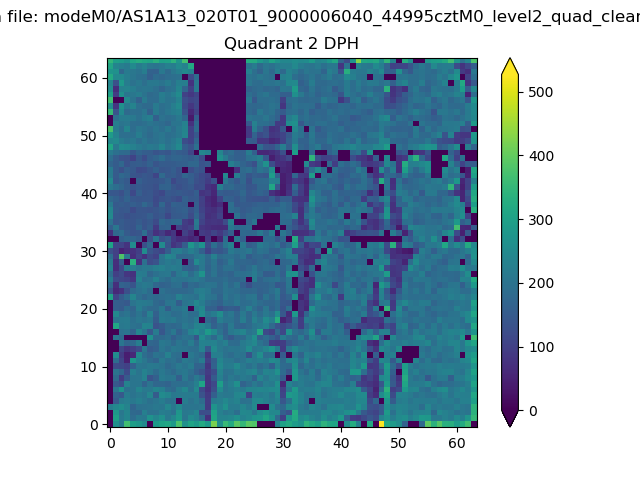 |
Quadrant C |
| Plot type | Count rate plots | Images |
|---|---|---|
| Comparison with Poisson distribution Blue bars denote a histogram of data divided into 1 sec bins. Red curve is a Poisson curve with rate = median count rate of data. |
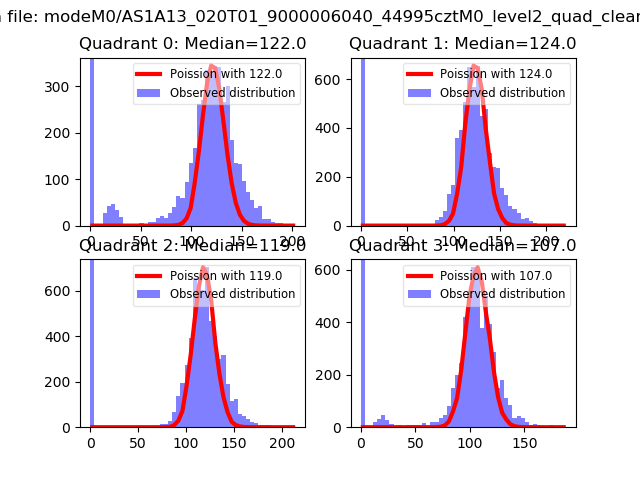 |
 |
| Quadrant-wise count rates Data is divided into 100 sec bins |
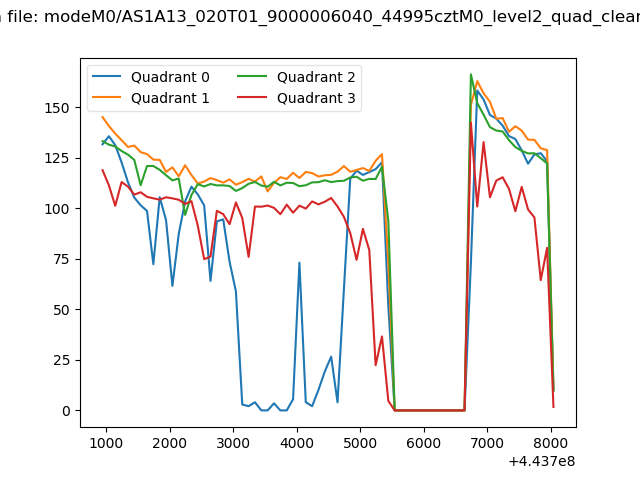 |
|
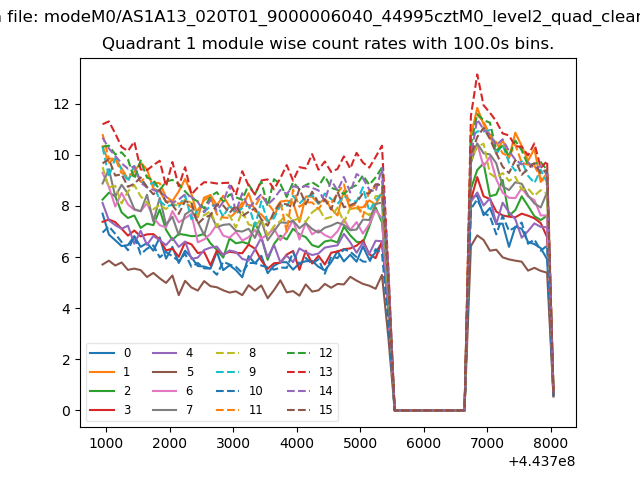
| Module-wise count rates for Quadrant A Data is divided into 100 sec bins |
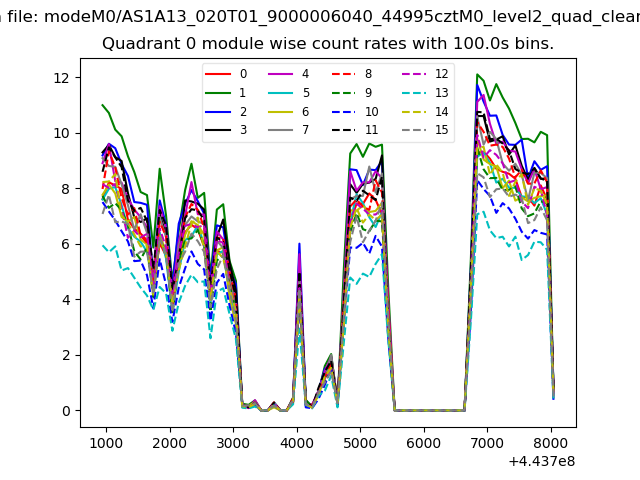 |
 |
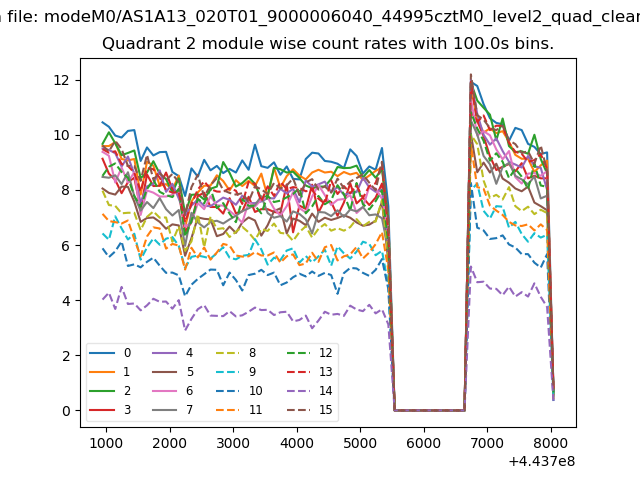
| Module-wise count rates for Quadrant B Data is divided into 100 sec bins |
 |
 |
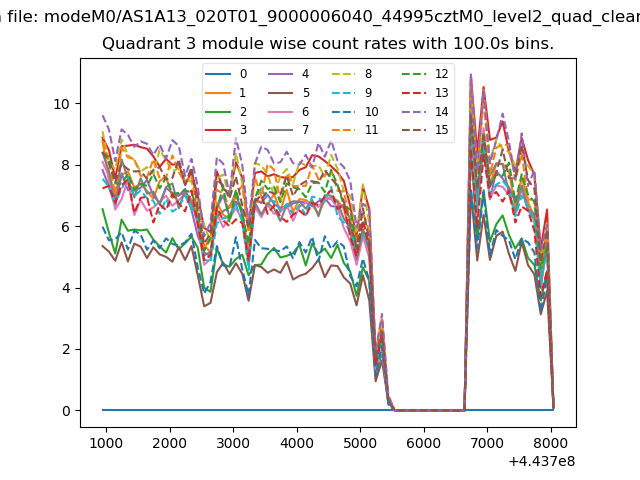
| Module-wise count rates for Quadrant C Data is divided into 100 sec bins |
 |
 |
| Module-wise count rates for Quadrant D Data is divided into 100 sec bins |
 |
 |
| Parameter | Plot |
|---|---|
| CZT HV Monitor | 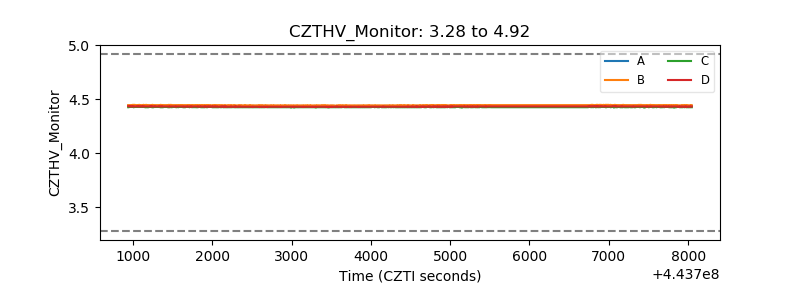 |
| D_VDD | 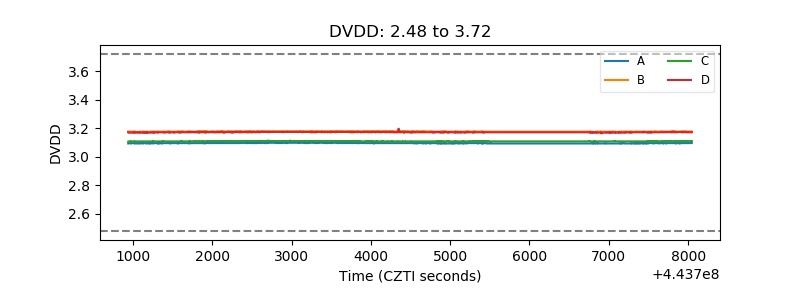 |
| Temperature 1 | 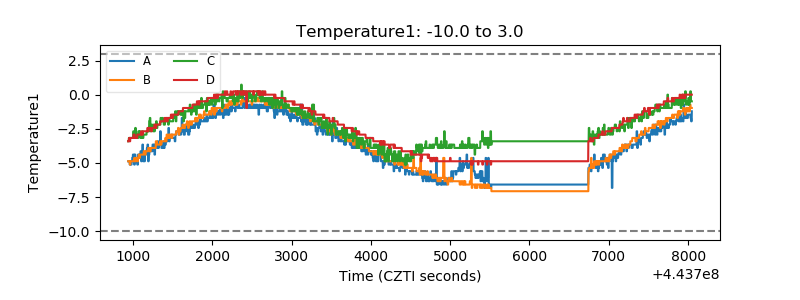 |
| Veto HV Monitor | 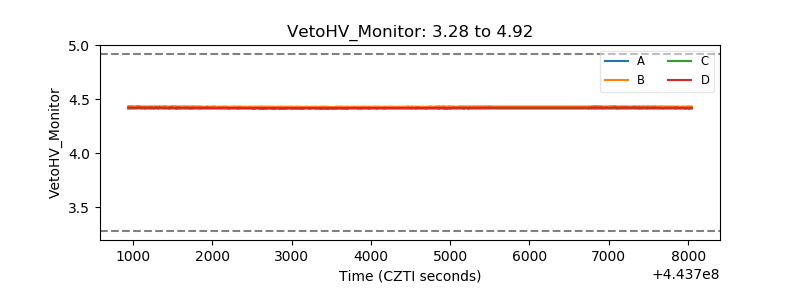 |
| Veto LLD | 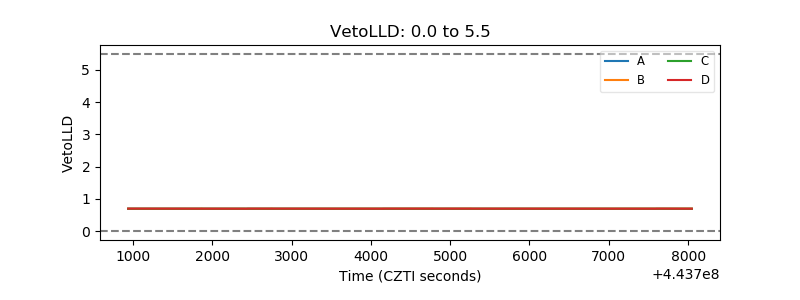 |
| Alpha Counter | 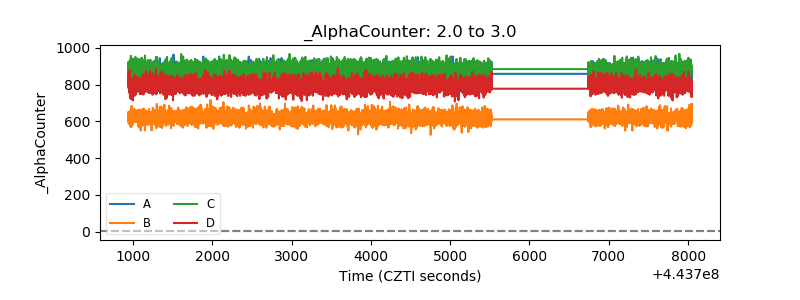 |
| _CPM_Rate | 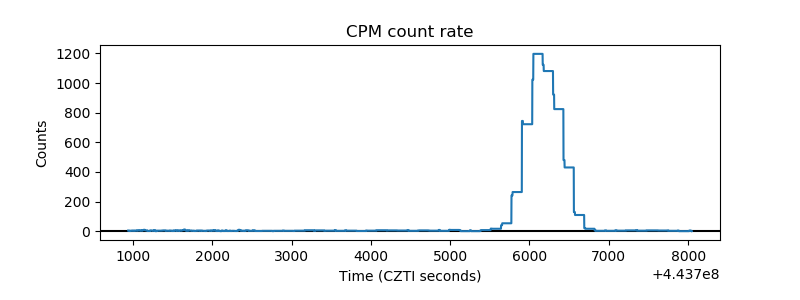 |
| CZT Counter | 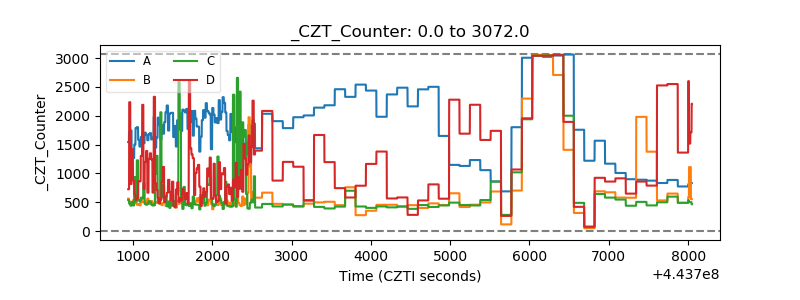 |
| +2.5 Volts monitor | 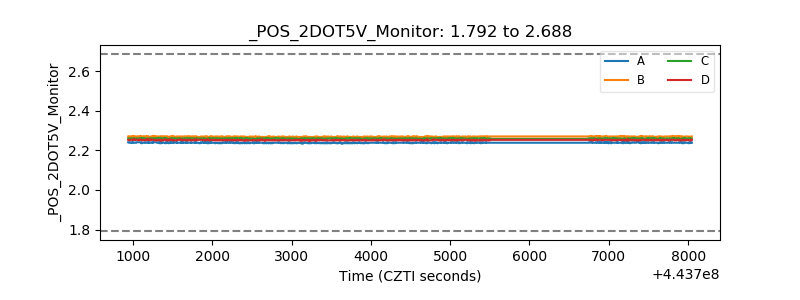 |
| +5 Volts monitor | 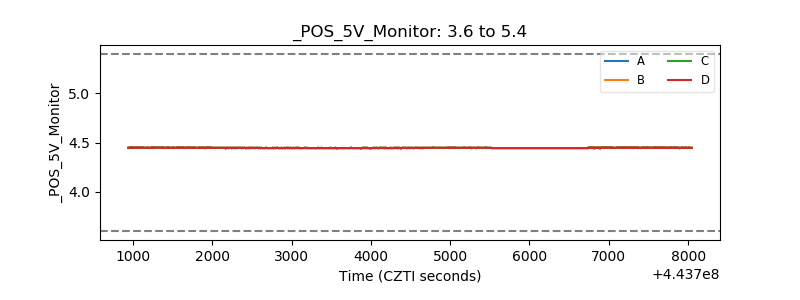 |
| _ROLL_ROT | 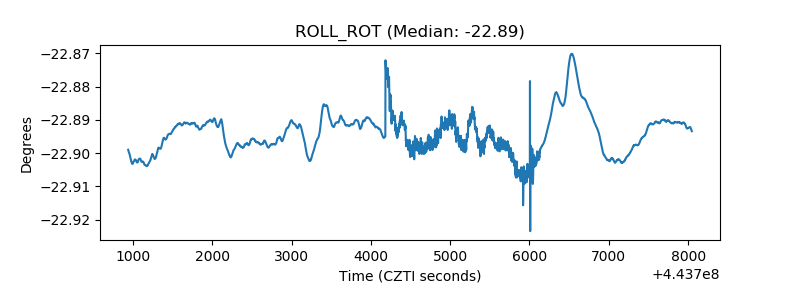 |
| _Roll_DEC |  |
| _Roll_RA | 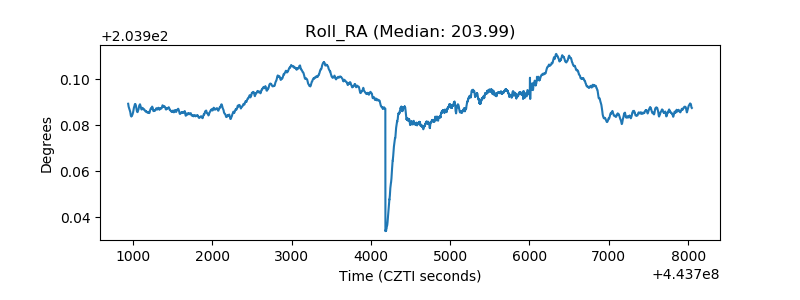 |
| Veto Counter | 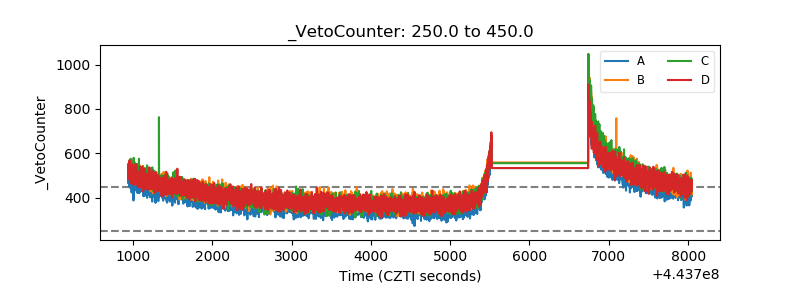 |