| Param | Original file | Final file |
|---|---|---|
| Filename | modeM0/AS1A13_020T01_9000006040_44997cztM0_level2.fits | modeM0/AS1A13_020T01_9000006040_44997cztM0_level2_quad_clean.evt |
| Size (bytes) | 567,394,560 | 114,759,360 |
| Size | 541.1 MB | 109.4 MB |
| Events in quadrant A | 6,861,794 | 772,685 |
| Events in quadrant B | 3,678,977 | 805,442 |
| Events in quadrant C | 3,321,652 | 780,160 |
| Events in quadrant D | 6,623,681 | 651,717 |
| Mode SS | |||
|---|---|---|---|
| Quadrant | BADHDUFLAG | Total packets | Discarded packets |
| A | 0 | 134 | 0 |
| B | 0 | 134 | 0 |
| C | 0 | 134 | 0 |
| D | 0 | 134 | 0 |
| Mode M9 | |||
|---|---|---|---|
| Quadrant | BADHDUFLAG | Total packets | Discarded packets |
| A | 0 | 11 | 0 |
| B | 0 | 11 | 0 |
| C | 0 | 11 | 0 |
| D | 0 | 11 | 0 |
| Mode M0 | |||
|---|---|---|---|
| Quadrant | BADHDUFLAG | Total packets | Discarded packets |
| A | 0 | 25265 | 1 |
| B | 0 | 15253 | 3 |
| C | 0 | 14274 | 1 |
| D | 0 | 24478 | 1 |
| Quadrant | Total seconds | Saturated seconds | Saturation percentage |
|---|---|---|---|
| A | 6673 | 321 | 4.810430% |
| B | 6672 | 183 | 2.742806% |
| C | 6672 | 114 | 1.708633% |
| D | 6673 | 845 | 12.662970% |
Noise dominated data is calculated using 1-second bins in cleaned event files. If a bin has >2000 counts, and if more than 50% of those come from <1% of pixels, then it is considered to be noise-dominated and hence unusable.
| Quadrant | # 1 sec bins | Bins with >0 counts | Bins with >2000 counts | High rate bins dominated by noise | Noise dominated (total time) | Noise dominated (detector-on time) | Marked lightcurve |
|---|---|---|---|---|---|---|---|
| A | 7778 | 6674 | 24 | 24 | 0.31% | 0.36% | 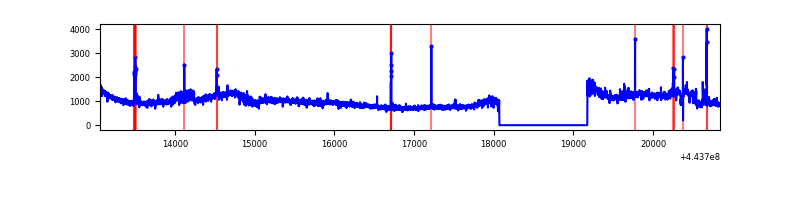 |
| B | 7777 | 6673 | 13 | 13 | 0.17% | 0.19% | 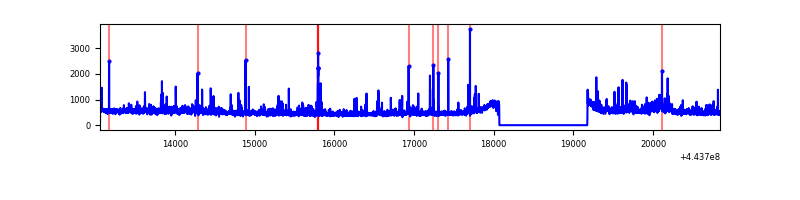 |
| C | 7777 | 6673 | 17 | 17 | 0.22% | 0.25% | 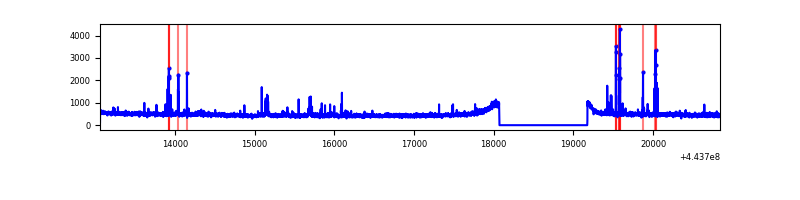 |
| D | 7778 | 6674 | 603 | 603 | 7.75% | 9.04% | 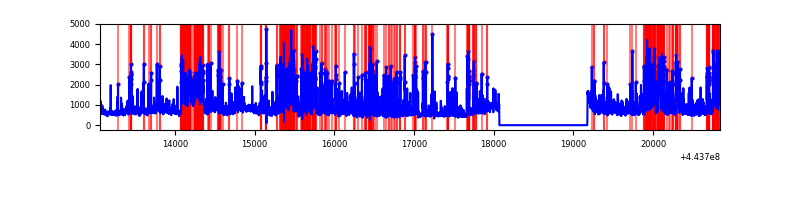 |
Top three noisy pixels from each quadrant. If the there are fewer than three noisy pixels in the level2.evt file, extra rows are filled as -1
| Pixel properties | Quadrant properties | ||||||
|---|---|---|---|---|---|---|---|
| Quadrant | DetID | PixID | Counts | Sigma | Mean | Median | Sigma |
| A | 10 | 83 | 2640378 | 15815.26 | 807 | 789 | 166.9 |
| A | 0 | 247 | 946465 | 5666.07 | 807 | 789 | 166.9 |
| A | 0 | 226 | 59897 | 354.15 | 807 | 789 | 166.9 |
| B | 0 | 155 | 107359 | 677.88 | 810 | 788 | 157.2 |
| B | 0 | 168 | 100734 | 635.74 | 810 | 788 | 157.2 |
| B | 5 | 255 | 71525 | 449.95 | 810 | 788 | 157.2 |
| C | 12 | 2 | 52194 | 273.09 | 800 | 806 | 188.2 |
| C | 14 | 254 | 46129 | 240.86 | 800 | 806 | 188.2 |
| C | 1 | 3 | 39597 | 206.15 | 800 | 806 | 188.2 |
| D | 1 | 52 | 1196303 | 6177.35 | 773 | 750 | 193.5 |
| D | 13 | 249 | 1042839 | 5384.41 | 773 | 750 | 193.5 |
| D | 11 | 241 | 556048 | 2869.19 | 773 | 750 | 193.5 |
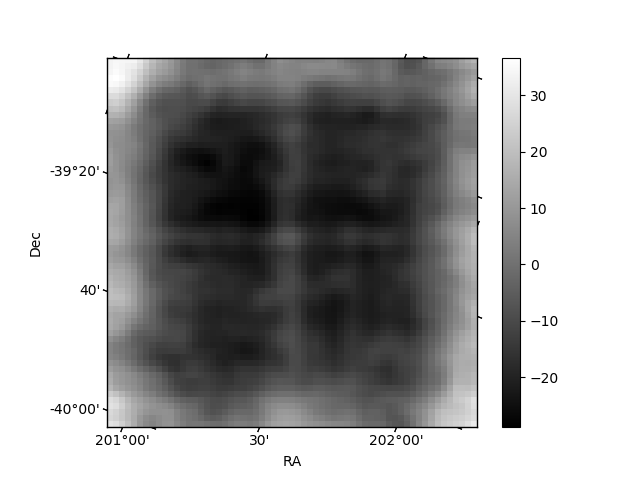
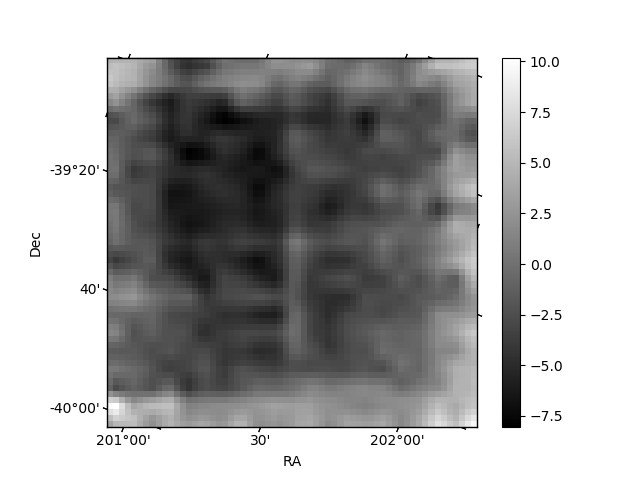
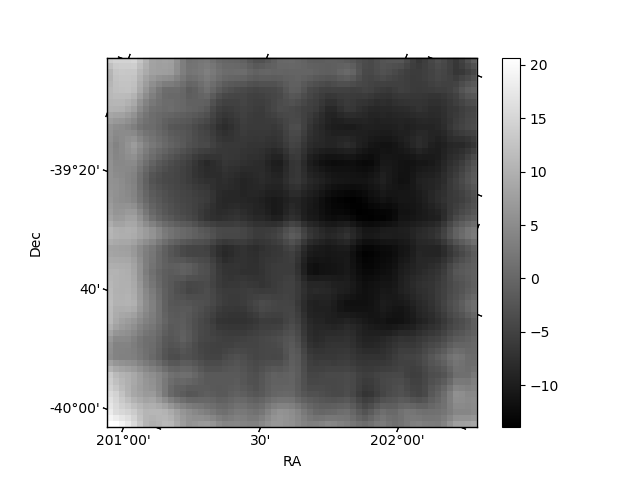
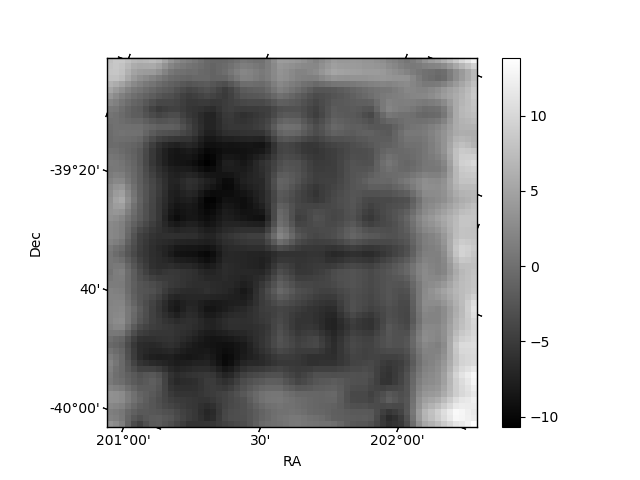
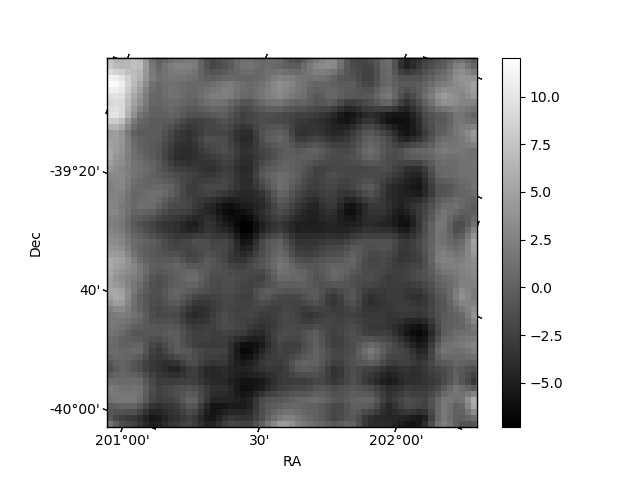
Histogram calculated using DETX and DETY for each event in the final _common_clean file
| Quadrant A | 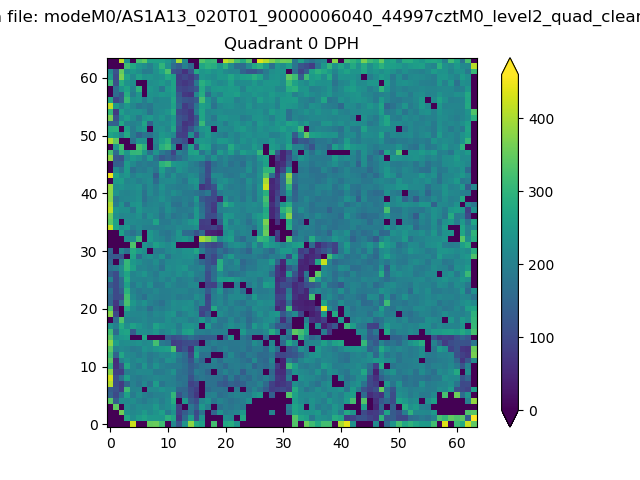 |
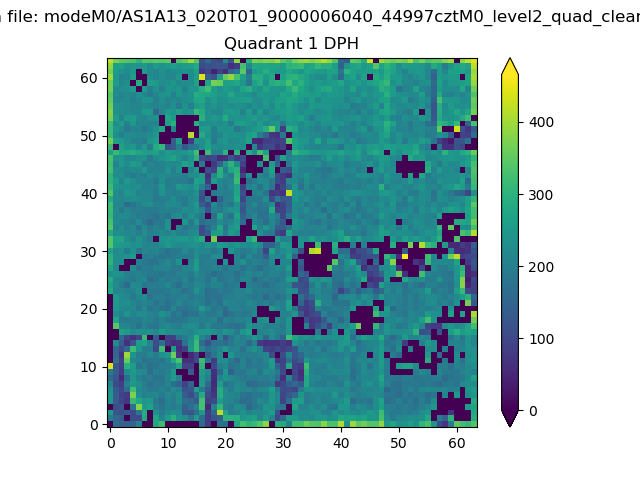 |
Quadrant B |
|---|---|---|---|
| Quadrant D | 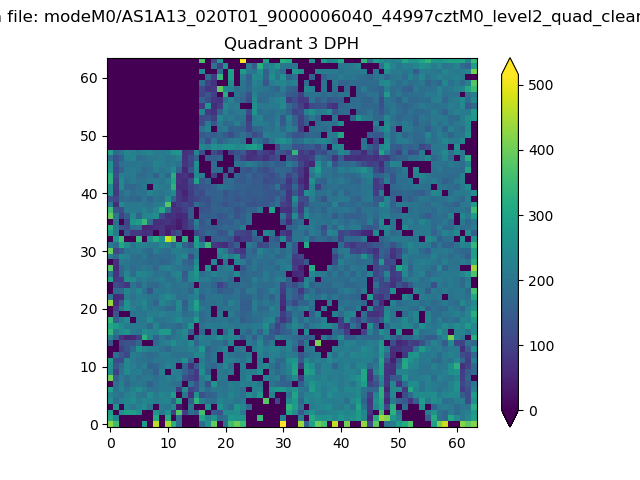 |
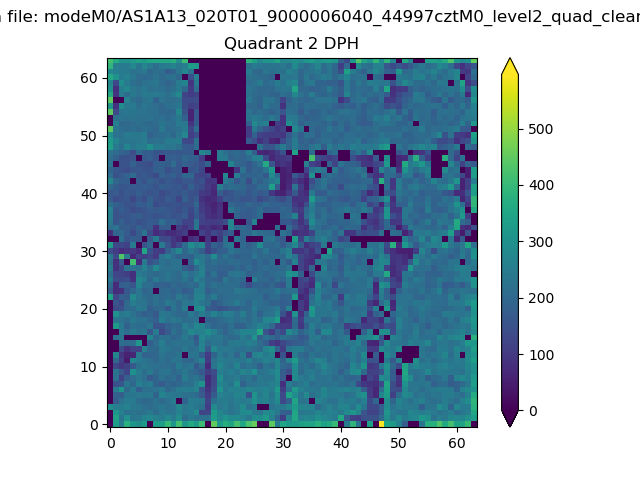 |
Quadrant C |
| Plot type | Count rate plots | Images |
|---|---|---|
| Comparison with Poisson distribution Blue bars denote a histogram of data divided into 1 sec bins. Red curve is a Poisson curve with rate = median count rate of data. |
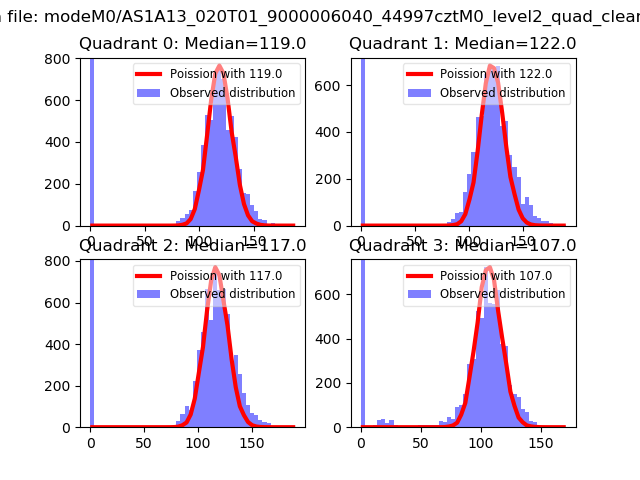 |
 |
| Quadrant-wise count rates Data is divided into 100 sec bins |
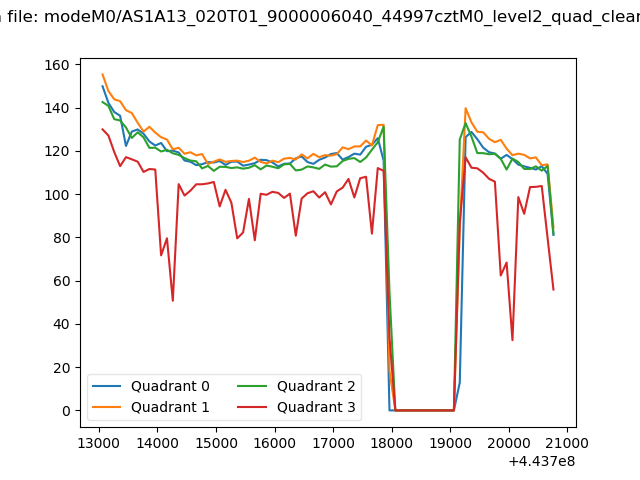 |
|
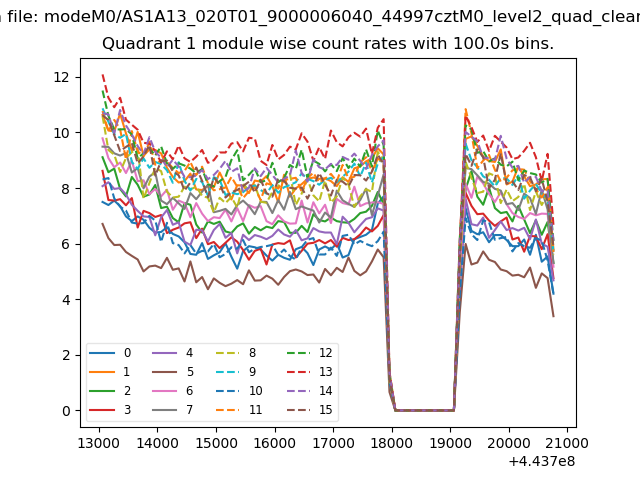
| Module-wise count rates for Quadrant A Data is divided into 100 sec bins |
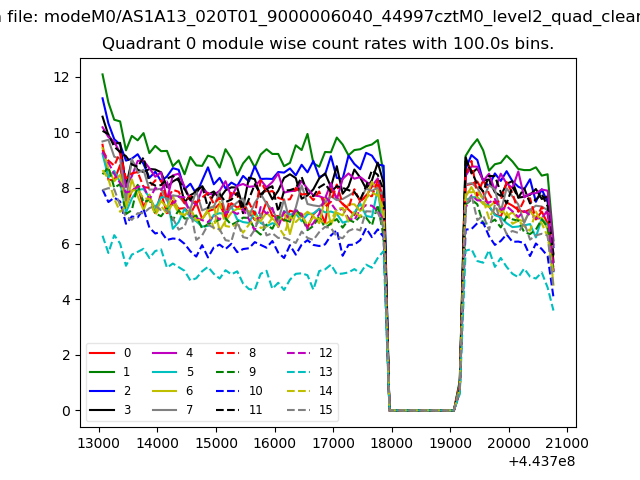 |
 |
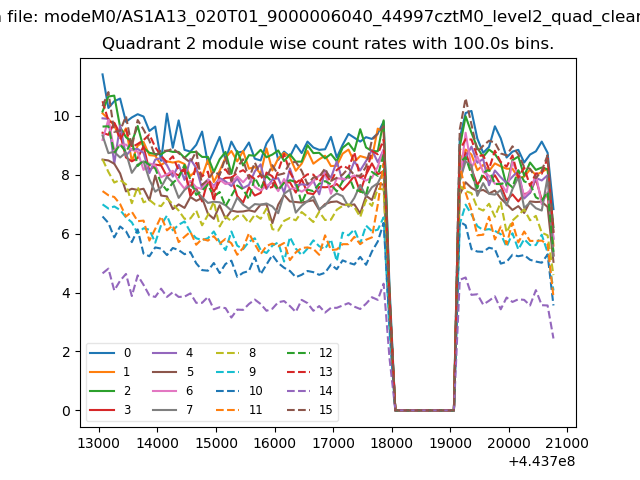
| Module-wise count rates for Quadrant B Data is divided into 100 sec bins |
 |
 |
| Module-wise count rates for Quadrant C Data is divided into 100 sec bins |
 |
 |
| Module-wise count rates for Quadrant D Data is divided into 100 sec bins |
 |
 |
| Parameter | Plot |
|---|---|
| CZT HV Monitor | 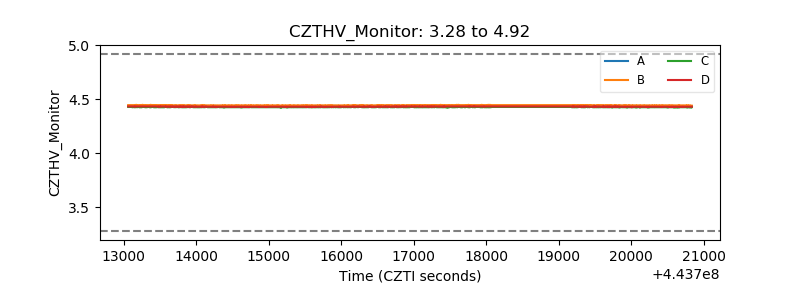 |
| D_VDD | 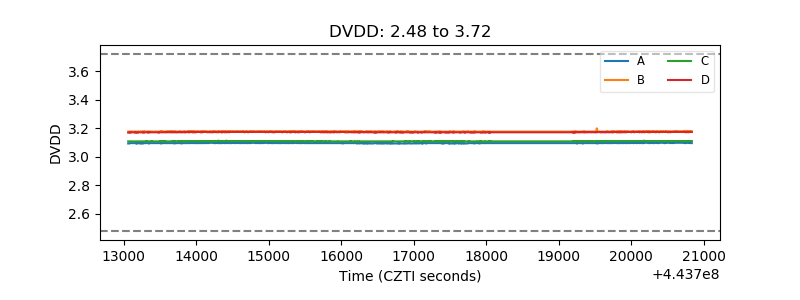 |
| Temperature 1 | 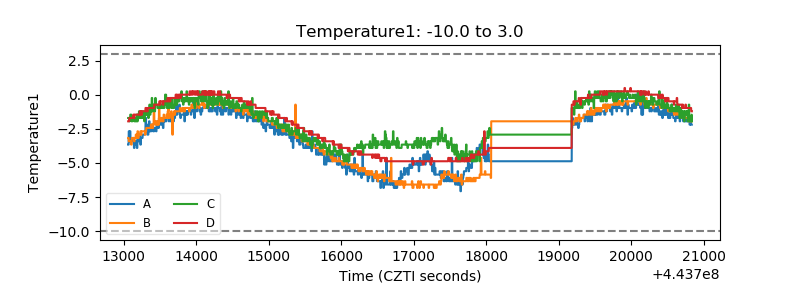 |
| Veto HV Monitor | 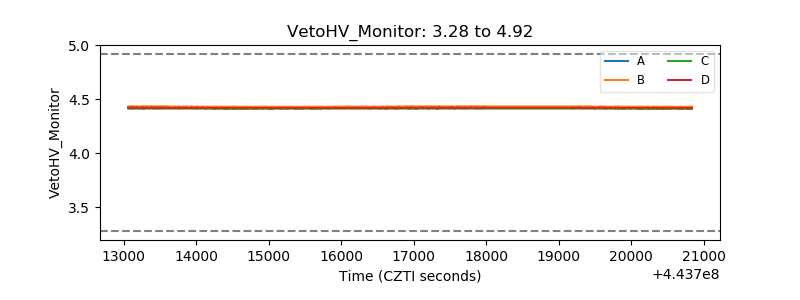 |
| Veto LLD | 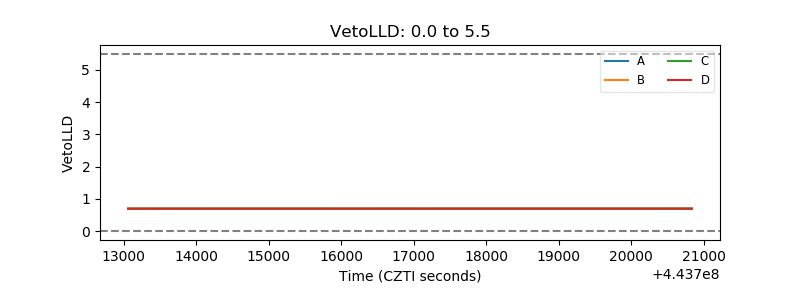 |
| Alpha Counter | 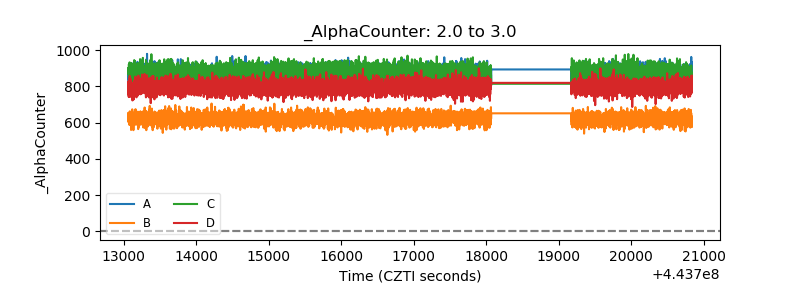 |
| _CPM_Rate | 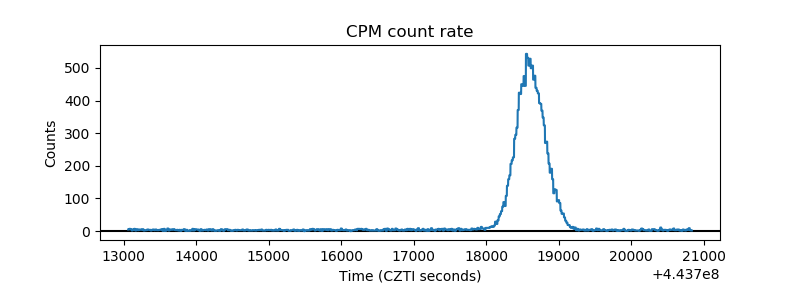 |
| CZT Counter | 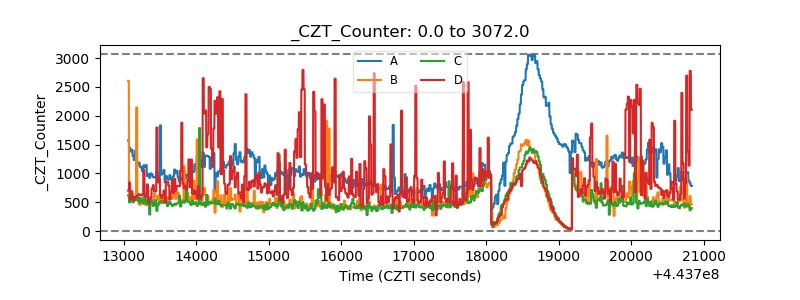 |
| +2.5 Volts monitor | 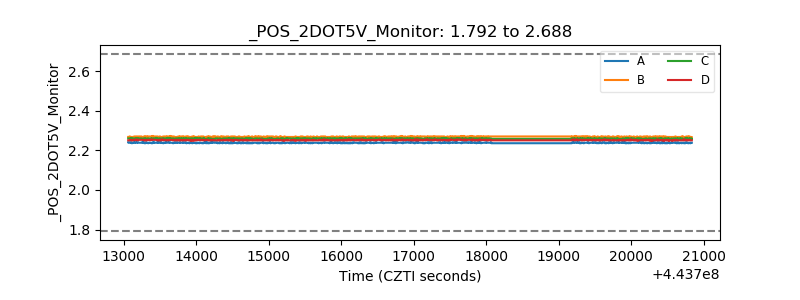 |
| +5 Volts monitor | 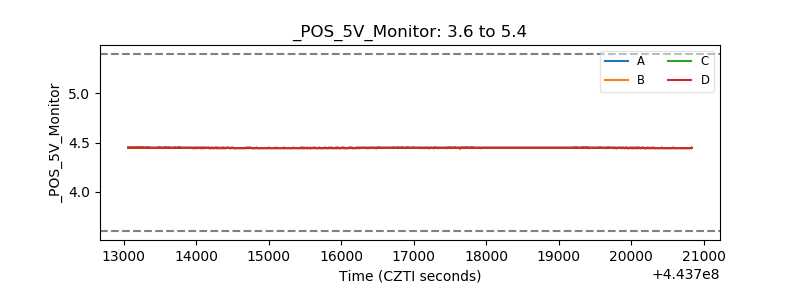 |
| _ROLL_ROT |  |
| _Roll_DEC | 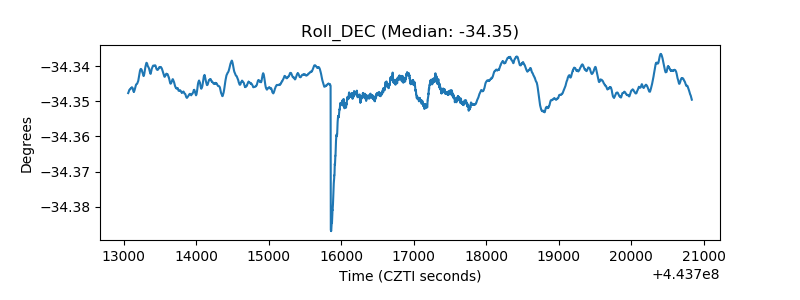 |
| _Roll_RA | 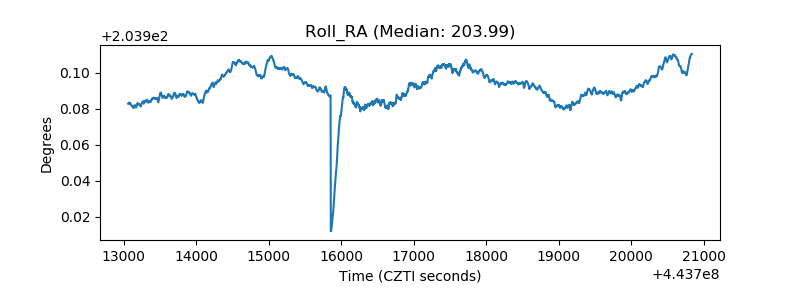 |
| Veto Counter | 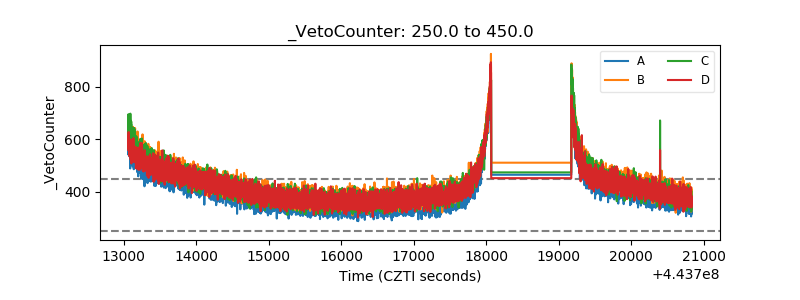 |