| Param | Original file | Final file |
|---|---|---|
| Filename | modeM0/AS1A13_020T01_9000006040_44998cztM0_level2.fits | modeM0/AS1A13_020T01_9000006040_44998cztM0_level2_quad_clean.evt |
| Size (bytes) | 501,894,720 | 103,968,000 |
| Size | 478.6 MB | 99.2 MB |
| Events in quadrant A | 5,776,151 | 693,627 |
| Events in quadrant B | 3,651,204 | 713,484 |
| Events in quadrant C | 2,953,565 | 702,572 |
| Events in quadrant D | 5,707,571 | 597,435 |
| Mode SS | |||
|---|---|---|---|
| Quadrant | BADHDUFLAG | Total packets | Discarded packets |
| A | 0 | 128 | 0 |
| B | 0 | 128 | 0 |
| C | 0 | 128 | 0 |
| D | 0 | 128 | 0 |
| Mode M9 | |||
|---|---|---|---|
| Quadrant | BADHDUFLAG | Total packets | Discarded packets |
| A | 0 | 10 | 0 |
| B | 0 | 10 | 0 |
| C | 0 | 10 | 0 |
| D | 0 | 10 | 0 |
| Mode M0 | |||
|---|---|---|---|
| Quadrant | BADHDUFLAG | Total packets | Discarded packets |
| A | 0 | 21666 | 1 |
| B | 0 | 15152 | 1 |
| C | 0 | 13220 | 1 |
| D | 0 | 21267 | 1 |
| Quadrant | Total seconds | Saturated seconds | Saturation percentage |
|---|---|---|---|
| A | 6317 | 234 | 3.704290% |
| B | 6318 | 210 | 3.323837% |
| C | 6318 | 52 | 0.823045% |
| D | 6318 | 655 | 10.367205% |
Noise dominated data is calculated using 1-second bins in cleaned event files. If a bin has >2000 counts, and if more than 50% of those come from <1% of pixels, then it is considered to be noise-dominated and hence unusable.
| Quadrant | # 1 sec bins | Bins with >0 counts | Bins with >2000 counts | High rate bins dominated by noise | Noise dominated (total time) | Noise dominated (detector-on time) | Marked lightcurve |
|---|---|---|---|---|---|---|---|
| A | 7287 | 6318 | 13 | 13 | 0.18% | 0.21% | 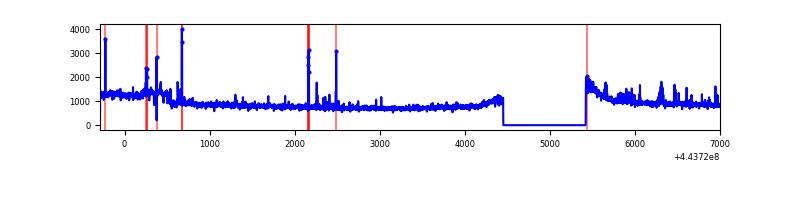 |
| B | 7288 | 6319 | 45 | 45 | 0.62% | 0.71% | 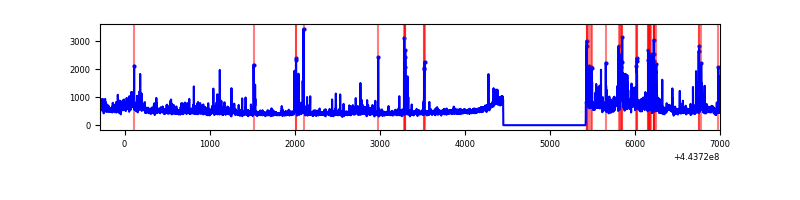 |
| C | 7288 | 6319 | 6 | 6 | 0.08% | 0.09% | 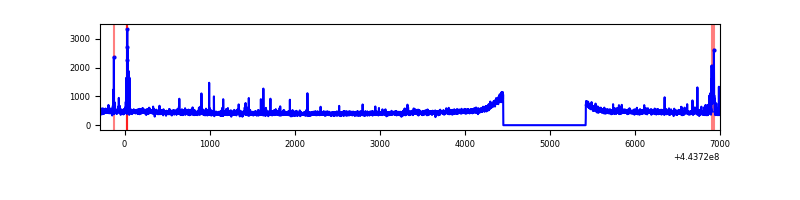 |
| D | 7288 | 6319 | 481 | 481 | 6.60% | 7.61% | 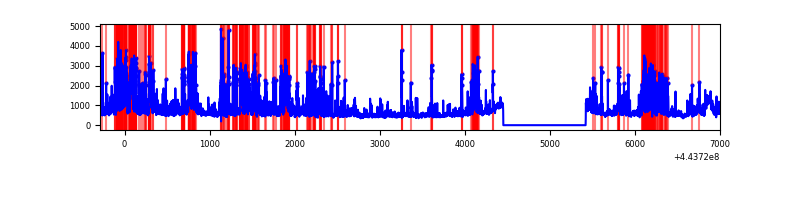 |
Top three noisy pixels from each quadrant. If the there are fewer than three noisy pixels in the level2.evt file, extra rows are filled as -1
| Pixel properties | Quadrant properties | ||||||
|---|---|---|---|---|---|---|---|
| Quadrant | DetID | PixID | Counts | Sigma | Mean | Median | Sigma |
| A | 10 | 83 | 2440345 | 16021.78 | 734 | 720 | 152.3 |
| A | 0 | 247 | 327099 | 2143.43 | 734 | 720 | 152.3 |
| A | 1 | 251 | 65250 | 423.79 | 734 | 720 | 152.3 |
| B | 5 | 255 | 184529 | 1278.89 | 732 | 711 | 143.7 |
| B | 0 | 155 | 92508 | 638.66 | 732 | 711 | 143.7 |
| B | 0 | 186 | 91055 | 628.56 | 732 | 711 | 143.7 |
| C | 12 | 2 | 44143 | 254.94 | 724 | 731 | 170.3 |
| C | 15 | 208 | 32058 | 183.97 | 724 | 731 | 170.3 |
| C | 3 | 233 | 22147 | 125.77 | 724 | 731 | 170.3 |
| D | 13 | 249 | 1039528 | 5905.63 | 698 | 676 | 175.9 |
| D | 1 | 52 | 667853 | 3792.74 | 698 | 676 | 175.9 |
| D | 5 | 222 | 404380 | 2294.96 | 698 | 676 | 175.9 |
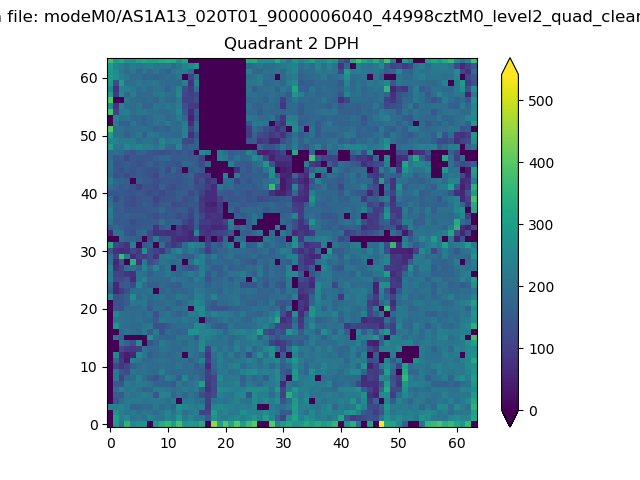
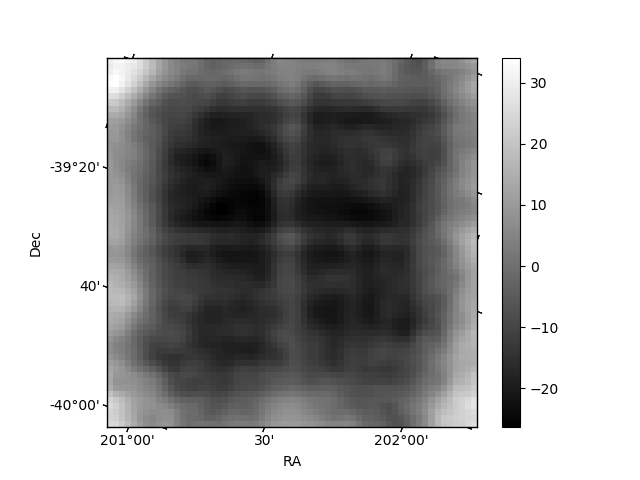
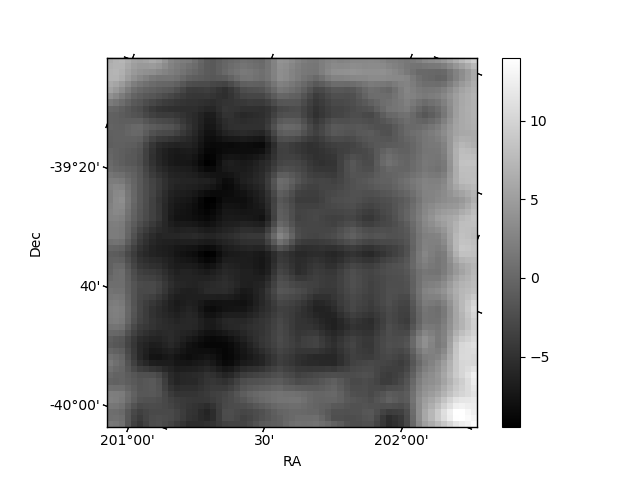
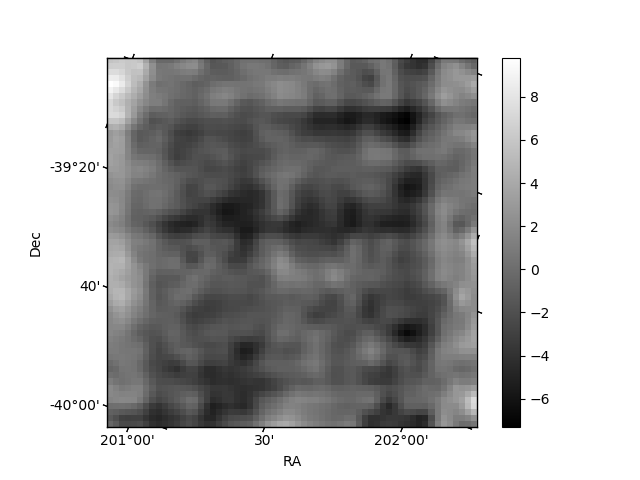
Histogram calculated using DETX and DETY for each event in the final _common_clean file
| Quadrant A | 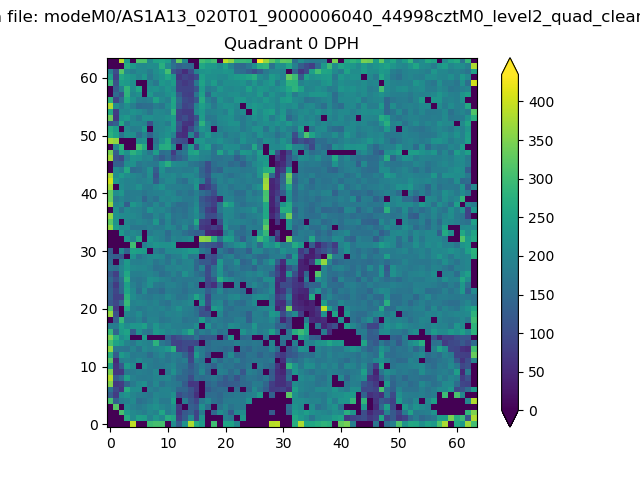 |
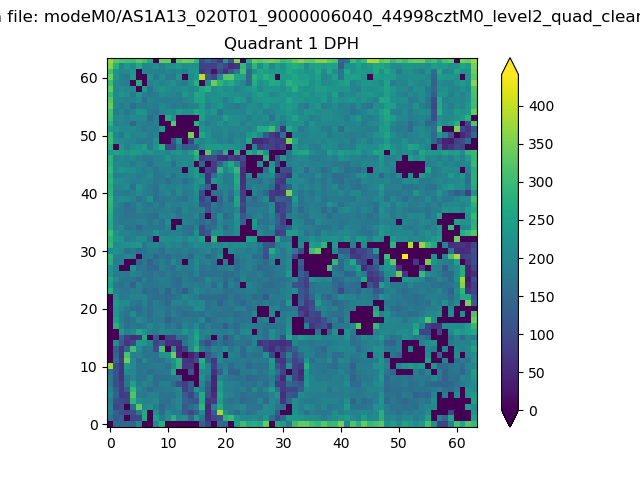 |
Quadrant B |
|---|---|---|---|
| Quadrant D | 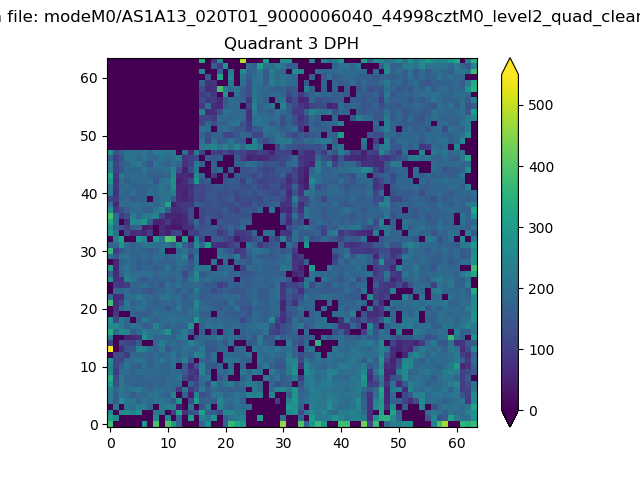 |
 |
Quadrant C |
| Plot type | Count rate plots | Images |
|---|---|---|
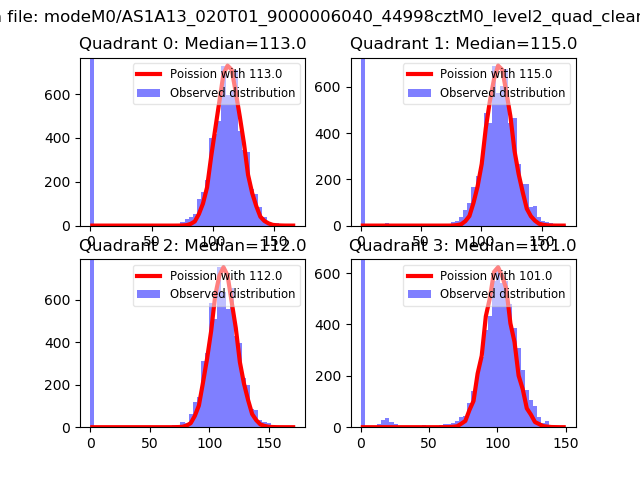
| Comparison with Poisson distribution Blue bars denote a histogram of data divided into 1 sec bins. Red curve is a Poisson curve with rate = median count rate of data. |
 |
 |
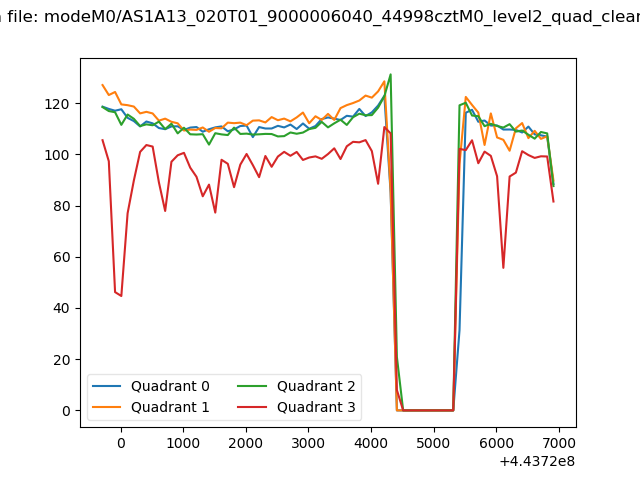
| Quadrant-wise count rates Data is divided into 100 sec bins |
 |
|
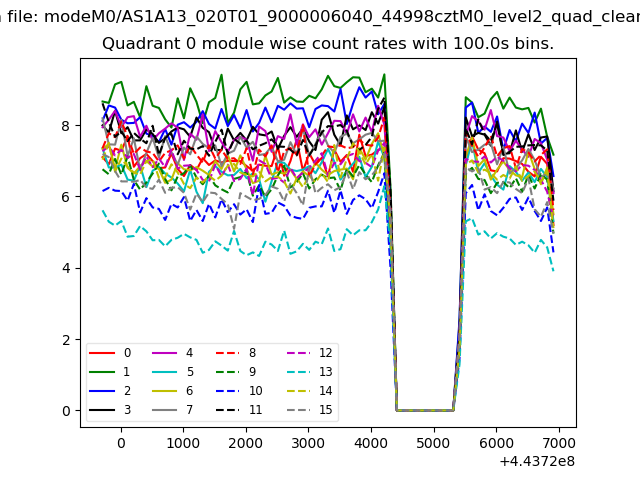
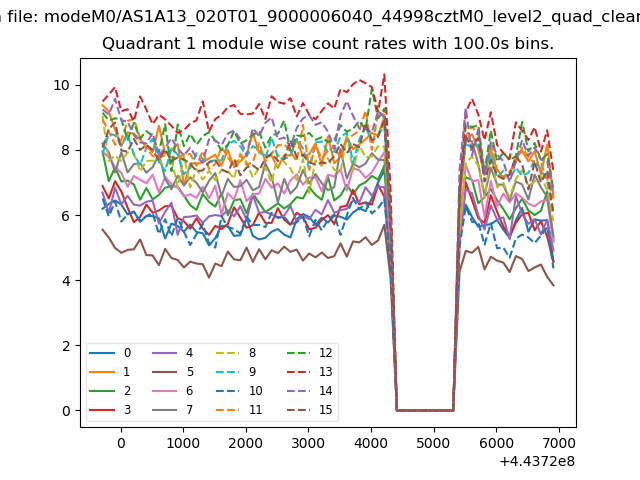
| Module-wise count rates for Quadrant A Data is divided into 100 sec bins |
 |
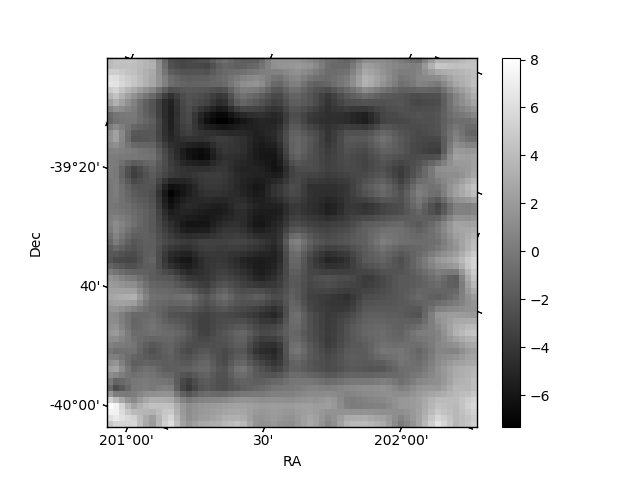 |
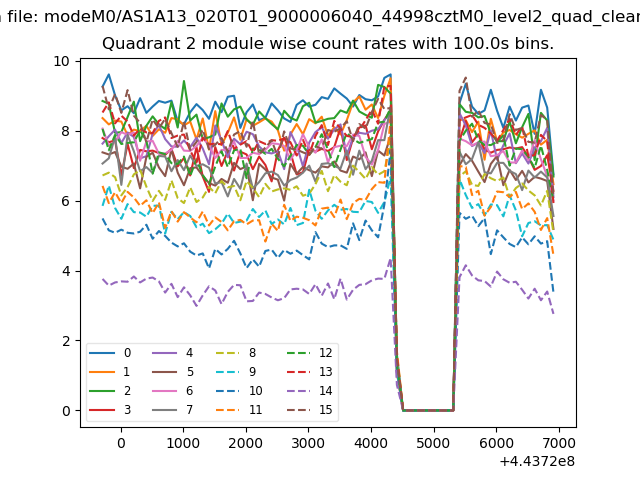
| Module-wise count rates for Quadrant B Data is divided into 100 sec bins |
 |
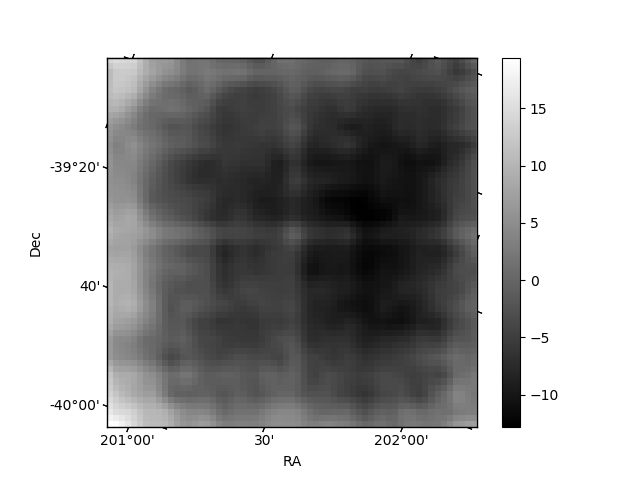 |
| Module-wise count rates for Quadrant C Data is divided into 100 sec bins |
 |
 |
| Module-wise count rates for Quadrant D Data is divided into 100 sec bins |
 |
 |
| Parameter | Plot |
|---|---|
| CZT HV Monitor | 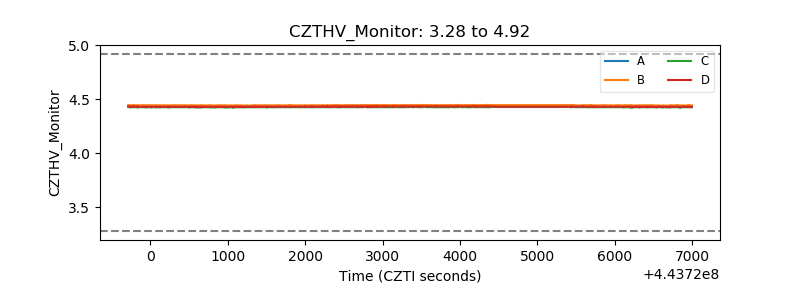 |
| D_VDD | 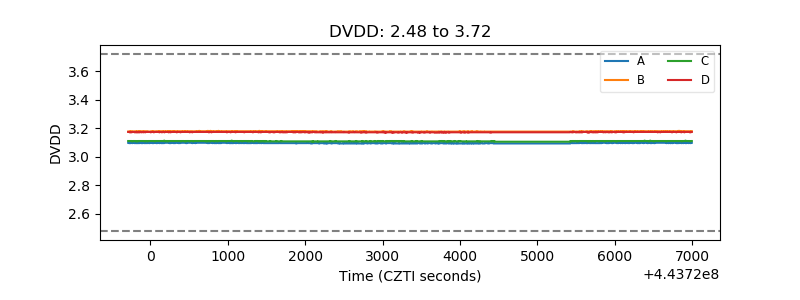 |
| Temperature 1 | 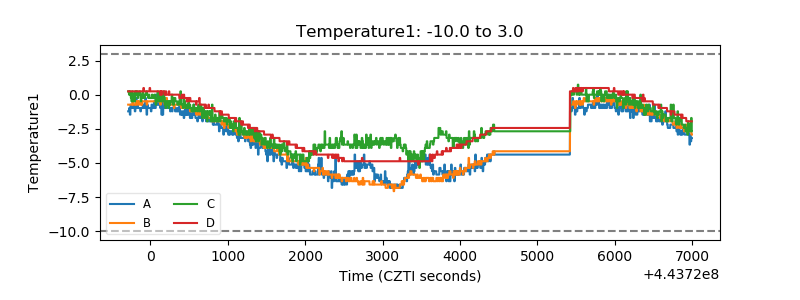 |
| Veto HV Monitor | 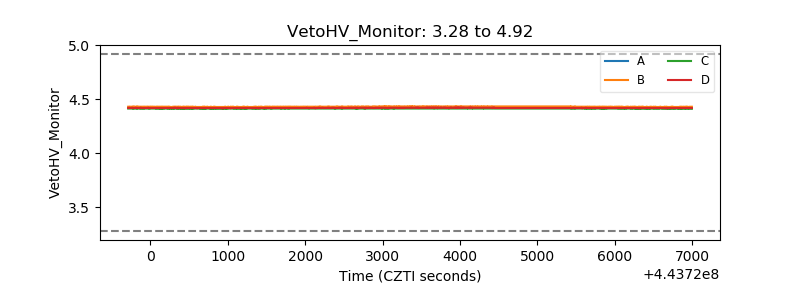 |
| Veto LLD |  |
| Alpha Counter | 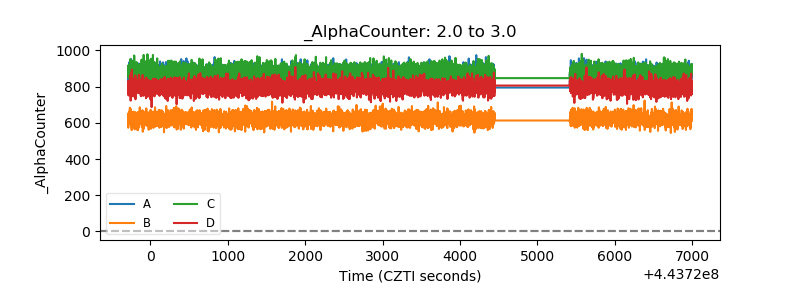 |
| _CPM_Rate | 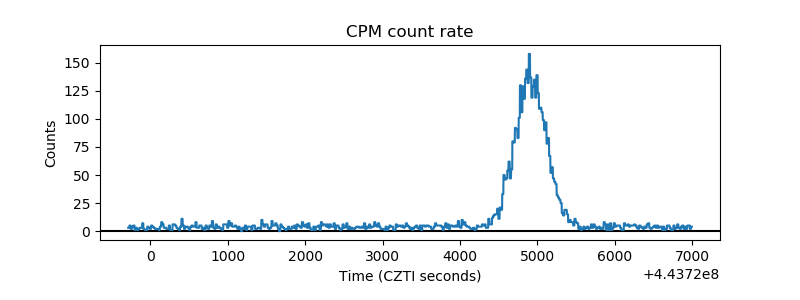 |
| CZT Counter | 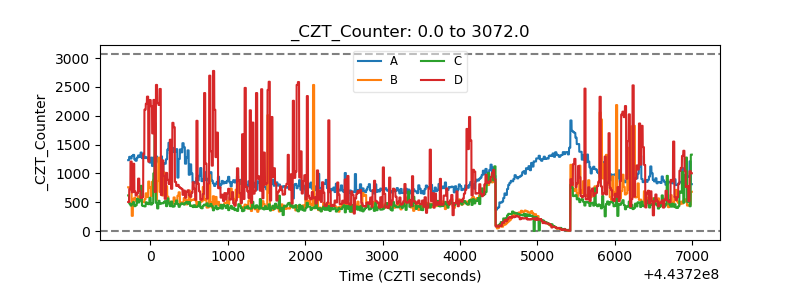 |
| +2.5 Volts monitor | 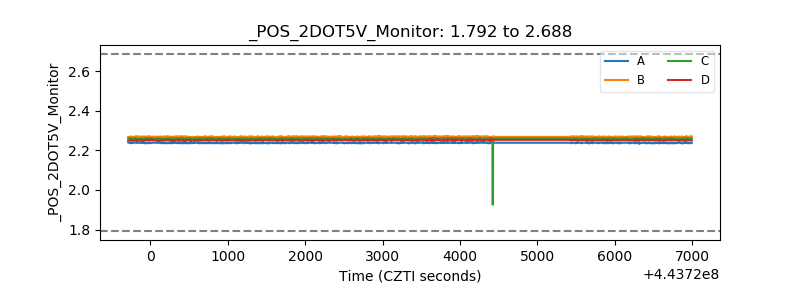 |
| +5 Volts monitor | 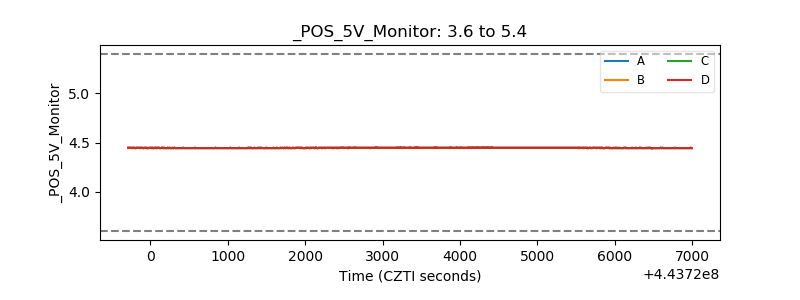 |
| _ROLL_ROT | 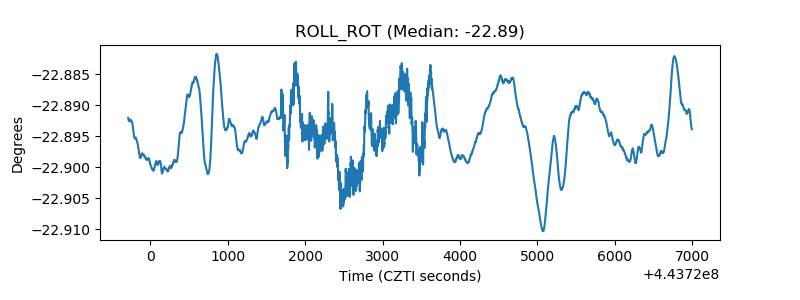 |
| _Roll_DEC | 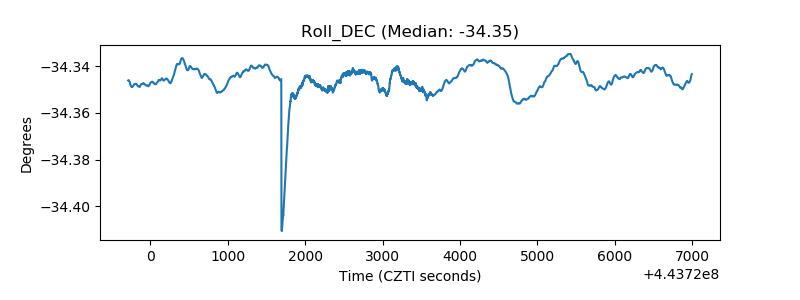 |
| _Roll_RA | 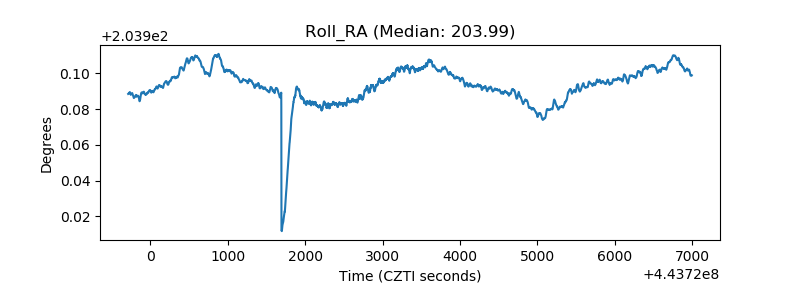 |
| Veto Counter | 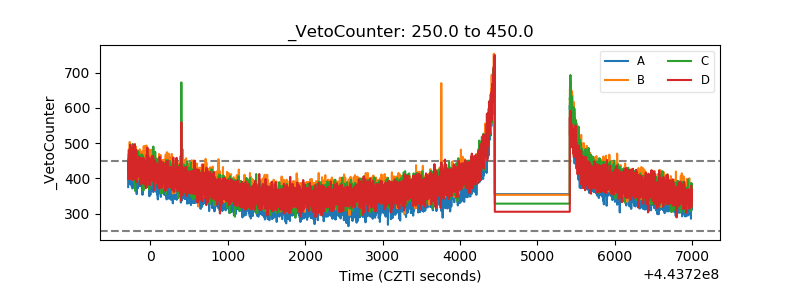 |