| Param | Original file | Final file |
|---|---|---|
| Filename | modeM0/AS1A13_020T01_9000006040_44999cztM0_level2.fits | modeM0/AS1A13_020T01_9000006040_44999cztM0_level2_quad_clean.evt |
| Size (bytes) | 588,948,480 | 113,667,840 |
| Size | 561.7 MB | 108.4 MB |
| Events in quadrant A | 6,386,126 | 754,096 |
| Events in quadrant B | 4,220,079 | 783,450 |
| Events in quadrant C | 3,380,946 | 777,779 |
| Events in quadrant D | 7,258,767 | 627,259 |
| Mode SS | |||
|---|---|---|---|
| Quadrant | BADHDUFLAG | Total packets | Discarded packets |
| A | 0 | 146 | 0 |
| B | 0 | 146 | 0 |
| C | 0 | 146 | 0 |
| D | 0 | 146 | 0 |
| Mode M9 | |||
|---|---|---|---|
| Quadrant | BADHDUFLAG | Total packets | Discarded packets |
| A | 0 | 6 | 0 |
| B | 0 | 7 | 0 |
| C | 0 | 7 | 0 |
| D | 0 | 7 | 0 |
| Mode M0 | |||
|---|---|---|---|
| Quadrant | BADHDUFLAG | Total packets | Discarded packets |
| A | 0 | 24233 | 3 |
| B | 0 | 17393 | 6 |
| C | 0 | 15159 | 4 |
| D | 0 | 26507 | 3 |
| Quadrant | Total seconds | Saturated seconds | Saturation percentage |
|---|---|---|---|
| A | 7163 | 420 | 5.863465% |
| B | 7162 | 297 | 4.146886% |
| C | 7162 | 81 | 1.130969% |
| D | 7162 | 998 | 13.934655% |
Noise dominated data is calculated using 1-second bins in cleaned event files. If a bin has >2000 counts, and if more than 50% of those come from <1% of pixels, then it is considered to be noise-dominated and hence unusable.
| Quadrant | # 1 sec bins | Bins with >0 counts | Bins with >2000 counts | High rate bins dominated by noise | Noise dominated (total time) | Noise dominated (detector-on time) | Marked lightcurve |
|---|---|---|---|---|---|---|---|
| A | 7673 | 7165 | 41 | 41 | 0.53% | 0.57% | 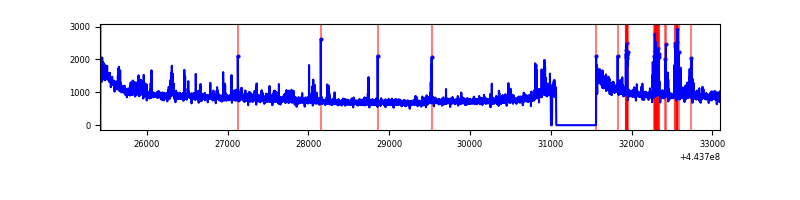 |
| B | 7673 | 7165 | 52 | 52 | 0.68% | 0.73% |  |
| C | 7672 | 7164 | 10 | 10 | 0.13% | 0.14% | 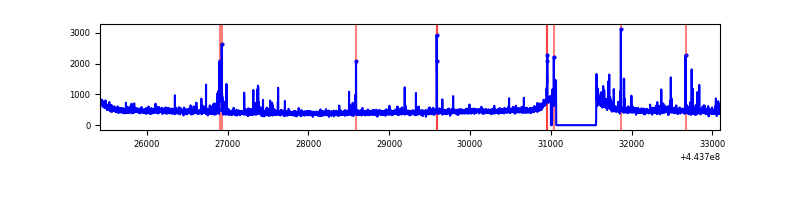 |
| D | 7672 | 7164 | 672 | 672 | 8.76% | 9.38% | 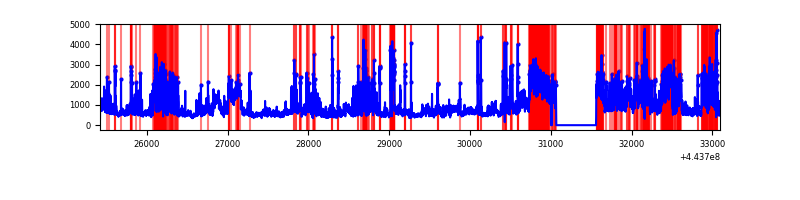 |
Top three noisy pixels from each quadrant. If the there are fewer than three noisy pixels in the level2.evt file, extra rows are filled as -1
| Pixel properties | Quadrant properties | ||||||
|---|---|---|---|---|---|---|---|
| Quadrant | DetID | PixID | Counts | Sigma | Mean | Median | Sigma |
| A | 10 | 83 | 2810543 | 16351.86 | 824 | 807 | 171.8 |
| A | 2 | 79 | 132977 | 769.19 | 824 | 807 | 171.8 |
| A | 1 | 251 | 114448 | 661.36 | 824 | 807 | 171.8 |
| B | 5 | 255 | 217652 | 1331.82 | 825 | 800 | 162.8 |
| B | 15 | 36 | 118706 | 724.13 | 825 | 800 | 162.8 |
| B | 0 | 155 | 111684 | 681.01 | 825 | 800 | 162.8 |
| C | 14 | 254 | 52468 | 268.68 | 816 | 821 | 192.2 |
| C | 15 | 208 | 40673 | 207.32 | 816 | 821 | 192.2 |
| C | 3 | 233 | 39196 | 199.63 | 816 | 821 | 192.2 |
| D | 11 | 241 | 1239043 | 6380.99 | 769 | 746 | 194.1 |
| D | 1 | 52 | 1131179 | 5825.16 | 769 | 746 | 194.1 |
| D | 13 | 249 | 491195 | 2527.3 | 769 | 746 | 194.1 |
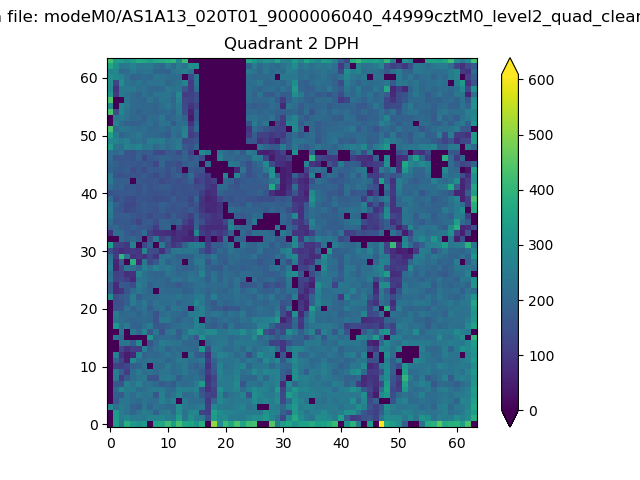
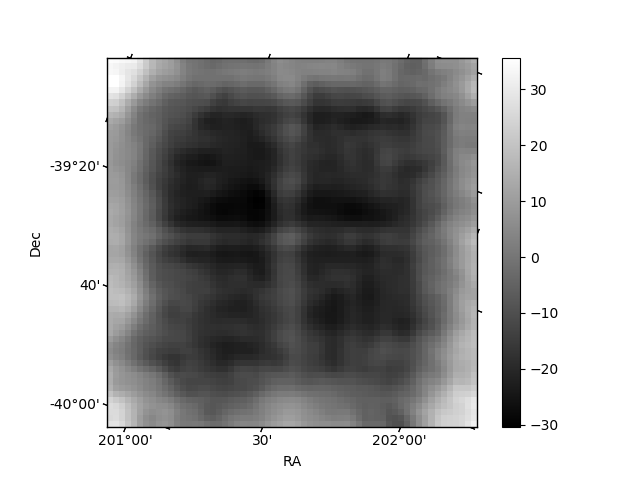
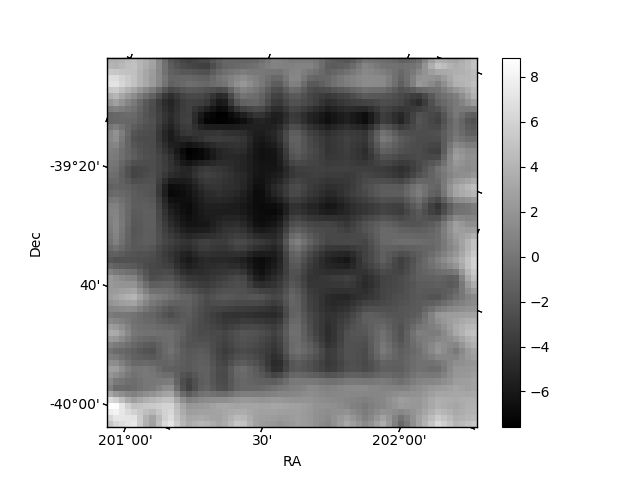
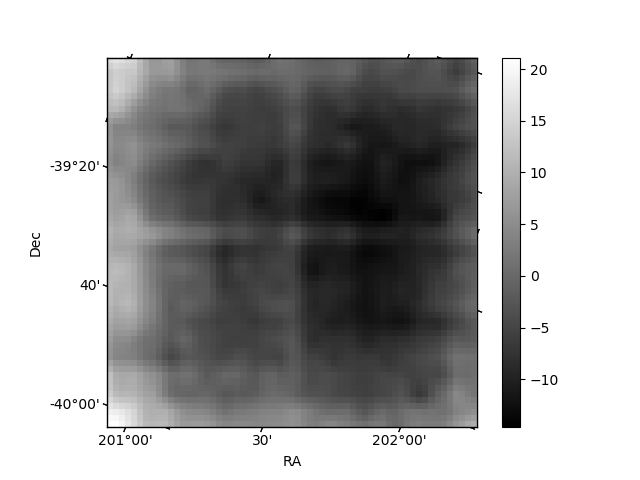
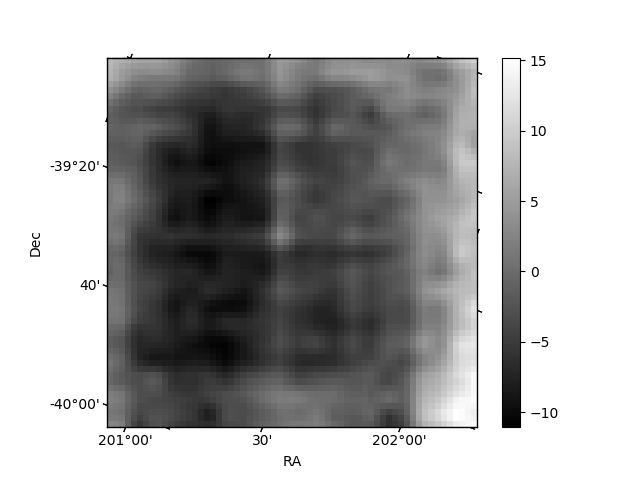
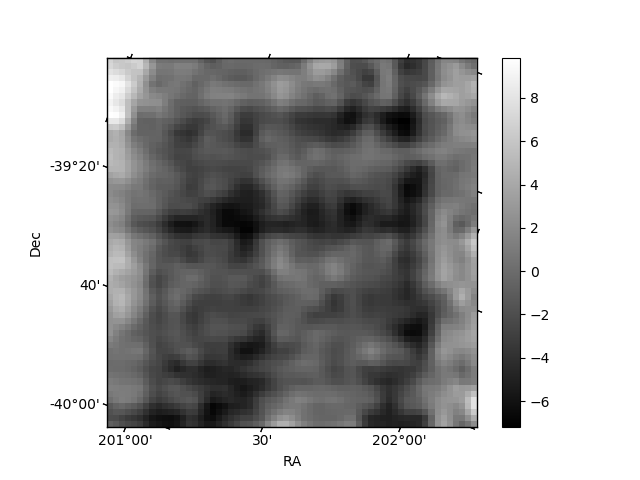
Histogram calculated using DETX and DETY for each event in the final _common_clean file
| Quadrant A | 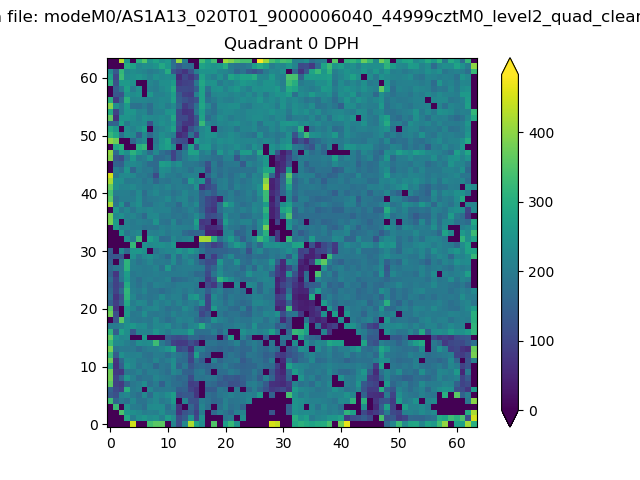 |
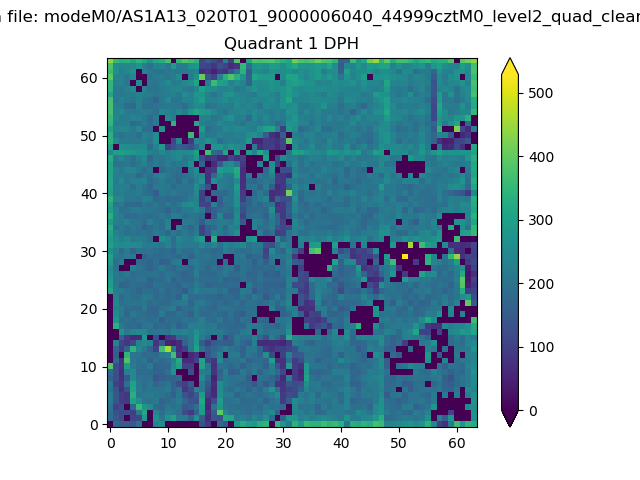 |
Quadrant B |
|---|---|---|---|
| Quadrant D | 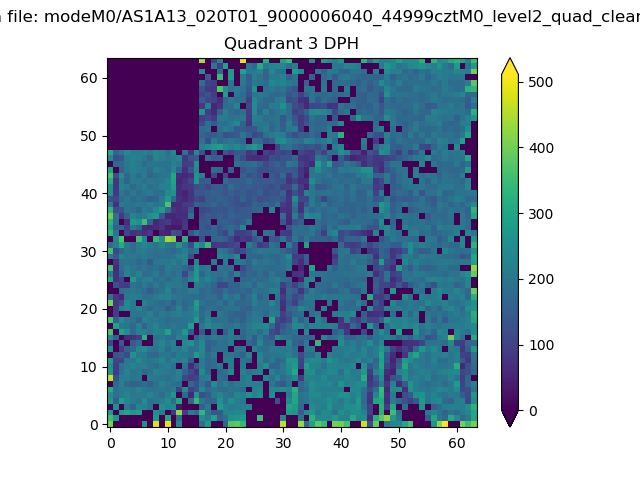 |
 |
Quadrant C |
| Plot type | Count rate plots | Images |
|---|---|---|
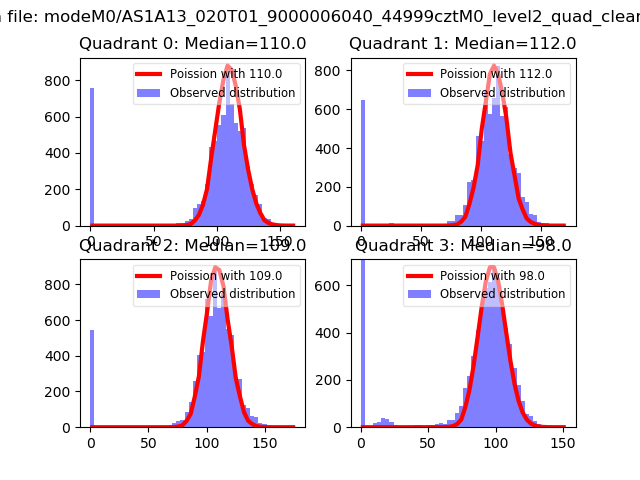
| Comparison with Poisson distribution Blue bars denote a histogram of data divided into 1 sec bins. Red curve is a Poisson curve with rate = median count rate of data. |
 |
 |
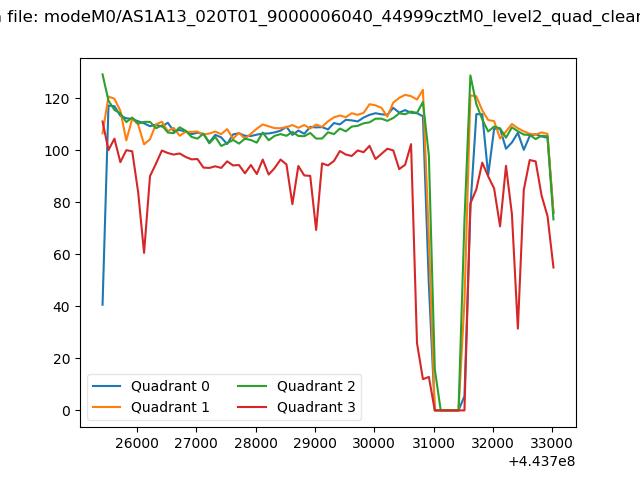
| Quadrant-wise count rates Data is divided into 100 sec bins |
 |
|
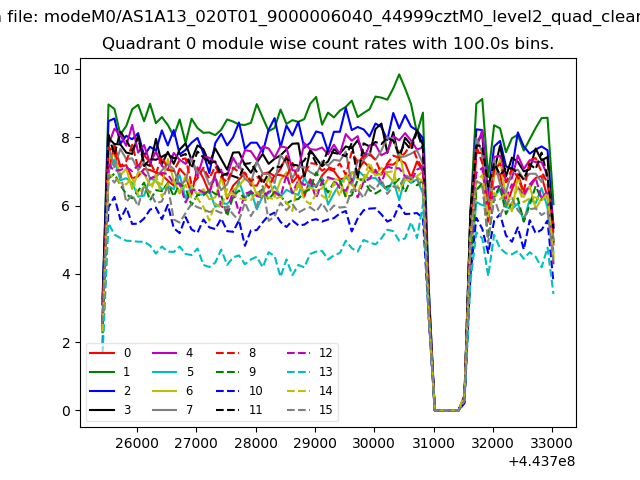
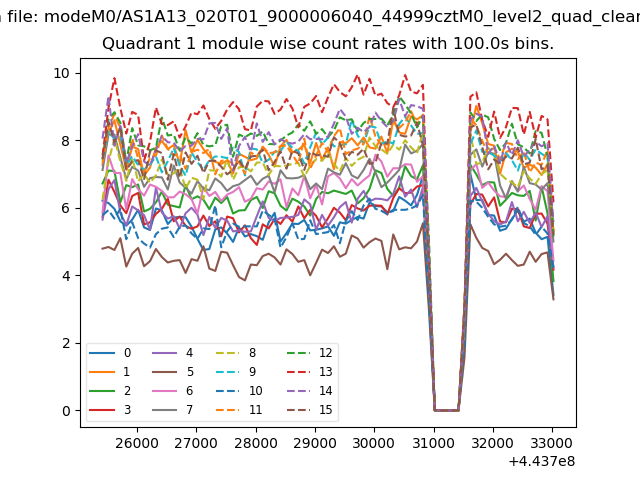
| Module-wise count rates for Quadrant A Data is divided into 100 sec bins |
 |
 |
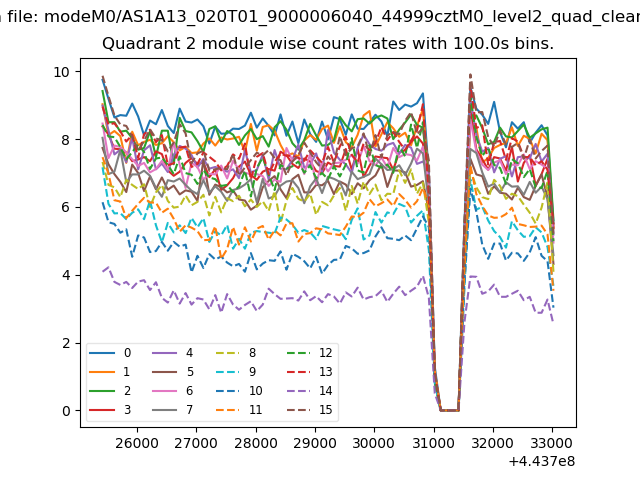
| Module-wise count rates for Quadrant B Data is divided into 100 sec bins |
 |
 |
| Module-wise count rates for Quadrant C Data is divided into 100 sec bins |
 |
 |
| Module-wise count rates for Quadrant D Data is divided into 100 sec bins |
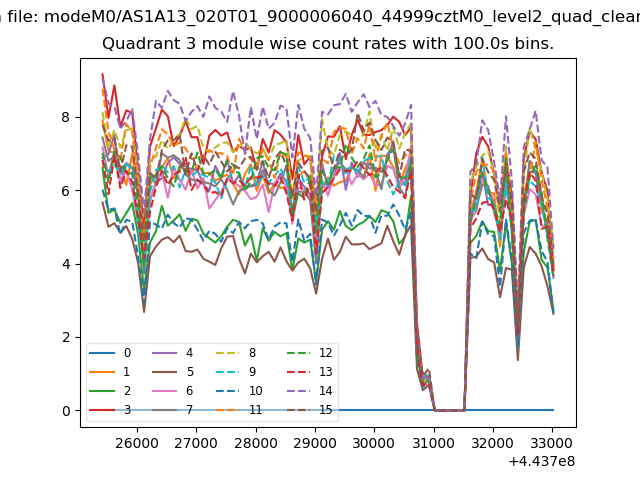 |
 |
| Parameter | Plot |
|---|---|
| CZT HV Monitor | 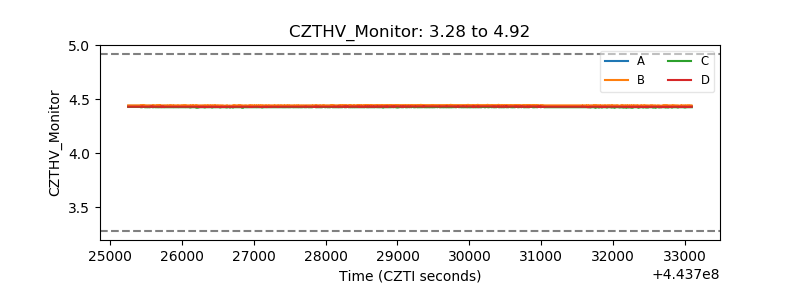 |
| D_VDD | 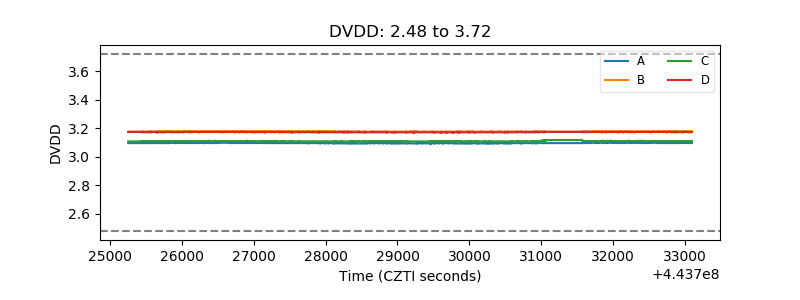 |
| Temperature 1 | 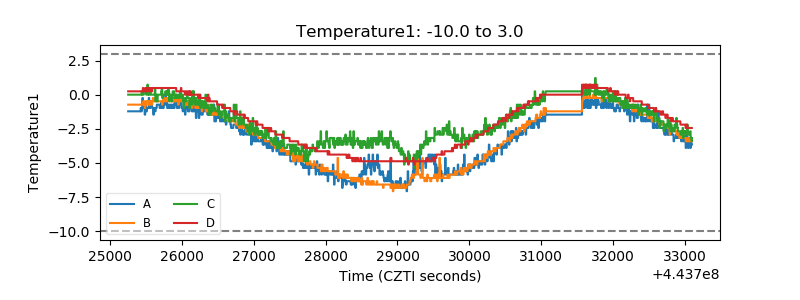 |
| Veto HV Monitor | 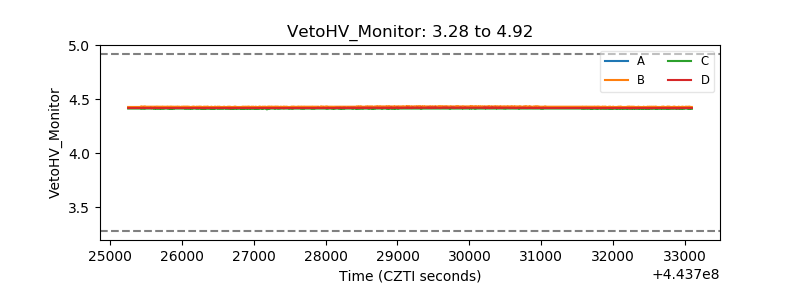 |
| Veto LLD | 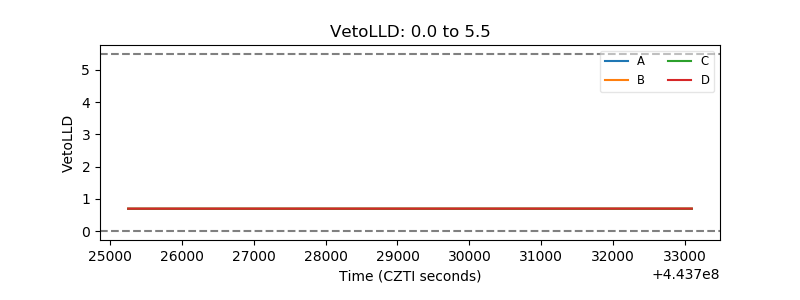 |
| Alpha Counter | 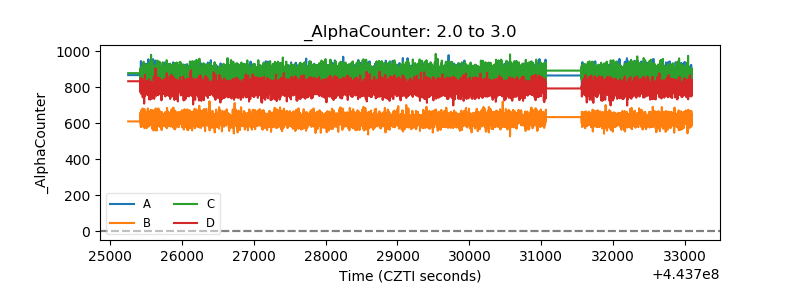 |
| _CPM_Rate | 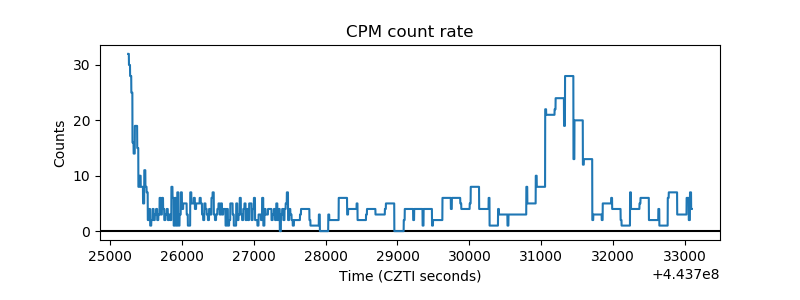 |
| CZT Counter | 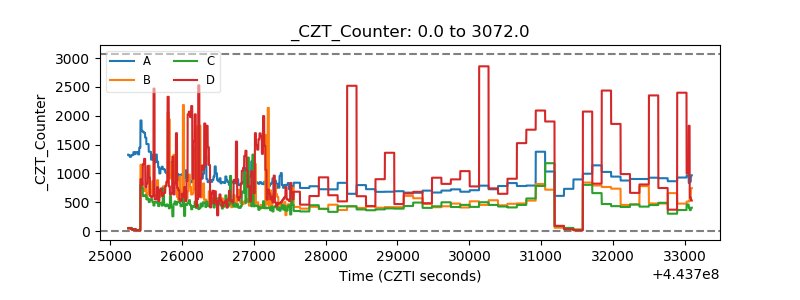 |
| +2.5 Volts monitor | 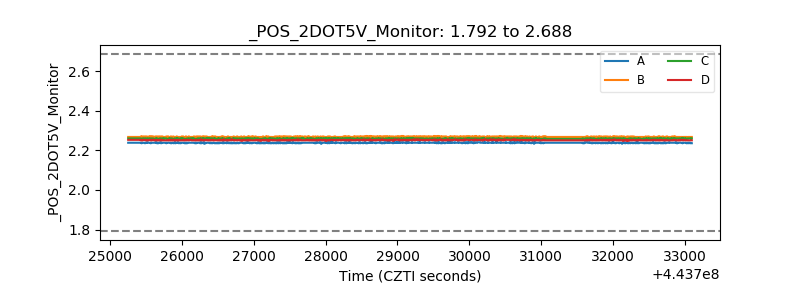 |
| +5 Volts monitor | 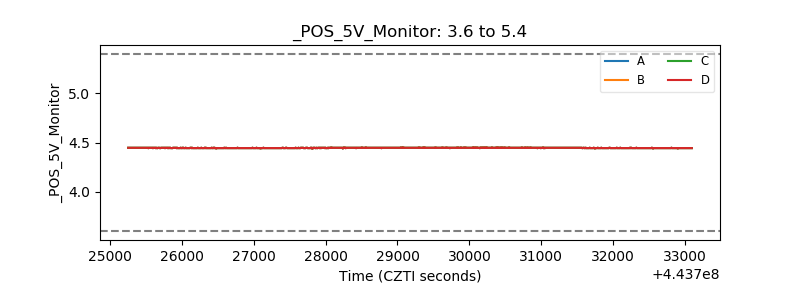 |
| _ROLL_ROT | 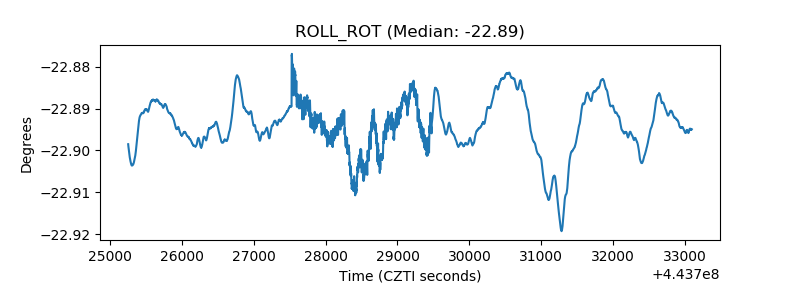 |
| _Roll_DEC | 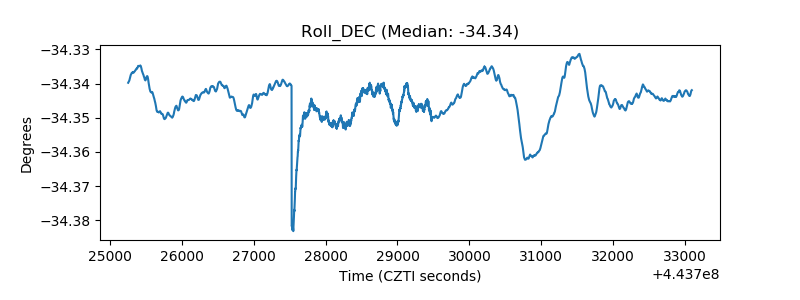 |
| _Roll_RA | 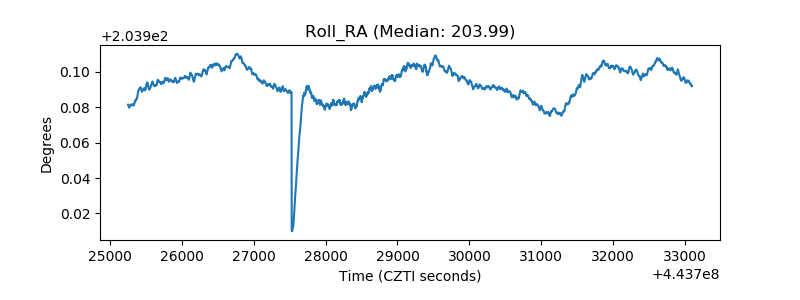 |
| Veto Counter | 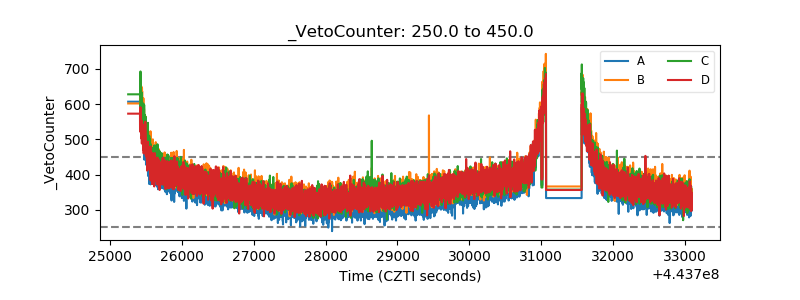 |