| Param | Original file | Final file |
|---|---|---|
| Filename | modeM0/AS1A13_020T01_9000006040_45001cztM0_level2.fits | modeM0/AS1A13_020T01_9000006040_45001cztM0_level2_quad_clean.evt |
| Size (bytes) | 586,900,800 | 122,690,880 |
| Size | 559.7 MB | 117.0 MB |
| Events in quadrant A | 6,662,612 | 817,664 |
| Events in quadrant B | 4,564,067 | 832,651 |
| Events in quadrant C | 3,464,146 | 821,057 |
| Events in quadrant D | 6,435,988 | 706,374 |
| Mode SS | |||
|---|---|---|---|
| Quadrant | BADHDUFLAG | Total packets | Discarded packets |
| A | 0 | 154 | 0 |
| B | 0 | 154 | 0 |
| C | 0 | 154 | 0 |
| D | 0 | 154 | 0 |
| Mode M0 | |||
|---|---|---|---|
| Quadrant | BADHDUFLAG | Total packets | Discarded packets |
| A | 0 | 25418 | 0 |
| B | 0 | 18846 | 0 |
| C | 0 | 15947 | 0 |
| D | 0 | 24457 | 0 |
| Quadrant | Total seconds | Saturated seconds | Saturation percentage |
|---|---|---|---|
| A | 7721 | 224 | 2.901179% |
| B | 7722 | 239 | 3.095053% |
| C | 7722 | 14 | 0.181300% |
| D | 7722 | 602 | 7.795908% |
Noise dominated data is calculated using 1-second bins in cleaned event files. If a bin has >2000 counts, and if more than 50% of those come from <1% of pixels, then it is considered to be noise-dominated and hence unusable.
| Quadrant | # 1 sec bins | Bins with >0 counts | Bins with >2000 counts | High rate bins dominated by noise | Noise dominated (total time) | Noise dominated (detector-on time) | Marked lightcurve |
|---|---|---|---|---|---|---|---|
| A | 7721 | 7721 | 86 | 86 | 1.11% | 1.11% | 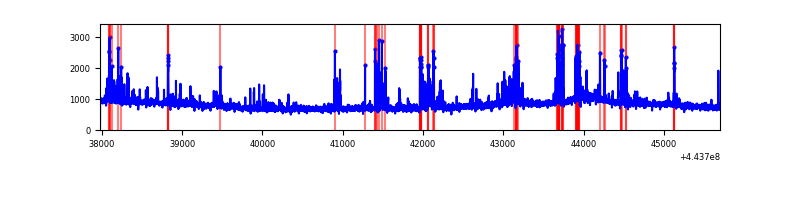 |
| B | 7722 | 7722 | 116 | 116 | 1.50% | 1.50% | 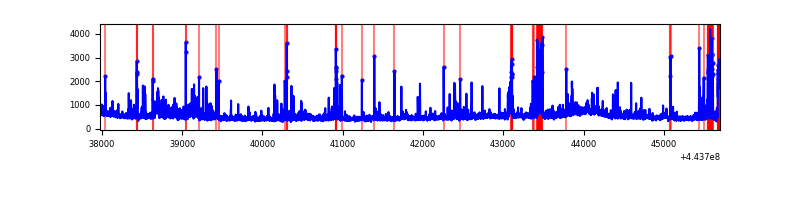 |
| C | 7722 | 7722 | 7 | 7 | 0.09% | 0.09% | 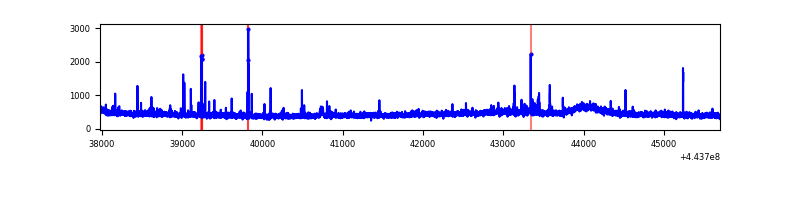 |
| D | 7722 | 7722 | 501 | 501 | 6.49% | 6.49% | 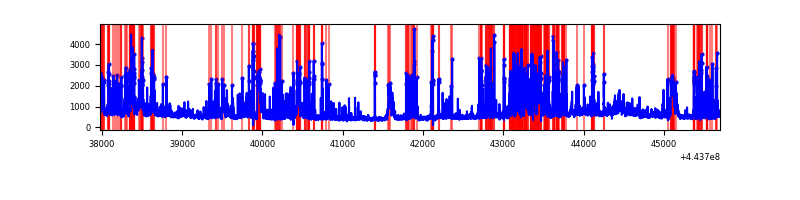 |
Top three noisy pixels from each quadrant. If the there are fewer than three noisy pixels in the level2.evt file, extra rows are filled as -1
| Pixel properties | Quadrant properties | ||||||
|---|---|---|---|---|---|---|---|
| Quadrant | DetID | PixID | Counts | Sigma | Mean | Median | Sigma |
| A | 10 | 83 | 2704110 | 14840.4 | 862 | 842 | 182.2 |
| A | 2 | 79 | 418935 | 2295.25 | 862 | 842 | 182.2 |
| A | 13 | 248 | 95819 | 521.4 | 862 | 842 | 182.2 |
| B | 4 | 171 | 232409 | 1370.48 | 862 | 837 | 169.0 |
| B | 0 | 189 | 230181 | 1357.29 | 862 | 837 | 169.0 |
| B | 5 | 172 | 188548 | 1110.9 | 862 | 837 | 169.0 |
| C | 14 | 254 | 39410 | 191.82 | 852 | 858 | 201.0 |
| C | 3 | 233 | 29465 | 142.34 | 852 | 858 | 201.0 |
| C | 15 | 208 | 22738 | 108.87 | 852 | 858 | 201.0 |
| D | 13 | 249 | 982661 | 4749.73 | 823 | 795 | 206.7 |
| D | 4 | 232 | 432850 | 2090.05 | 823 | 795 | 206.7 |
| D | 11 | 241 | 374865 | 1809.55 | 823 | 795 | 206.7 |
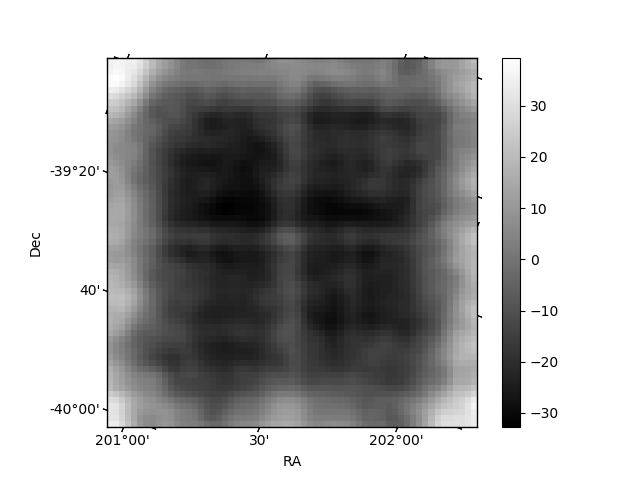
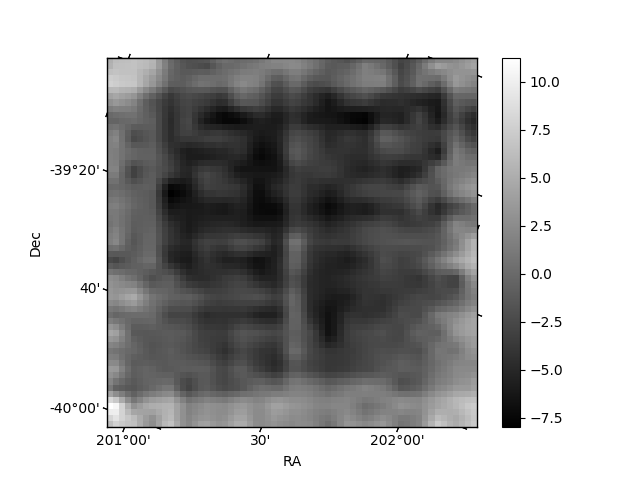
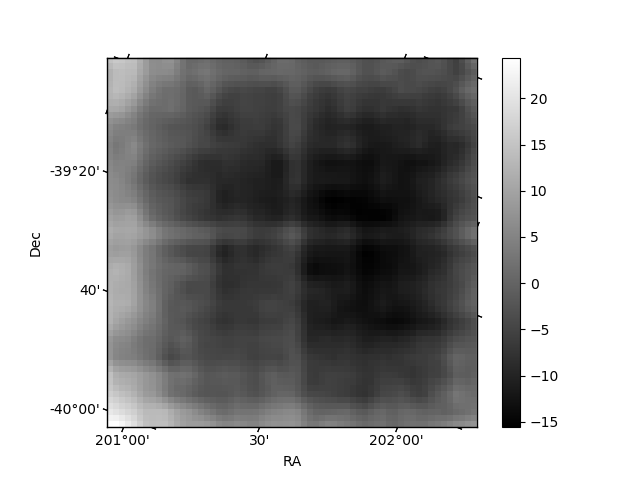
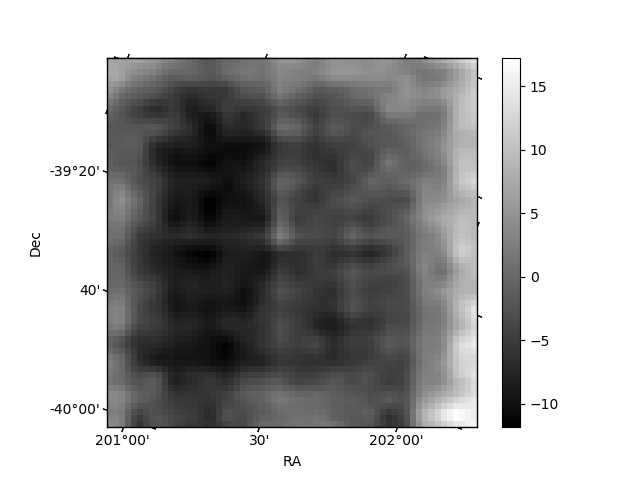
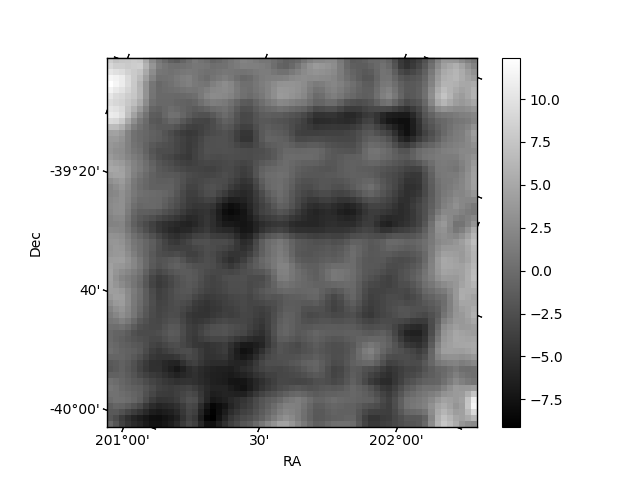
Histogram calculated using DETX and DETY for each event in the final _common_clean file
| Quadrant A | 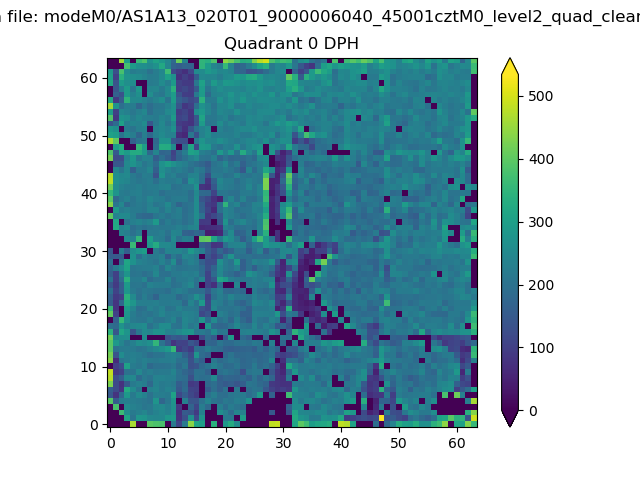 |
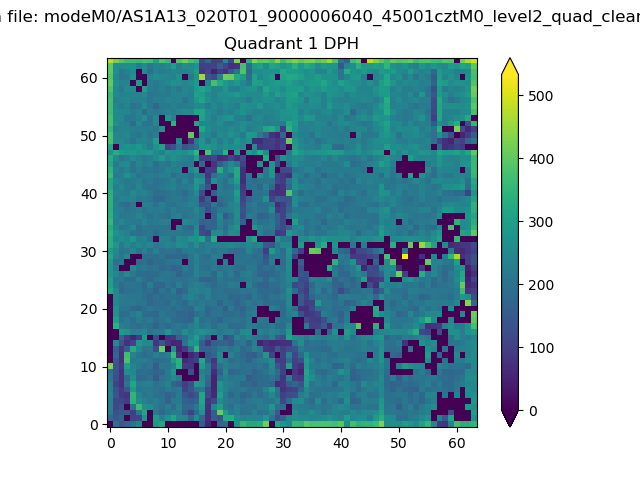 |
Quadrant B |
|---|---|---|---|
| Quadrant D | 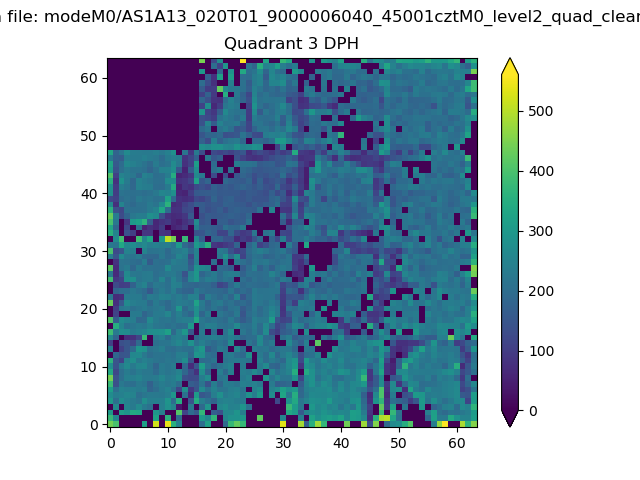 |
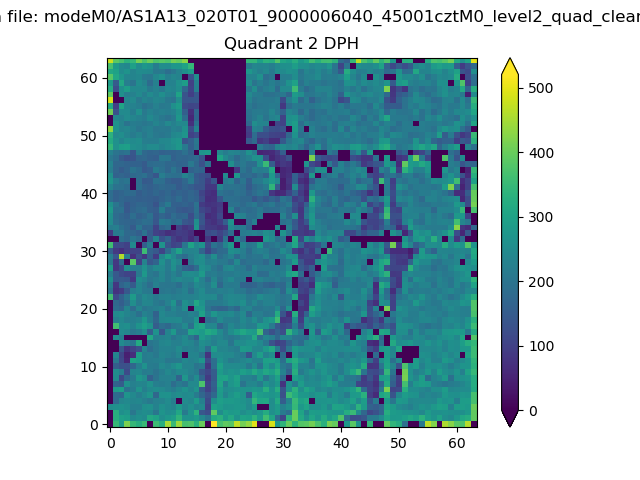 |
Quadrant C |
| Plot type | Count rate plots | Images |
|---|---|---|
| Comparison with Poisson distribution Blue bars denote a histogram of data divided into 1 sec bins. Red curve is a Poisson curve with rate = median count rate of data. |
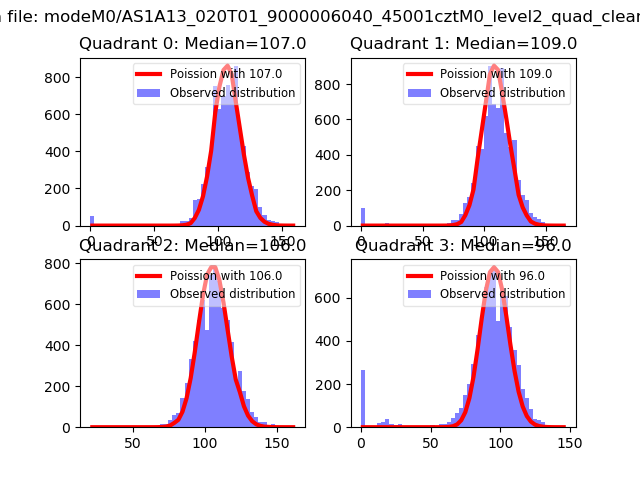 |
 |
| Quadrant-wise count rates Data is divided into 100 sec bins |
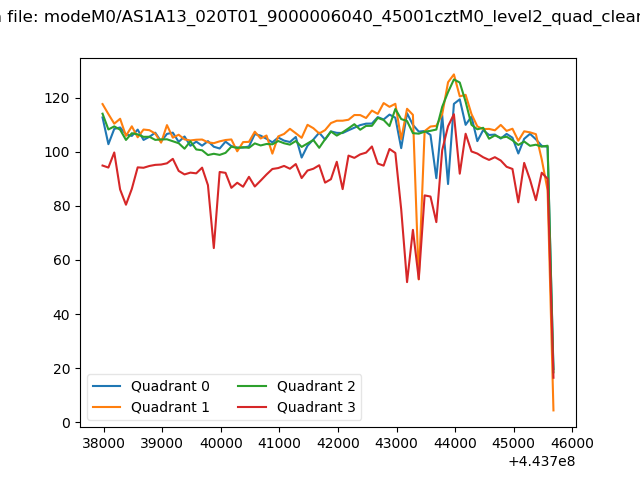 |
|
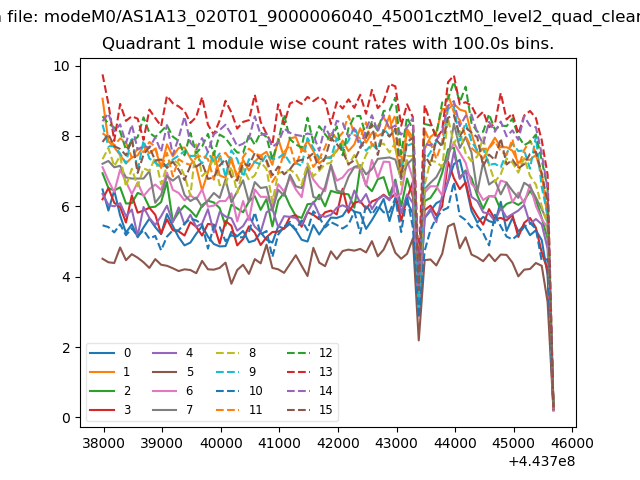
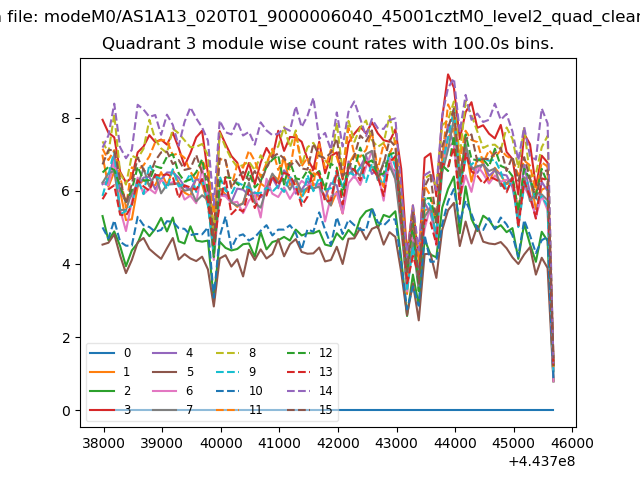
| Module-wise count rates for Quadrant A Data is divided into 100 sec bins |
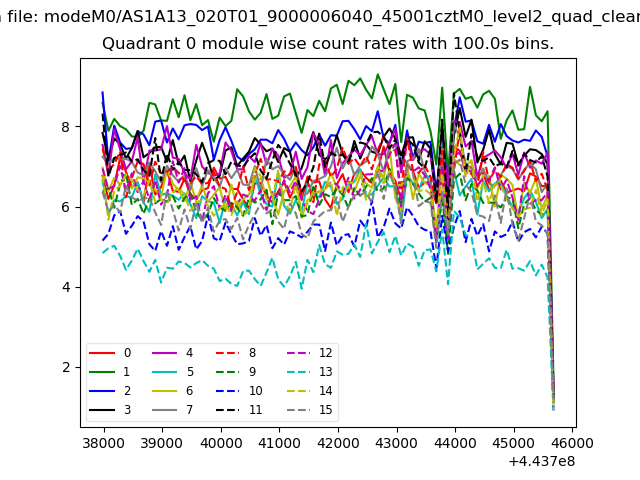 |
 |
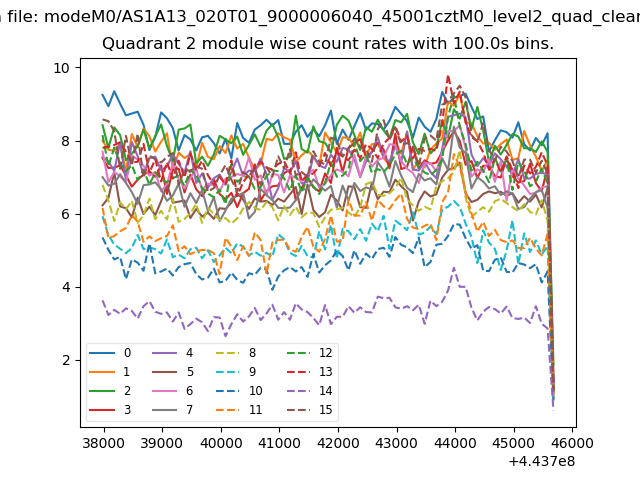
| Module-wise count rates for Quadrant B Data is divided into 100 sec bins |
 |
 |
| Module-wise count rates for Quadrant C Data is divided into 100 sec bins |
 |
 |
| Module-wise count rates for Quadrant D Data is divided into 100 sec bins |
 |
 |
| Parameter | Plot |
|---|---|
| CZT HV Monitor | 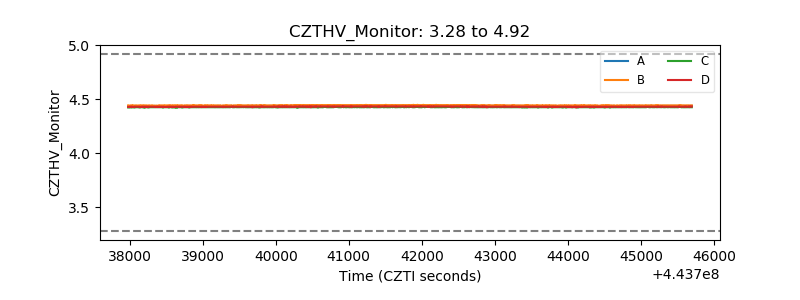 |
| D_VDD | 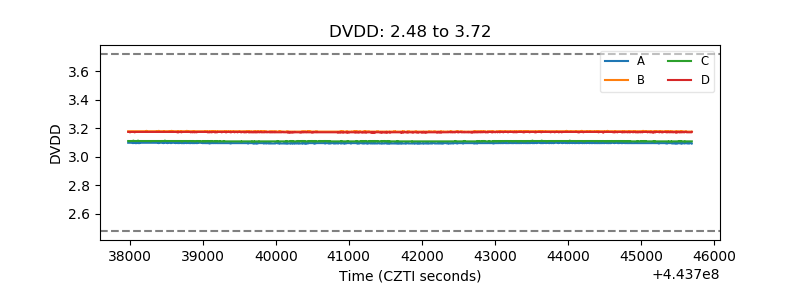 |
| Temperature 1 | 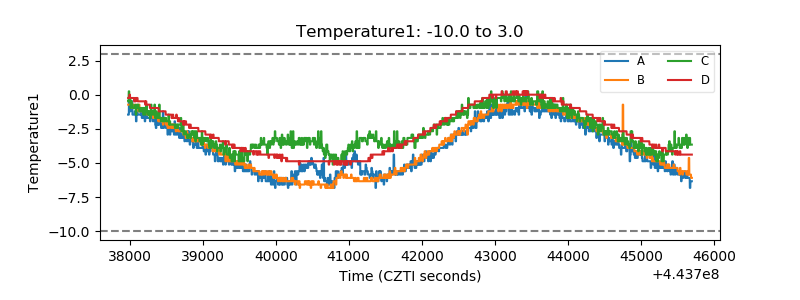 |
| Veto HV Monitor | 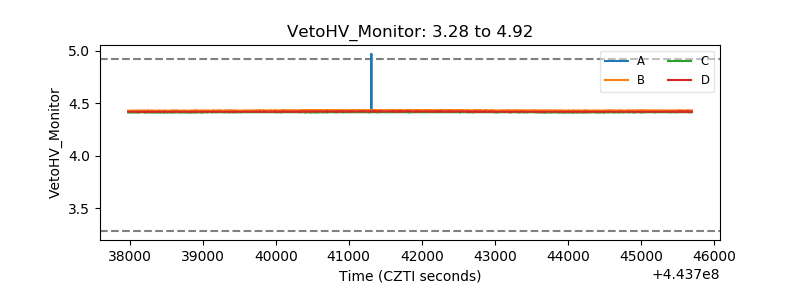 |
| Veto LLD | 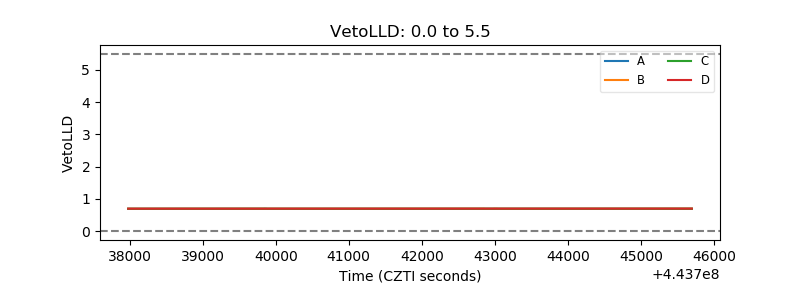 |
| Alpha Counter | 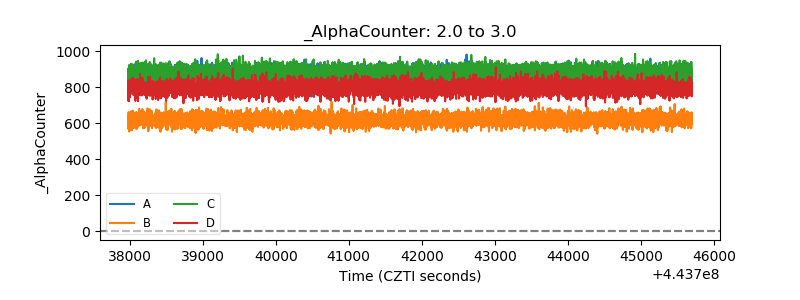 |
| _CPM_Rate | 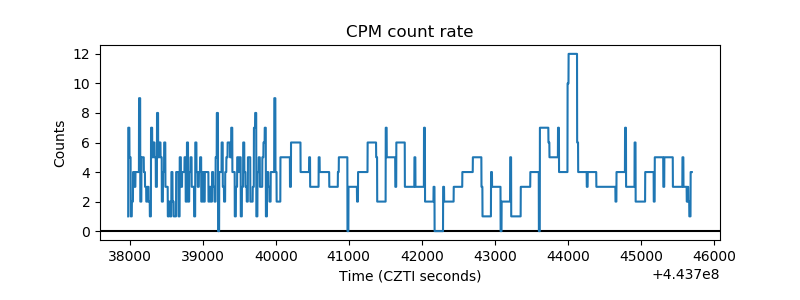 |
| CZT Counter | 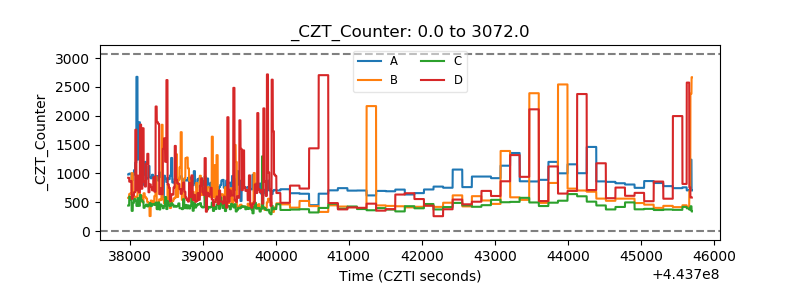 |
| +2.5 Volts monitor | 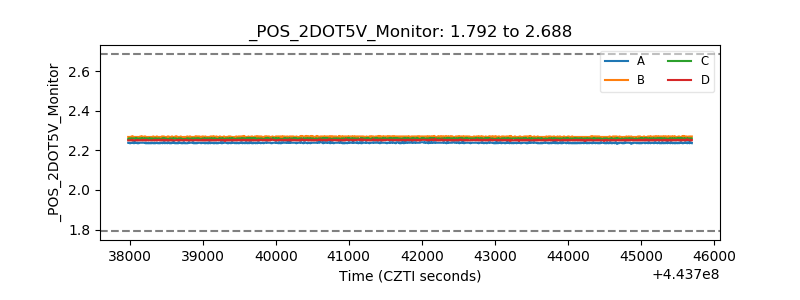 |
| +5 Volts monitor | 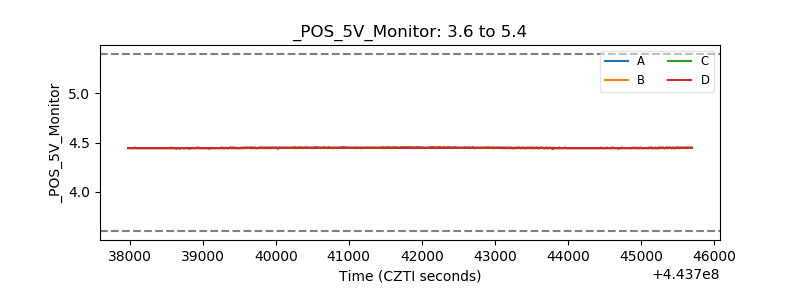 |
| _ROLL_ROT | 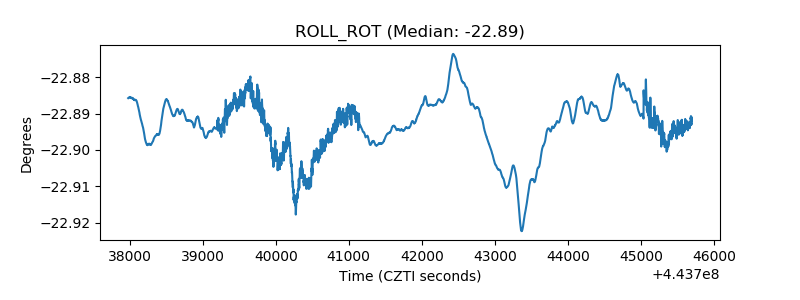 |
| _Roll_DEC | 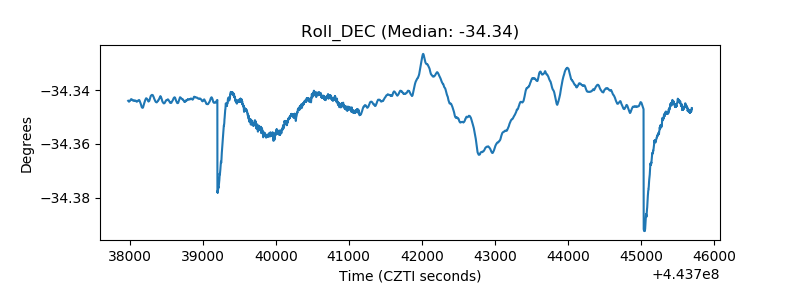 |
| _Roll_RA | 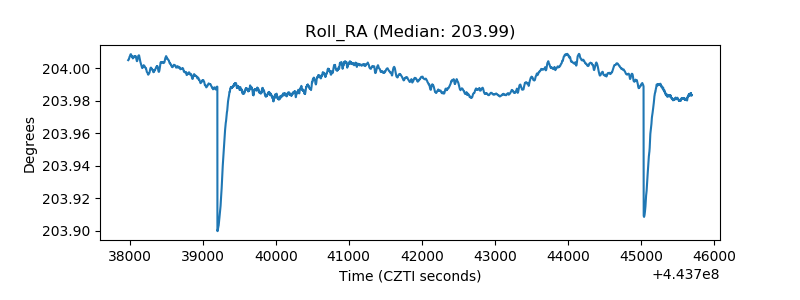 |
| Veto Counter | 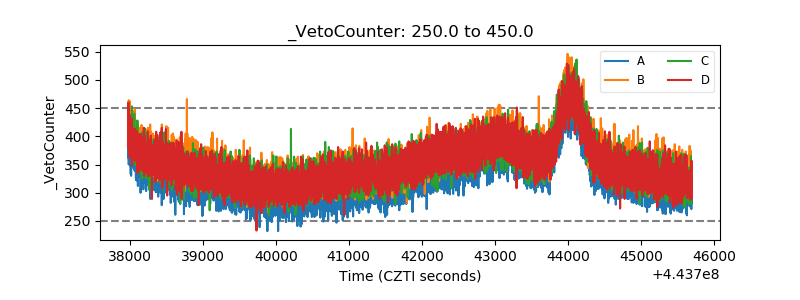 |