| Param | Original file | Final file |
|---|---|---|
| Filename | modeM0/AS1A13_020T01_9000006040_45005cztM0_level2.fits | modeM0/AS1A13_020T01_9000006040_45005cztM0_level2_quad_clean.evt |
| Size (bytes) | 1,868,670,720 | 378,803,520 |
| Size | 1.7 GB | 361.3 MB |
| Events in quadrant A | 19,726,766 | 2,512,894 |
| Events in quadrant B | 13,288,227 | 2,599,270 |
| Events in quadrant C | 11,410,501 | 2,545,445 |
| Events in quadrant D | 22,884,820 | 2,150,472 |
| Mode SS | |||
|---|---|---|---|
| Quadrant | BADHDUFLAG | Total packets | Discarded packets |
| A | 0 | 490 | 0 |
| B | 0 | 490 | 0 |
| C | 0 | 490 | 0 |
| D | 0 | 490 | 0 |
| Mode M9 | |||
|---|---|---|---|
| Quadrant | BADHDUFLAG | Total packets | Discarded packets |
| A | 0 | 19 | 0 |
| B | 0 | 19 | 0 |
| C | 0 | 19 | 0 |
| D | 0 | 19 | 0 |
| Mode M0 | |||
|---|---|---|---|
| Quadrant | BADHDUFLAG | Total packets | Discarded packets |
| A | 0 | 77102 | 4 |
| B | 0 | 56203 | 4 |
| C | 0 | 51456 | 4 |
| D | 0 | 84854 | 4 |
| Quadrant | Total seconds | Saturated seconds | Saturation percentage |
|---|---|---|---|
| A | 24122 | 722 | 2.993118% |
| B | 24122 | 667 | 2.765111% |
| C | 24123 | 184 | 0.762758% |
| D | 24123 | 2550 | 10.570825% |
Noise dominated data is calculated using 1-second bins in cleaned event files. If a bin has >2000 counts, and if more than 50% of those come from <1% of pixels, then it is considered to be noise-dominated and hence unusable.
| Quadrant | # 1 sec bins | Bins with >0 counts | Bins with >2000 counts | High rate bins dominated by noise | Noise dominated (total time) | Noise dominated (detector-on time) | Marked lightcurve |
|---|---|---|---|---|---|---|---|
| A | 26092 | 24126 | 247 | 247 | 0.95% | 1.02% | 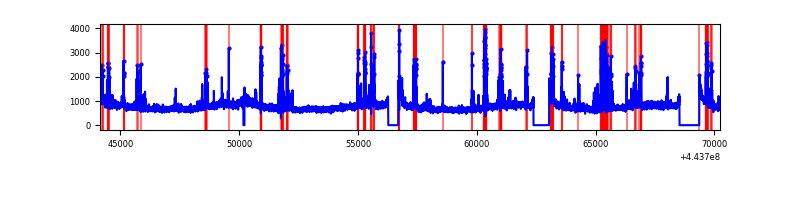 |
| B | 26092 | 24126 | 290 | 290 | 1.11% | 1.20% | 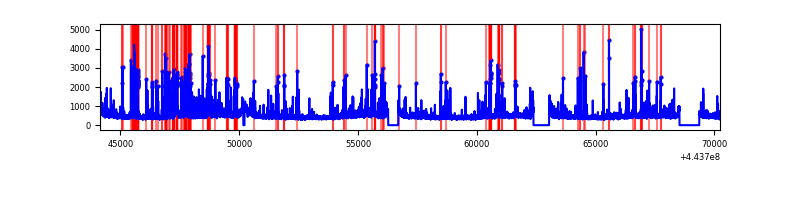 |
| C | 26093 | 24127 | 72 | 72 | 0.28% | 0.30% | 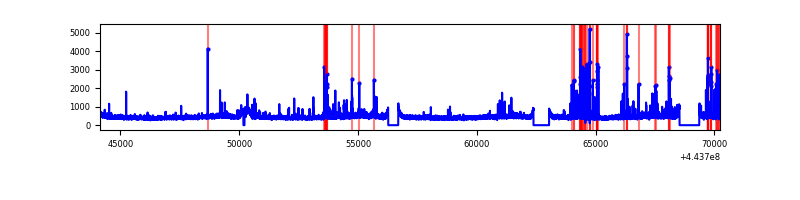 |
| D | 26093 | 24127 | 2089 | 2089 | 8.01% | 8.66% | 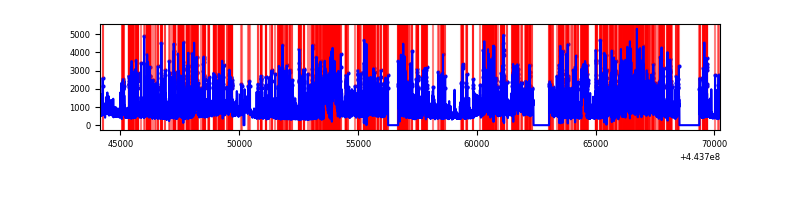 |
Top three noisy pixels from each quadrant. If the there are fewer than three noisy pixels in the level2.evt file, extra rows are filled as -1
| Pixel properties | Quadrant properties | ||||||
|---|---|---|---|---|---|---|---|
| Quadrant | DetID | PixID | Counts | Sigma | Mean | Median | Sigma |
| A | 10 | 83 | 8036245 | 14398.5 | 2683 | 2626 | 557.9 |
| A | 13 | 248 | 1051019 | 1879.01 | 2683 | 2626 | 557.9 |
| A | 10 | 248 | 84741 | 147.17 | 2683 | 2626 | 557.9 |
| B | 5 | 255 | 1000980 | 1894.15 | 2688 | 2607 | 527.1 |
| B | 0 | 189 | 796517 | 1506.23 | 2688 | 2607 | 527.1 |
| B | 5 | 172 | 217248 | 407.22 | 2688 | 2607 | 527.1 |
| C | 14 | 254 | 464821 | 733.03 | 2671 | 2685 | 630.4 |
| C | 15 | 208 | 167736 | 261.8 | 2671 | 2685 | 630.4 |
| C | 11 | 16 | 161020 | 251.15 | 2671 | 2685 | 630.4 |
| D | 1 | 52 | 5357483 | 8298.55 | 2552 | 2474 | 645.3 |
| D | 13 | 249 | 2845351 | 4405.55 | 2552 | 2474 | 645.3 |
| D | 11 | 241 | 1936546 | 2997.19 | 2552 | 2474 | 645.3 |
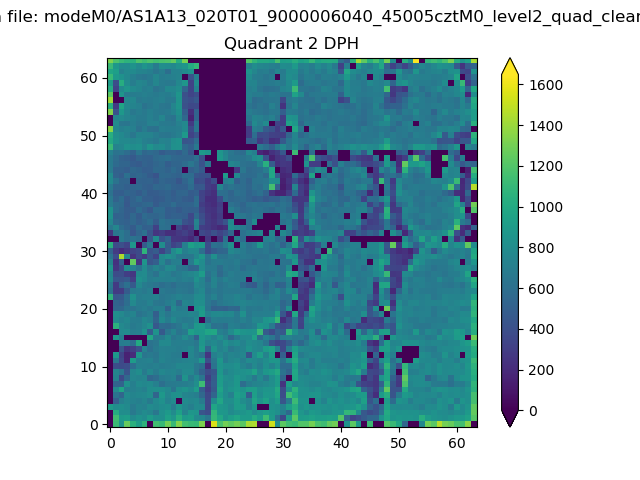
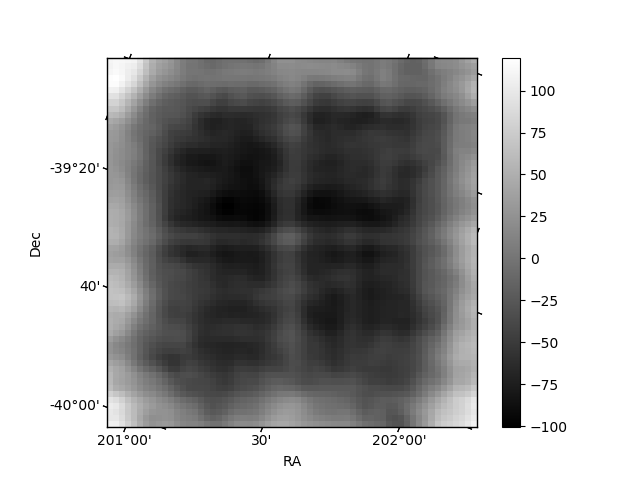
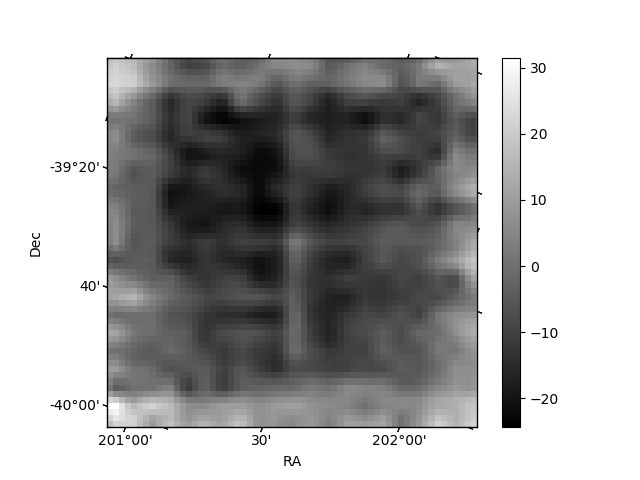
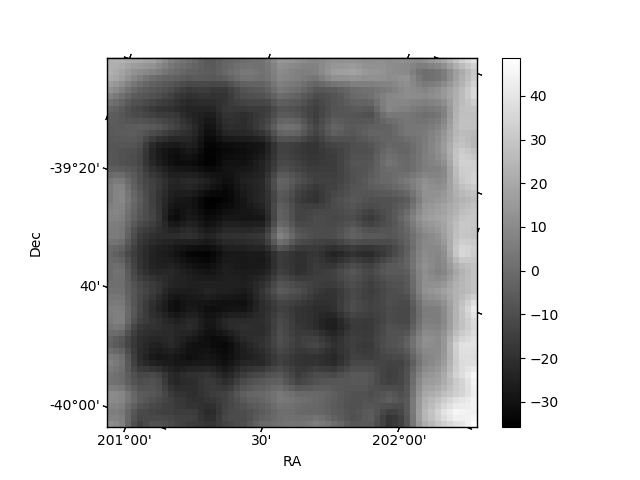
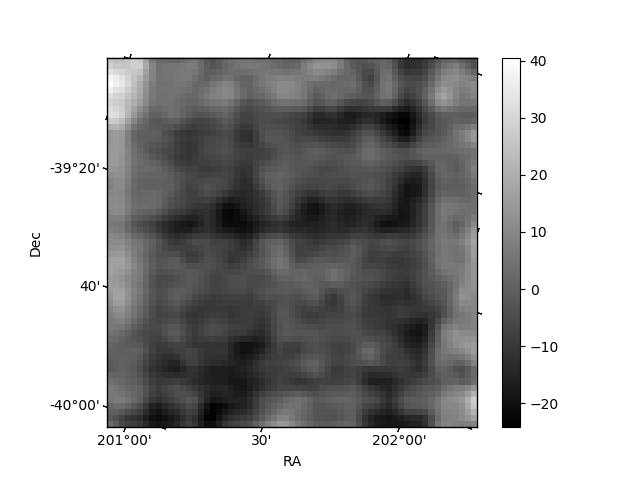
Histogram calculated using DETX and DETY for each event in the final _common_clean file
| Quadrant A | 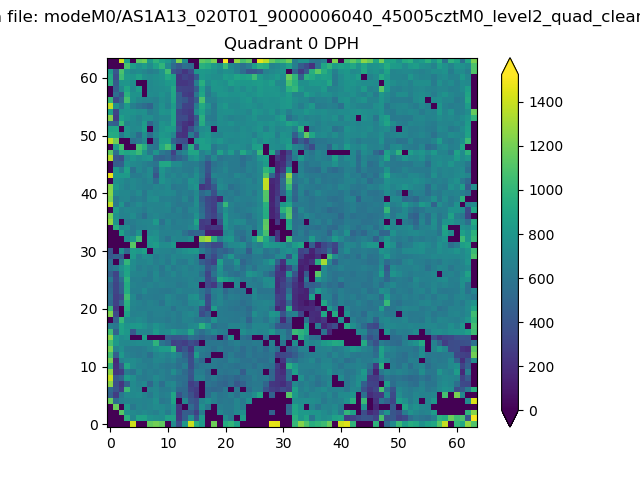 |
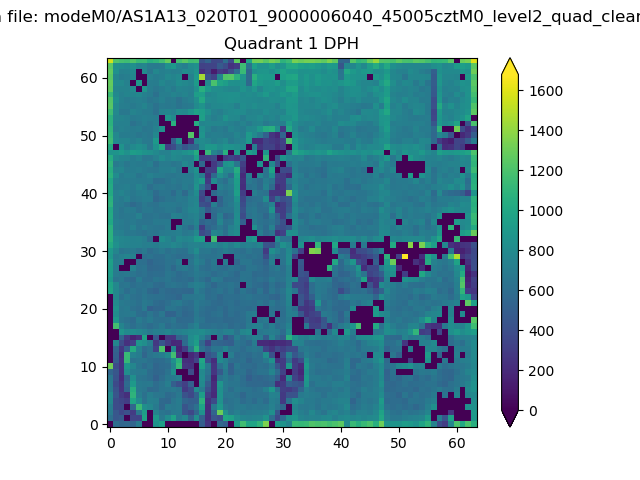 |
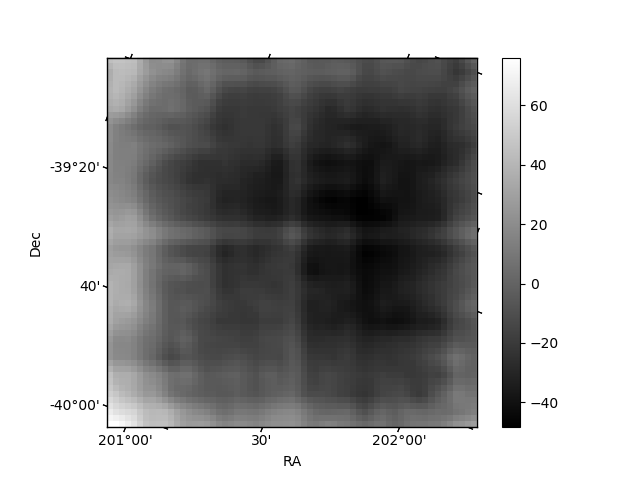
Quadrant B |
|---|---|---|---|
| Quadrant D | 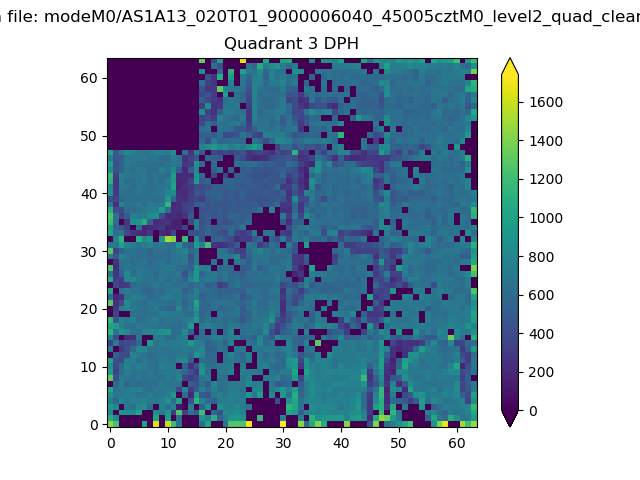 |
 |
Quadrant C |
| Plot type | Count rate plots | Images |
|---|---|---|
| Comparison with Poisson distribution Blue bars denote a histogram of data divided into 1 sec bins. Red curve is a Poisson curve with rate = median count rate of data. |
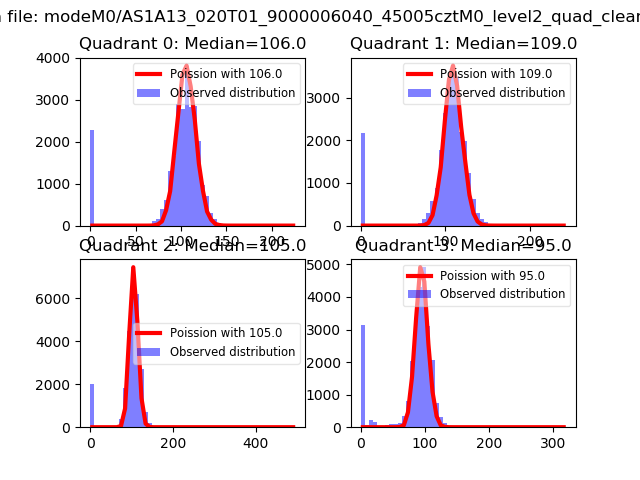 |
 |
| Quadrant-wise count rates Data is divided into 100 sec bins |
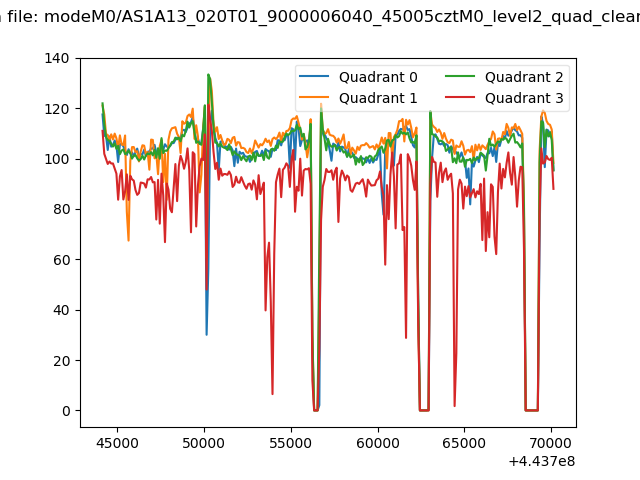 |
|
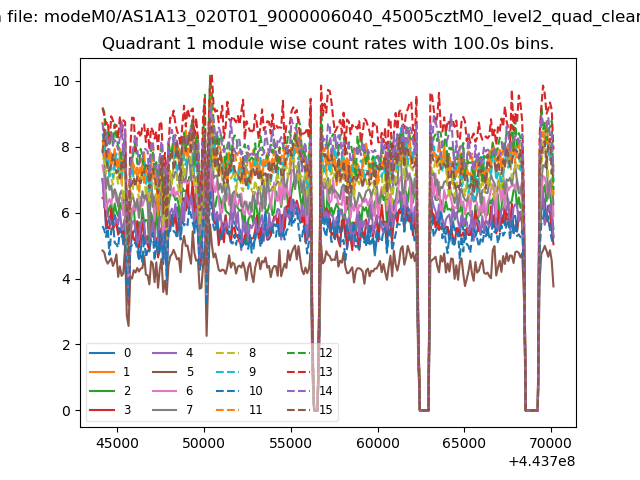
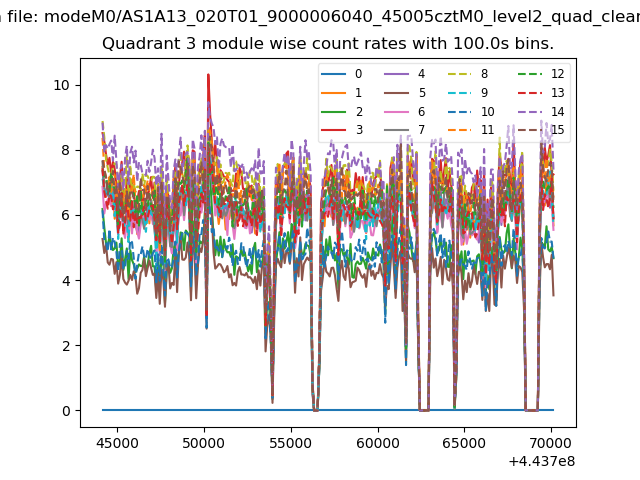
| Module-wise count rates for Quadrant A Data is divided into 100 sec bins |
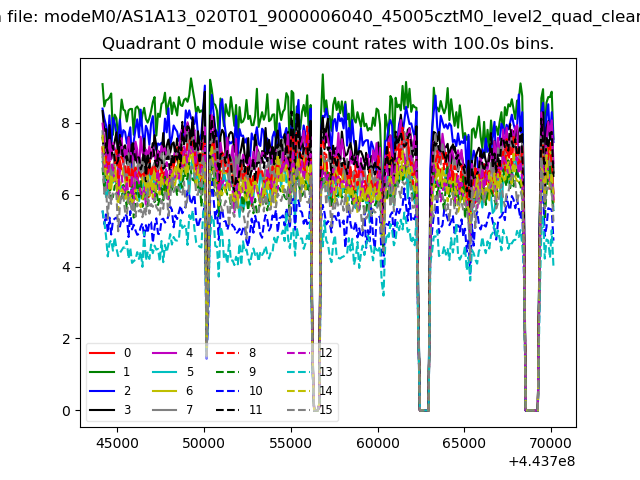 |
 |
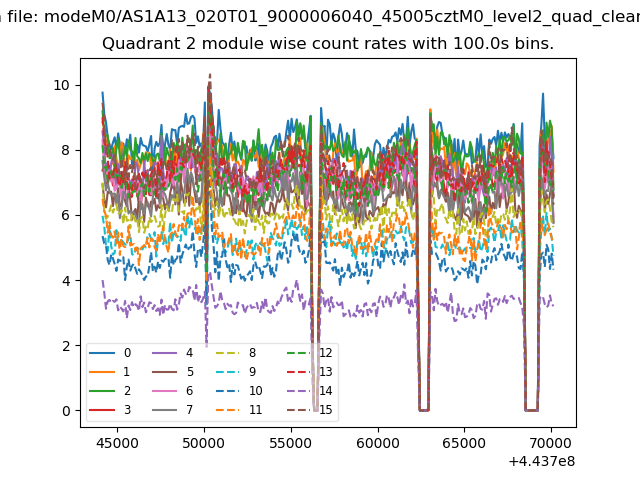
| Module-wise count rates for Quadrant B Data is divided into 100 sec bins |
 |
 |
| Module-wise count rates for Quadrant C Data is divided into 100 sec bins |
 |
 |
| Module-wise count rates for Quadrant D Data is divided into 100 sec bins |
 |
 |
| Parameter | Plot |
|---|---|
| CZT HV Monitor | 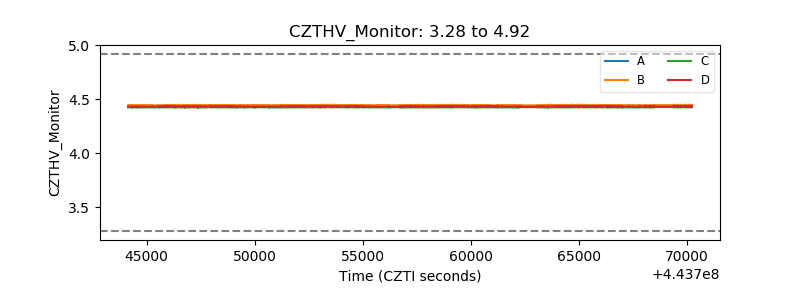 |
| D_VDD | 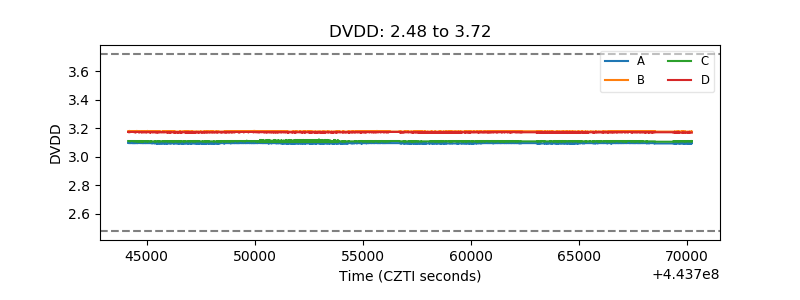 |
| Temperature 1 | 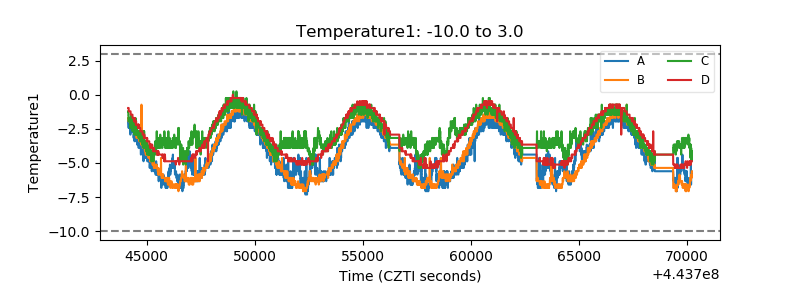 |
| Veto HV Monitor | 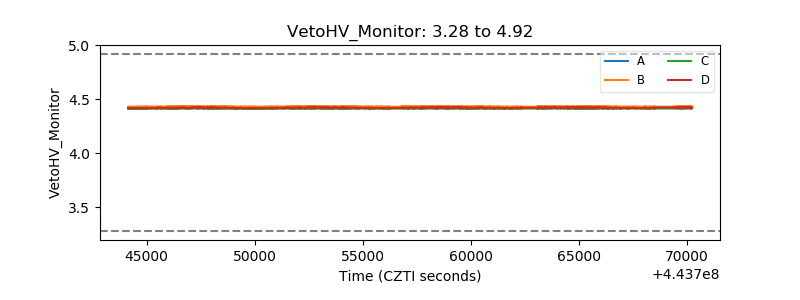 |
| Veto LLD | 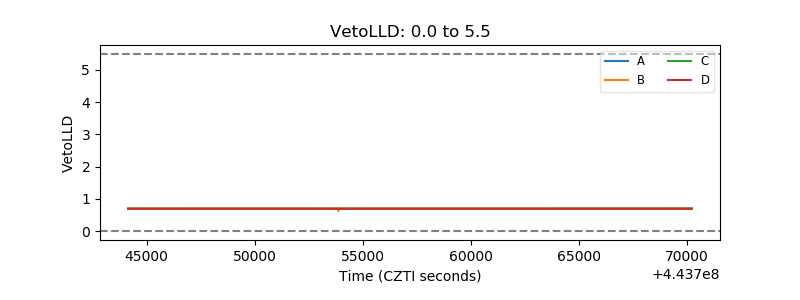 |
| Alpha Counter | 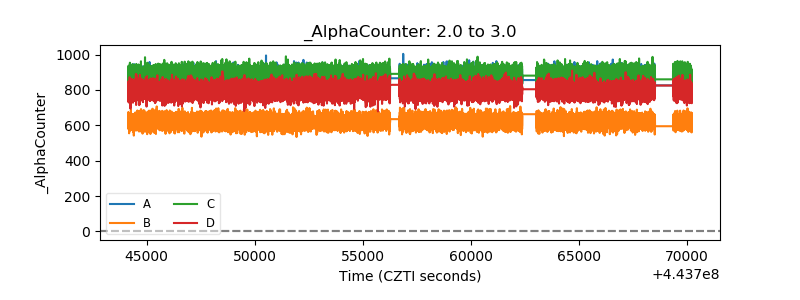 |
| _CPM_Rate | 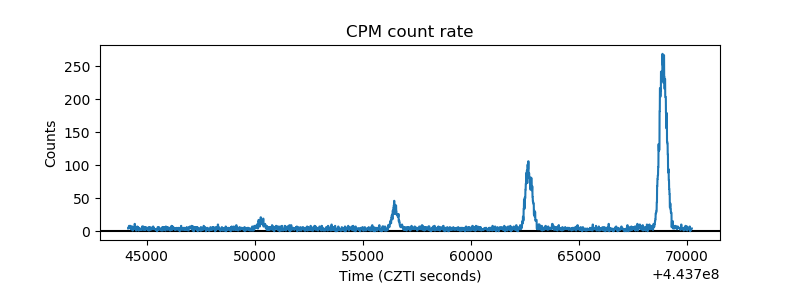 |
| CZT Counter | 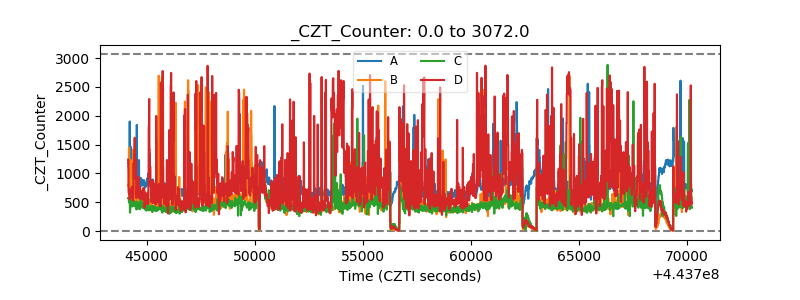 |
| +2.5 Volts monitor | 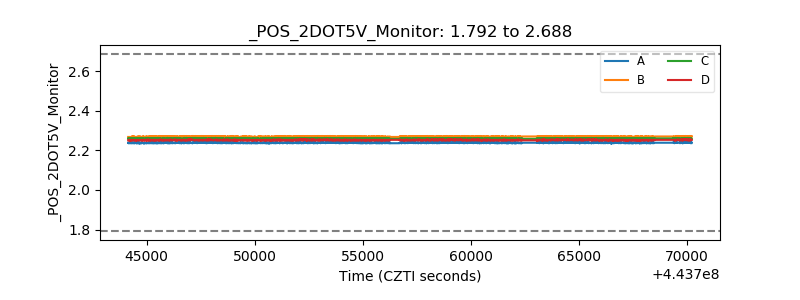 |
| +5 Volts monitor | 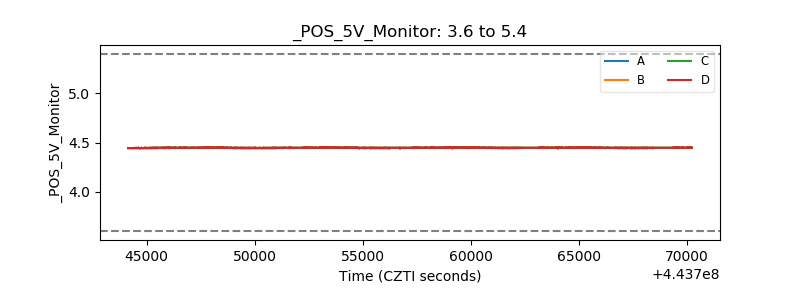 |
| _ROLL_ROT | 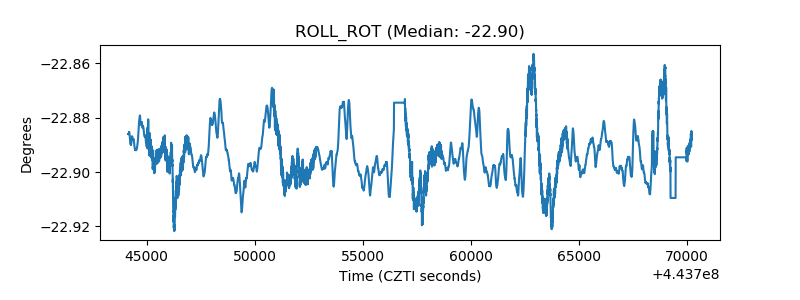 |
| _Roll_DEC | 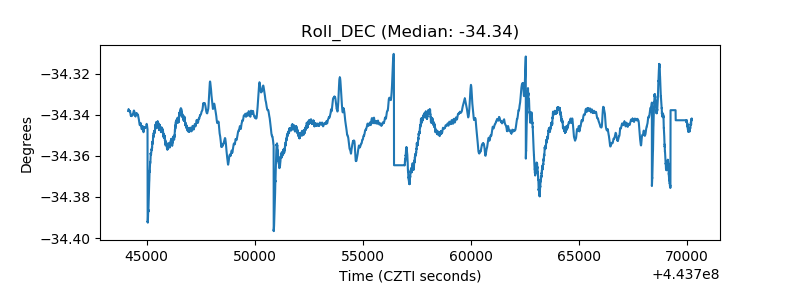 |
| _Roll_RA | 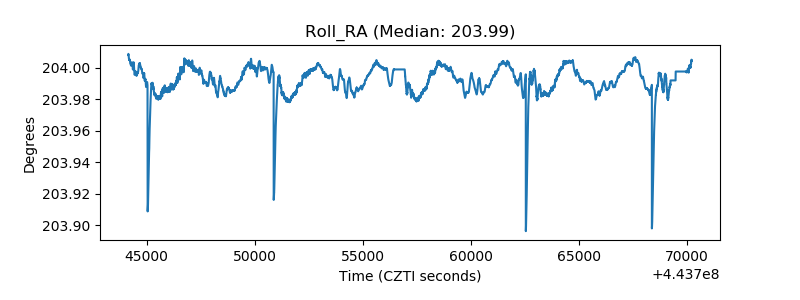 |
| Veto Counter | 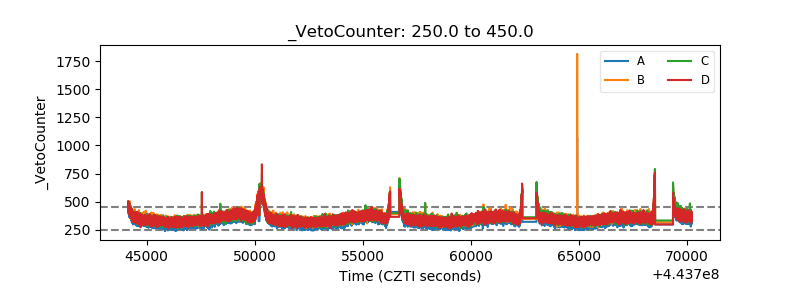 |