| Param | Original file | Final file |
|---|---|---|
| Filename | modeM0/AS1A13_020T01_9000006040_45006cztM0_level2.fits | modeM0/AS1A13_020T01_9000006040_45006cztM0_level2_quad_clean.evt |
| Size (bytes) | 490,026,240 | 98,066,880 |
| Size | 467.3 MB | 93.5 MB |
| Events in quadrant A | 5,259,827 | 649,049 |
| Events in quadrant B | 3,152,472 | 689,406 |
| Events in quadrant C | 3,076,628 | 668,874 |
| Events in quadrant D | 6,166,886 | 527,328 |
| Mode SS | |||
|---|---|---|---|
| Quadrant | BADHDUFLAG | Total packets | Discarded packets |
| A | 0 | 126 | 0 |
| B | 0 | 126 | 0 |
| C | 0 | 126 | 0 |
| D | 0 | 126 | 0 |
| Mode M9 | |||
|---|---|---|---|
| Quadrant | BADHDUFLAG | Total packets | Discarded packets |
| A | 0 | 10 | 0 |
| B | 0 | 10 | 0 |
| C | 0 | 10 | 0 |
| D | 0 | 10 | 0 |
| Mode M0 | |||
|---|---|---|---|
| Quadrant | BADHDUFLAG | Total packets | Discarded packets |
| A | 0 | 20364 | 1 |
| B | 0 | 13625 | 1 |
| C | 0 | 13553 | 1 |
| D | 0 | 22575 | 1 |
| Quadrant | Total seconds | Saturated seconds | Saturation percentage |
|---|---|---|---|
| A | 6225 | 248 | 3.983936% |
| B | 6226 | 92 | 1.477674% |
| C | 6226 | 95 | 1.525859% |
| D | 6225 | 1003 | 16.112450% |
Noise dominated data is calculated using 1-second bins in cleaned event files. If a bin has >2000 counts, and if more than 50% of those come from <1% of pixels, then it is considered to be noise-dominated and hence unusable.
| Quadrant | # 1 sec bins | Bins with >0 counts | Bins with >2000 counts | High rate bins dominated by noise | Noise dominated (total time) | Noise dominated (detector-on time) | Marked lightcurve |
|---|---|---|---|---|---|---|---|
| A | 7185 | 6226 | 117 | 117 | 1.63% | 1.88% | 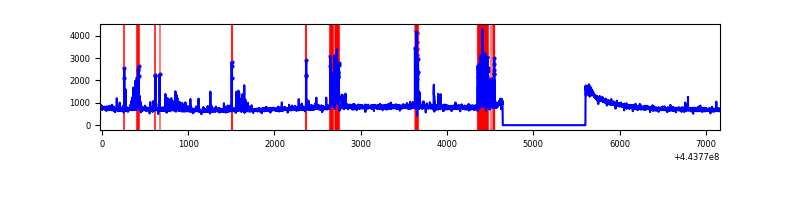 |
| B | 7186 | 6227 | 29 | 29 | 0.40% | 0.47% | 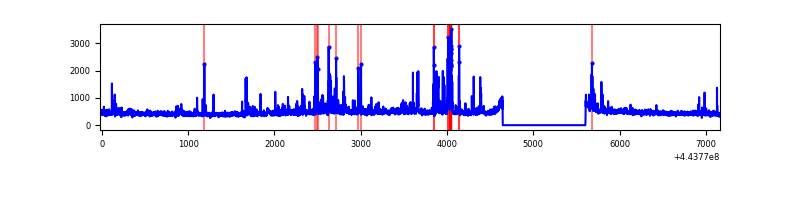 |
| C | 7186 | 6227 | 47 | 47 | 0.65% | 0.75% | 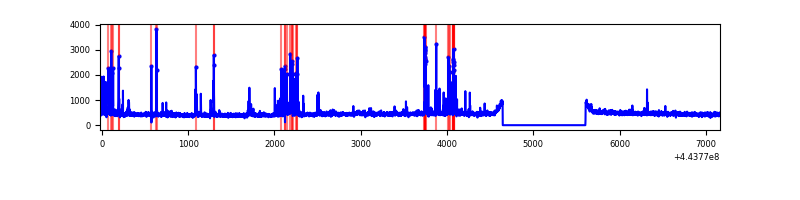 |
| D | 7185 | 6226 | 794 | 794 | 11.05% | 12.75% | 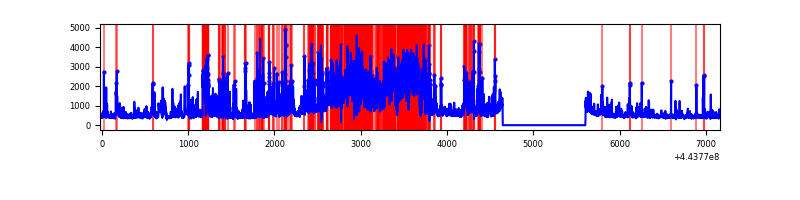 |
Top three noisy pixels from each quadrant. If the there are fewer than three noisy pixels in the level2.evt file, extra rows are filled as -1
| Pixel properties | Quadrant properties | ||||||
|---|---|---|---|---|---|---|---|
| Quadrant | DetID | PixID | Counts | Sigma | Mean | Median | Sigma |
| A | 10 | 83 | 2108933 | 14761.03 | 686 | 671 | 142.8 |
| A | 13 | 248 | 440226 | 3077.55 | 686 | 671 | 142.8 |
| A | 10 | 248 | 52224 | 360.95 | 686 | 671 | 142.8 |
| B | 5 | 255 | 237949 | 1735.46 | 690 | 670 | 136.7 |
| B | 4 | 171 | 47028 | 339.06 | 690 | 670 | 136.7 |
| B | 0 | 189 | 36197 | 259.84 | 690 | 670 | 136.7 |
| C | 14 | 254 | 302039 | 1852.58 | 690 | 696 | 162.7 |
| C | 15 | 208 | 50966 | 309.05 | 690 | 696 | 162.7 |
| C | 3 | 233 | 17405 | 102.72 | 690 | 696 | 162.7 |
| D | 12 | 233 | 1370604 | 8444.04 | 642 | 623 | 162.2 |
| D | 1 | 52 | 844037 | 5198.48 | 642 | 623 | 162.2 |
| D | 13 | 249 | 672557 | 4141.55 | 642 | 623 | 162.2 |
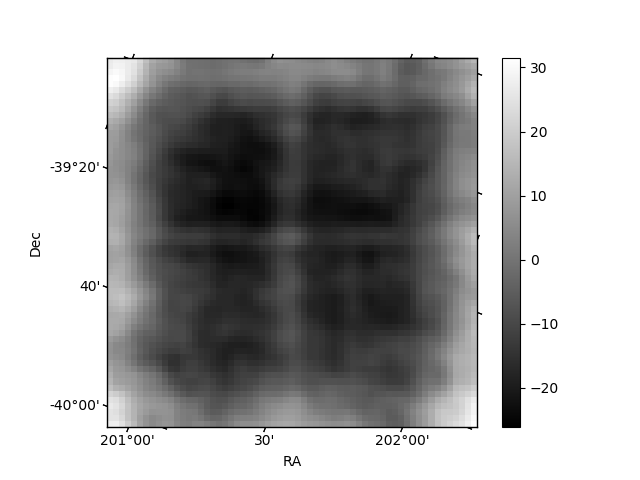
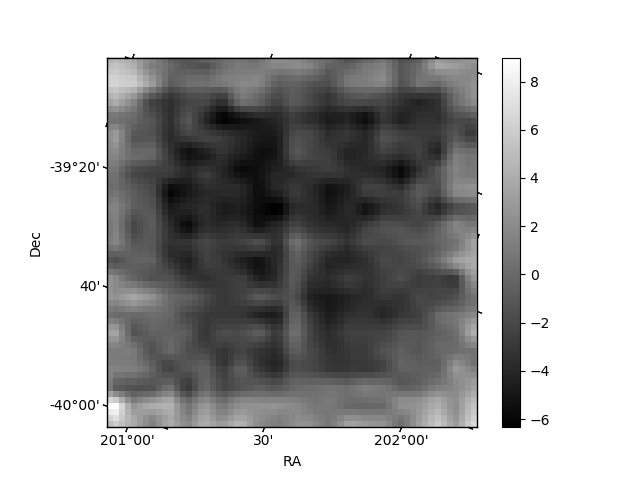
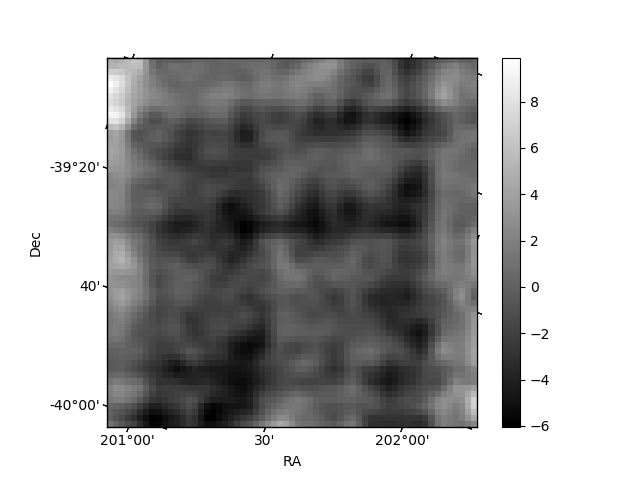
Histogram calculated using DETX and DETY for each event in the final _common_clean file
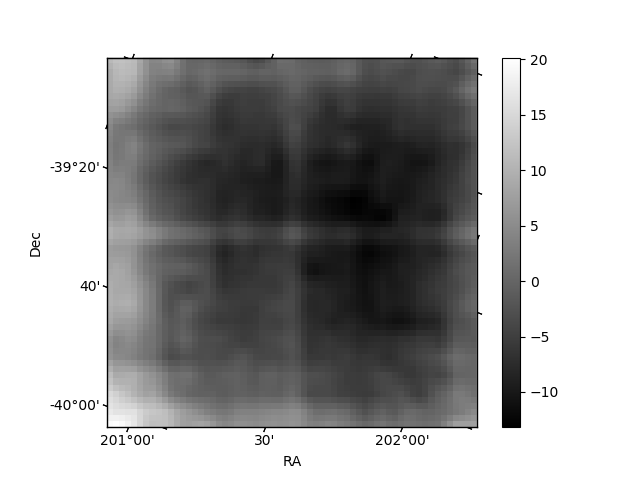
| Quadrant A | 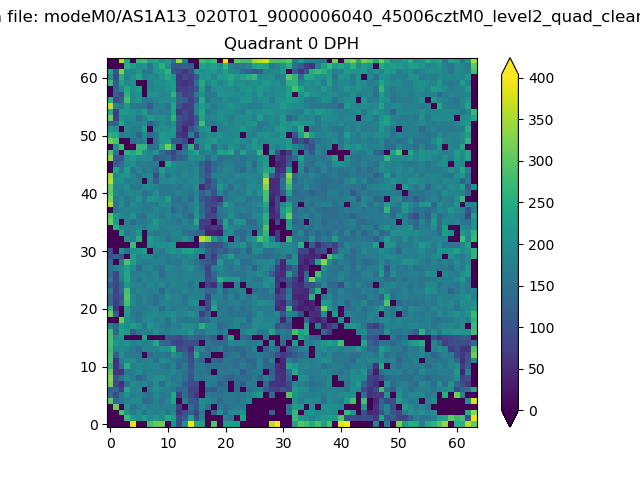 |
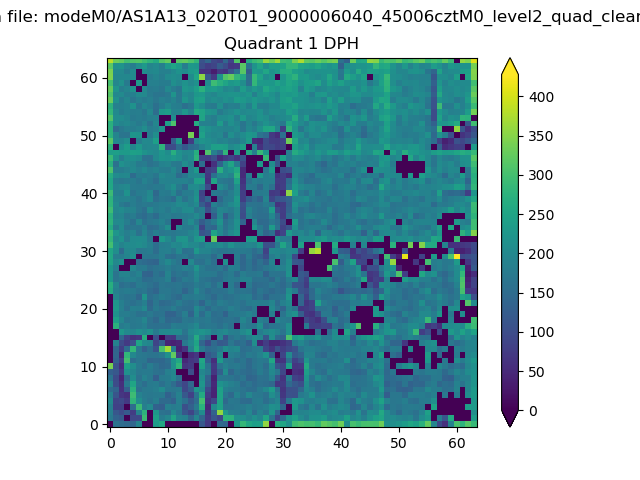 |
Quadrant B |
|---|---|---|---|
| Quadrant D | 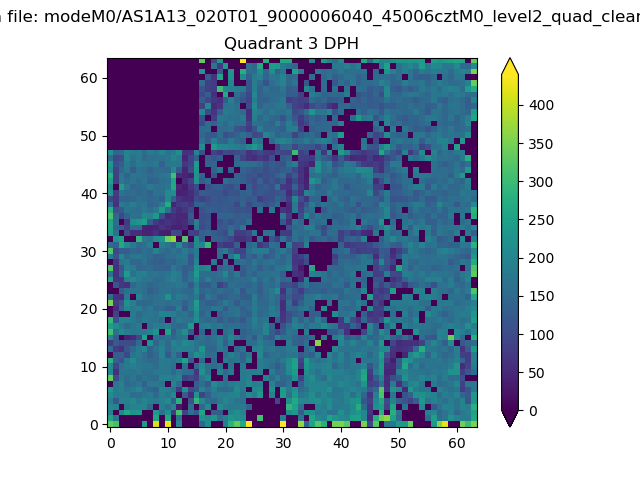 |
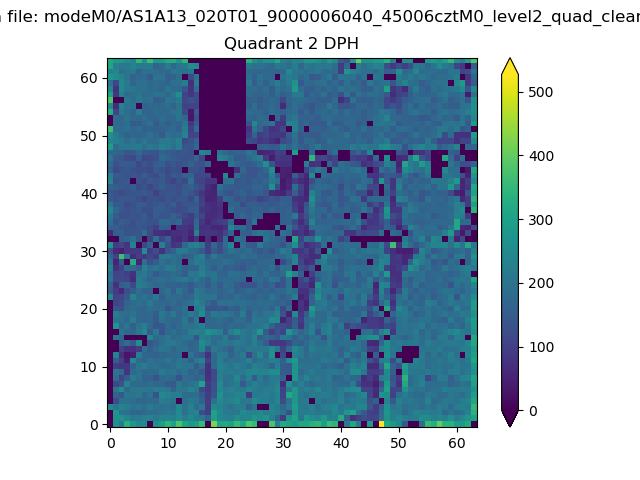 |
Quadrant C |
| Plot type | Count rate plots | Images |
|---|---|---|
| Comparison with Poisson distribution Blue bars denote a histogram of data divided into 1 sec bins. Red curve is a Poisson curve with rate = median count rate of data. |
 |
 |
| Quadrant-wise count rates Data is divided into 100 sec bins |
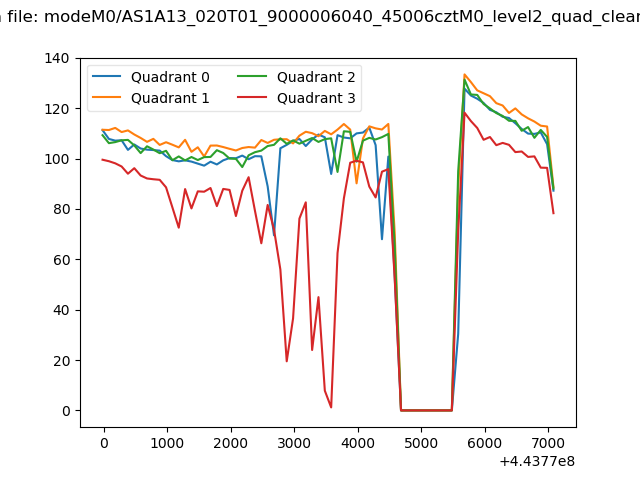 |
|
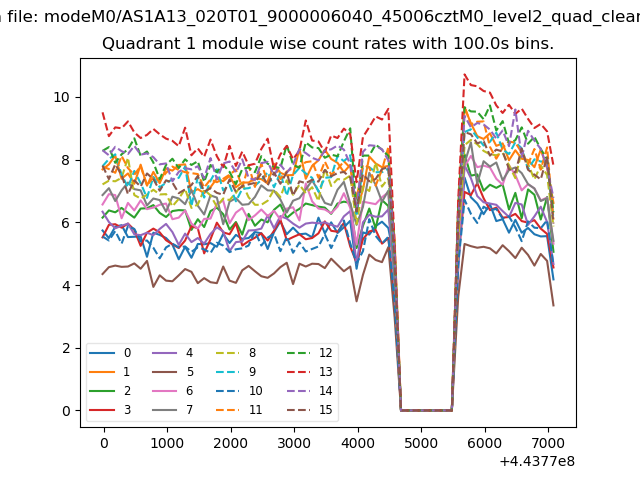
| Module-wise count rates for Quadrant A Data is divided into 100 sec bins |
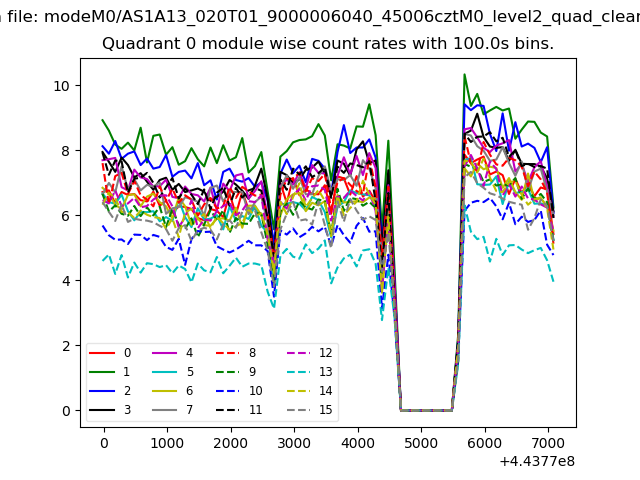 |
 |
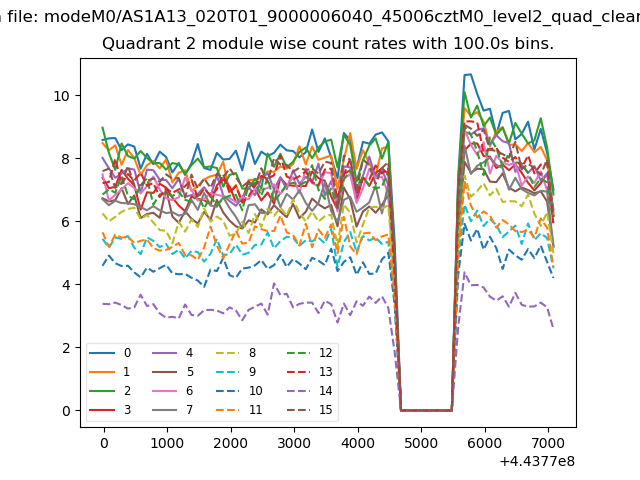
| Module-wise count rates for Quadrant B Data is divided into 100 sec bins |
 |
 |
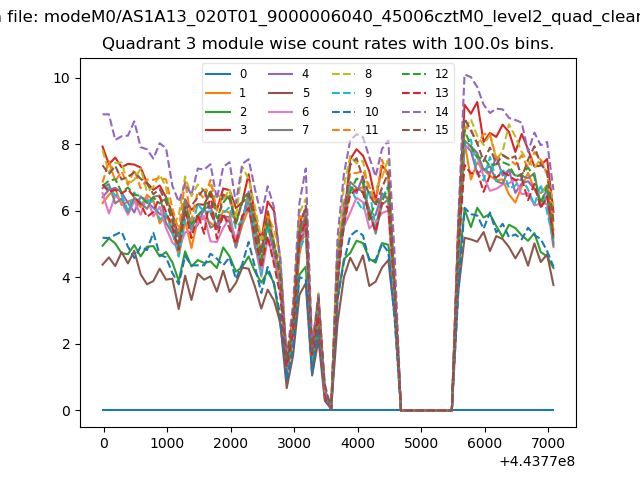
| Module-wise count rates for Quadrant C Data is divided into 100 sec bins |
 |
 |
| Module-wise count rates for Quadrant D Data is divided into 100 sec bins |
 |
 |
| Parameter | Plot |
|---|---|
| CZT HV Monitor | 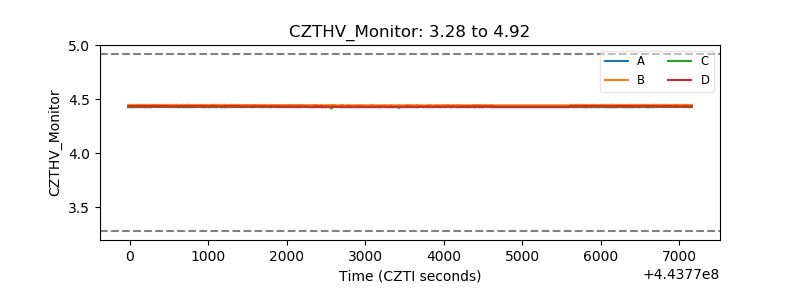 |
| D_VDD | 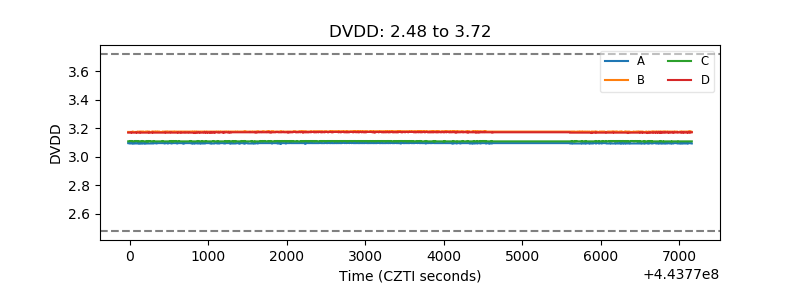 |
| Temperature 1 | 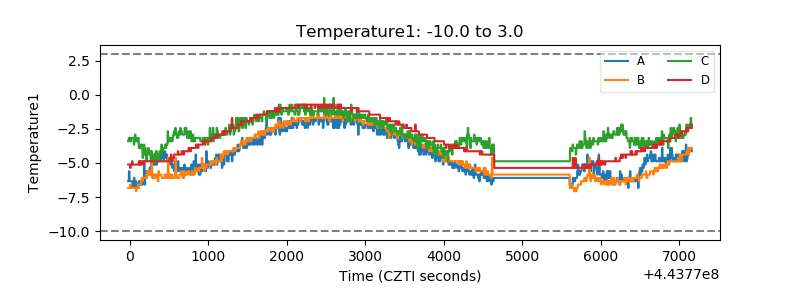 |
| Veto HV Monitor | 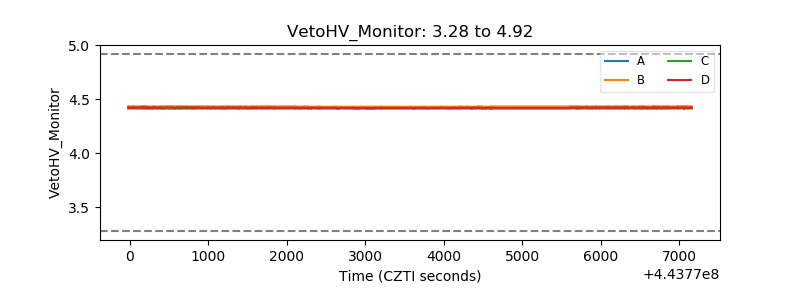 |
| Veto LLD | 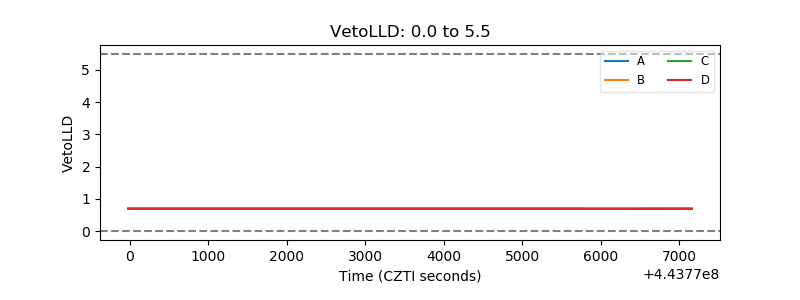 |
| Alpha Counter | 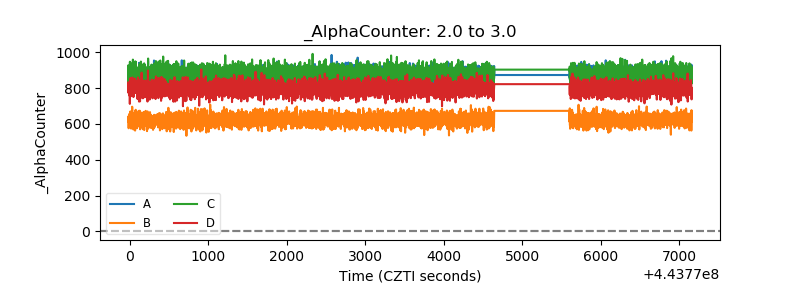 |
| _CPM_Rate | 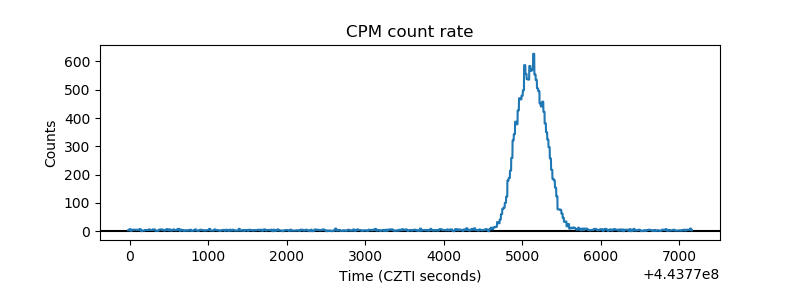 |
| CZT Counter | 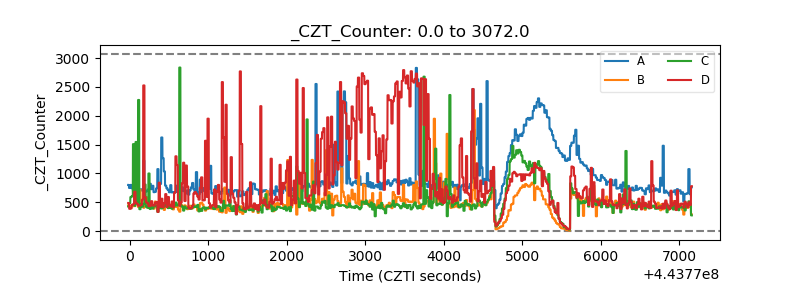 |
| +2.5 Volts monitor | 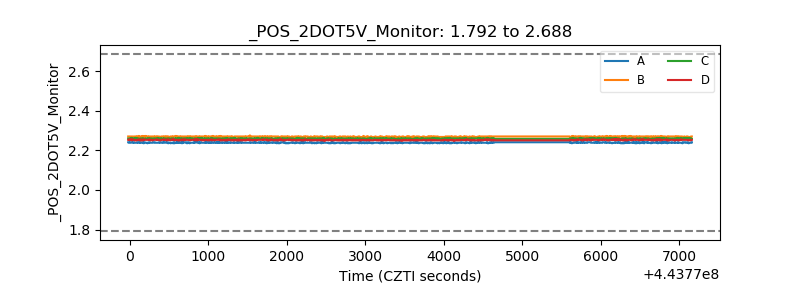 |
| +5 Volts monitor |  |
| _ROLL_ROT | 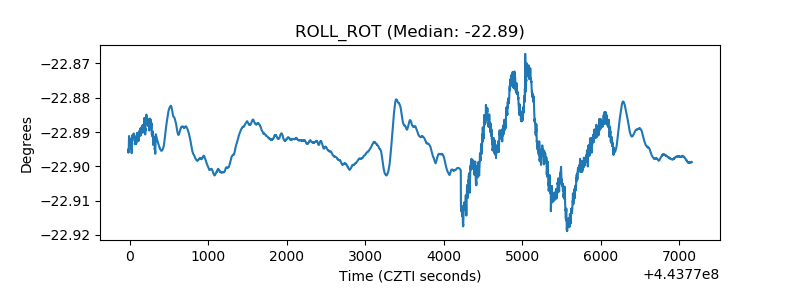 |
| _Roll_DEC | 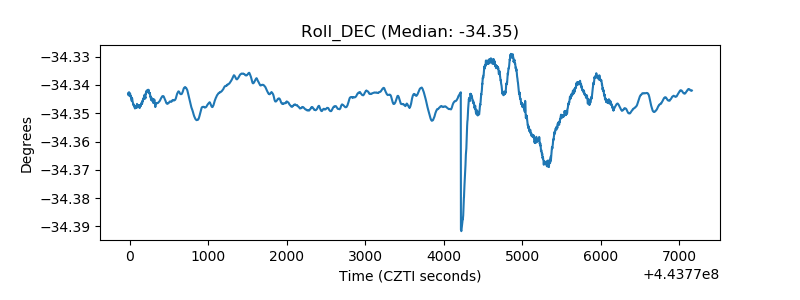 |
| _Roll_RA | 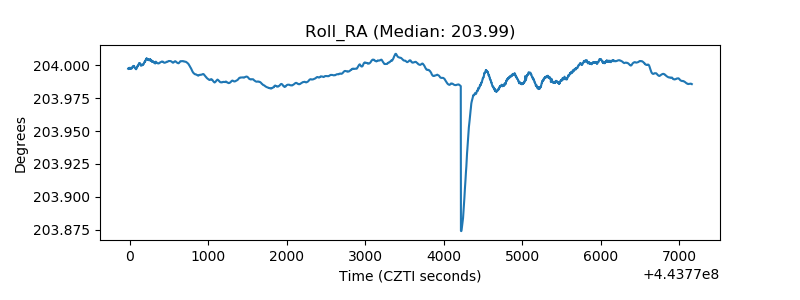 |
| Veto Counter | 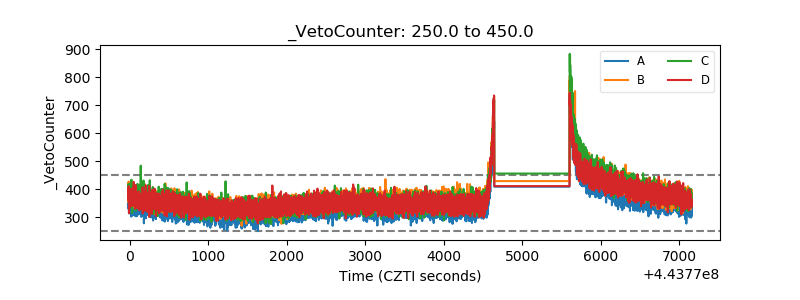 |