| Param | Original file | Final file |
|---|---|---|
| Filename | modeM0/AS1A13_020T01_9000006040_45009cztM0_level2.fits | modeM0/AS1A13_020T01_9000006040_45009cztM0_level2_quad_clean.evt |
| Size (bytes) | 512,285,760 | 104,906,880 |
| Size | 488.6 MB | 100.0 MB |
| Events in quadrant A | 5,177,427 | 709,934 |
| Events in quadrant B | 4,124,966 | 719,472 |
| Events in quadrant C | 2,835,956 | 712,493 |
| Events in quadrant D | 6,357,189 | 613,062 |
| Mode SS | |||
|---|---|---|---|
| Quadrant | BADHDUFLAG | Total packets | Discarded packets |
| A | 0 | 122 | 0 |
| B | 0 | 122 | 0 |
| C | 0 | 122 | 0 |
| D | 0 | 122 | 0 |
| Mode M9 | |||
|---|---|---|---|
| Quadrant | BADHDUFLAG | Total packets | Discarded packets |
| A | 0 | 11 | 0 |
| B | 0 | 11 | 0 |
| C | 0 | 11 | 0 |
| D | 0 | 11 | 0 |
| Mode M0 | |||
|---|---|---|---|
| Quadrant | BADHDUFLAG | Total packets | Discarded packets |
| A | 0 | 19276 | 1 |
| B | 0 | 16208 | 2 |
| C | 0 | 12434 | 1 |
| D | 0 | 23005 | 1 |
| Quadrant | Total seconds | Saturated seconds | Saturation percentage |
|---|---|---|---|
| A | 6036 | 163 | 2.700464% |
| B | 6036 | 248 | 4.108681% |
| C | 6036 | 27 | 0.447316% |
| D | 6036 | 497 | 8.233930% |
Noise dominated data is calculated using 1-second bins in cleaned event files. If a bin has >2000 counts, and if more than 50% of those come from <1% of pixels, then it is considered to be noise-dominated and hence unusable.
| Quadrant | # 1 sec bins | Bins with >0 counts | Bins with >2000 counts | High rate bins dominated by noise | Noise dominated (total time) | Noise dominated (detector-on time) | Marked lightcurve |
|---|---|---|---|---|---|---|---|
| A | 7211 | 6037 | 19 | 19 | 0.26% | 0.31% | 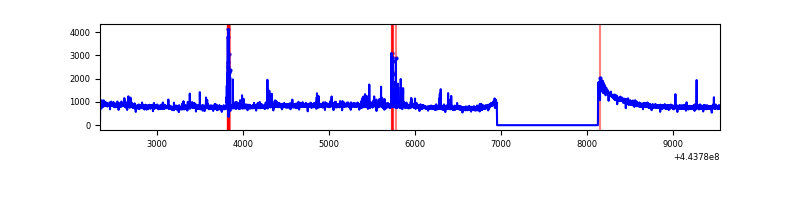 |
| B | 7211 | 6037 | 122 | 122 | 1.69% | 2.02% | 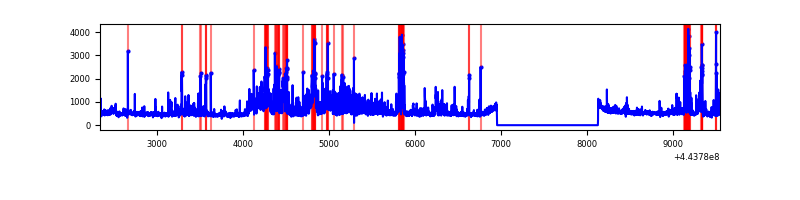 |
| C | 7211 | 6037 | 1 | 1 | 0.01% | 0.02% | 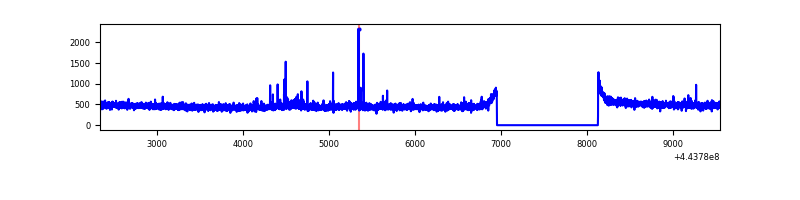 |
| D | 7211 | 6036 | 446 | 446 | 6.18% | 7.39% | 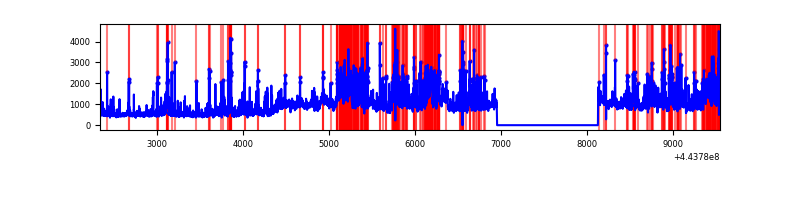 |
Top three noisy pixels from each quadrant. If the there are fewer than three noisy pixels in the level2.evt file, extra rows are filled as -1
| Pixel properties | Quadrant properties | ||||||
|---|---|---|---|---|---|---|---|
| Quadrant | DetID | PixID | Counts | Sigma | Mean | Median | Sigma |
| A | 10 | 83 | 2203950 | 14856.5 | 718 | 703 | 148.3 |
| A | 13 | 248 | 135146 | 906.55 | 718 | 703 | 148.3 |
| A | 10 | 248 | 39941 | 264.58 | 718 | 703 | 148.3 |
| B | 4 | 171 | 708230 | 5140.86 | 708 | 688 | 137.6 |
| B | 15 | 36 | 126077 | 911.05 | 708 | 688 | 137.6 |
| B | 5 | 172 | 116847 | 843.99 | 708 | 688 | 137.6 |
| C | 15 | 208 | 22699 | 132.63 | 711 | 716 | 165.7 |
| C | 3 | 9 | 17261 | 99.82 | 711 | 716 | 165.7 |
| C | 3 | 233 | 10499 | 59.02 | 711 | 716 | 165.7 |
| D | 11 | 241 | 1541828 | 8873.1 | 696 | 676 | 173.7 |
| D | 1 | 52 | 485615 | 2792.01 | 696 | 676 | 173.7 |
| D | 13 | 249 | 324621 | 1865.09 | 696 | 676 | 173.7 |
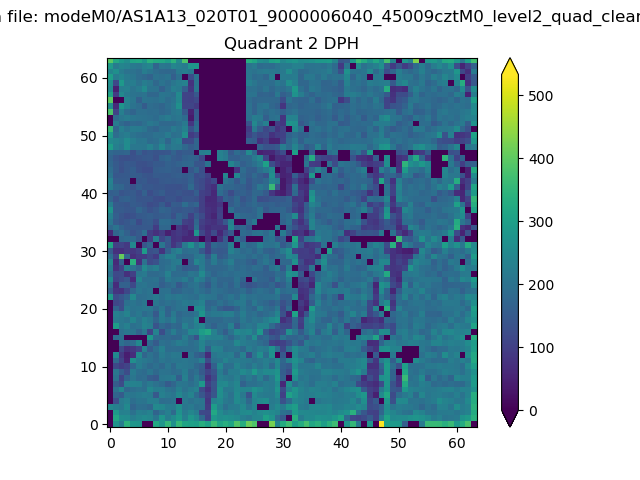
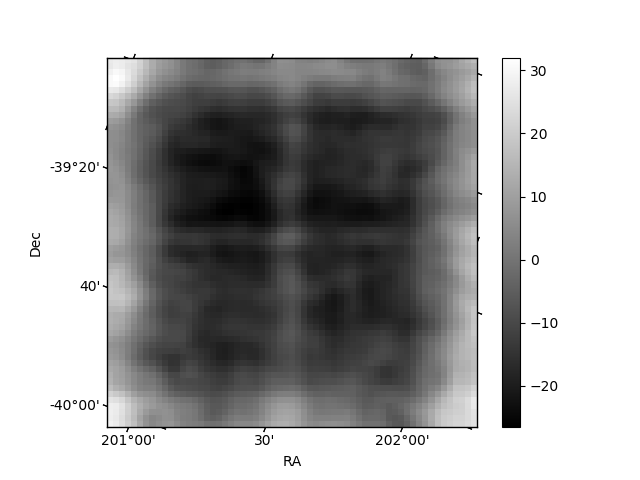
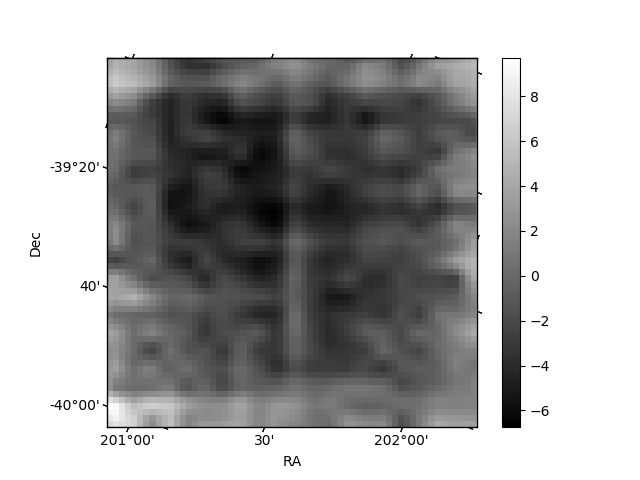
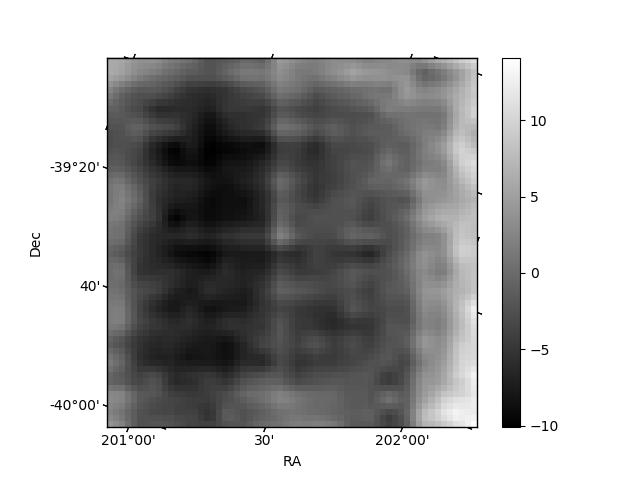
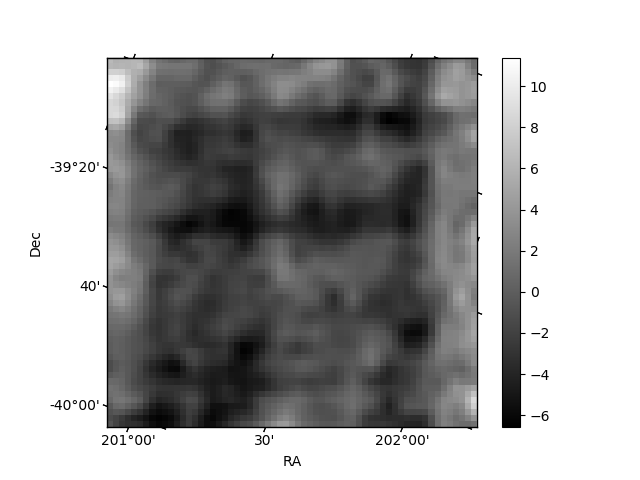
Histogram calculated using DETX and DETY for each event in the final _common_clean file
| Quadrant A | 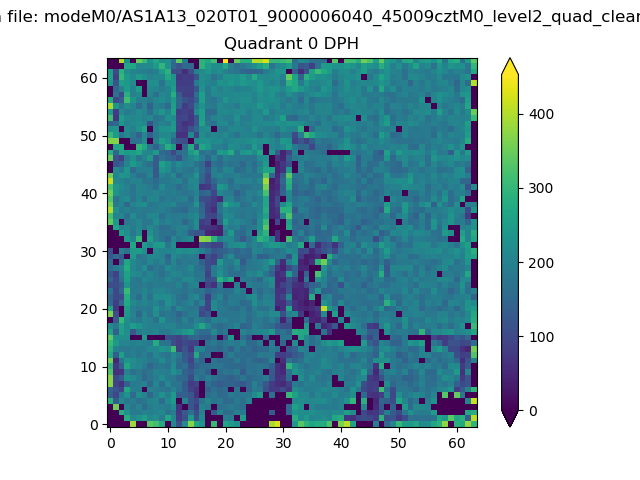 |
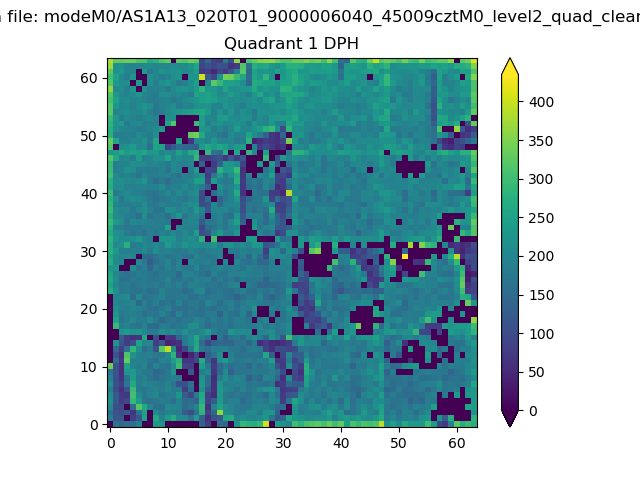 |
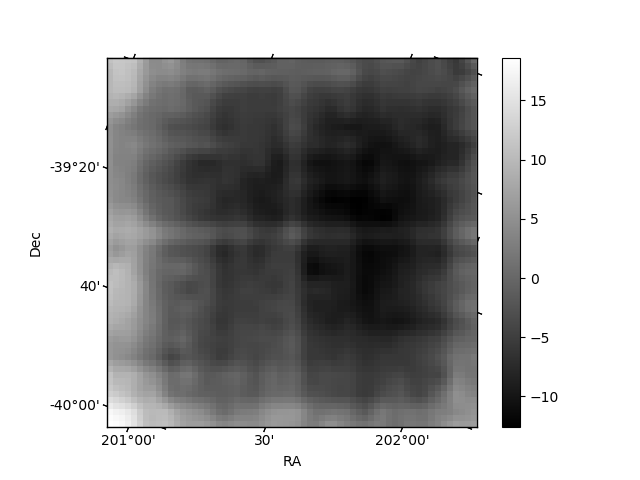
Quadrant B |
|---|---|---|---|
| Quadrant D | 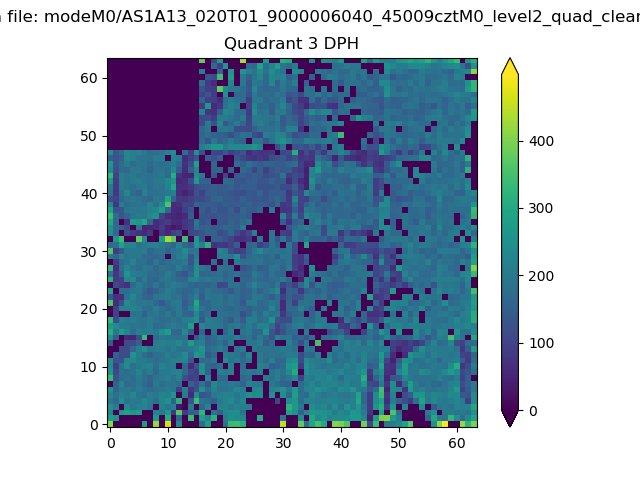 |
 |
Quadrant C |
| Plot type | Count rate plots | Images |
|---|---|---|
| Comparison with Poisson distribution Blue bars denote a histogram of data divided into 1 sec bins. Red curve is a Poisson curve with rate = median count rate of data. |
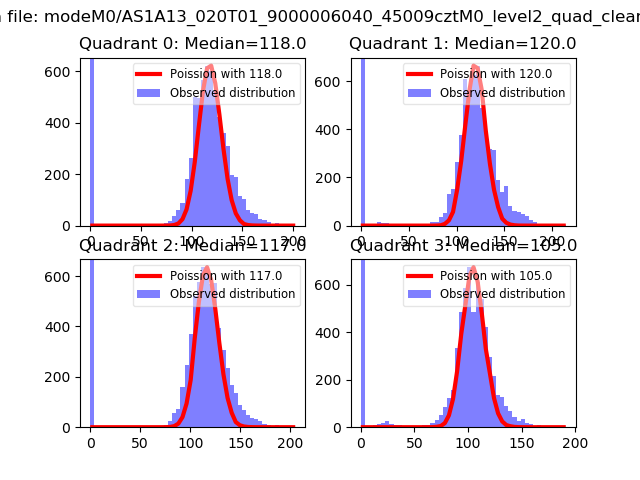 |
 |
| Quadrant-wise count rates Data is divided into 100 sec bins |
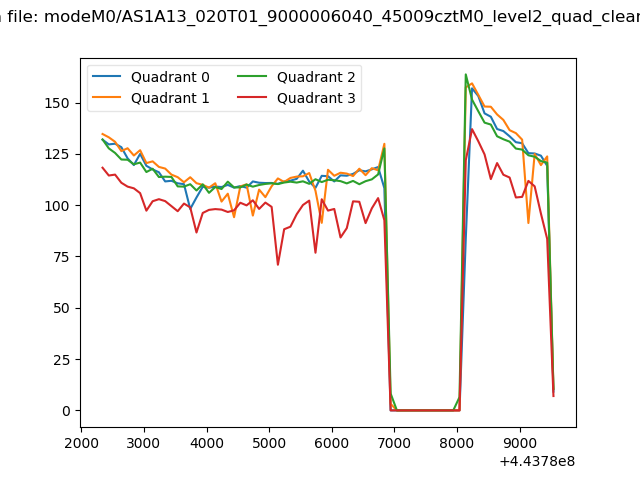 |
|
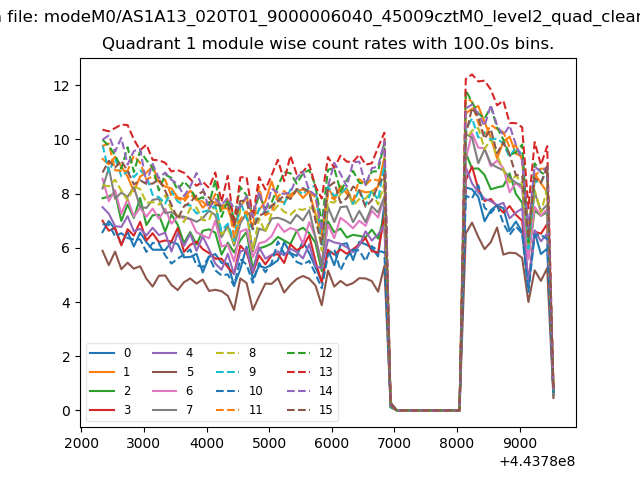
| Module-wise count rates for Quadrant A Data is divided into 100 sec bins |
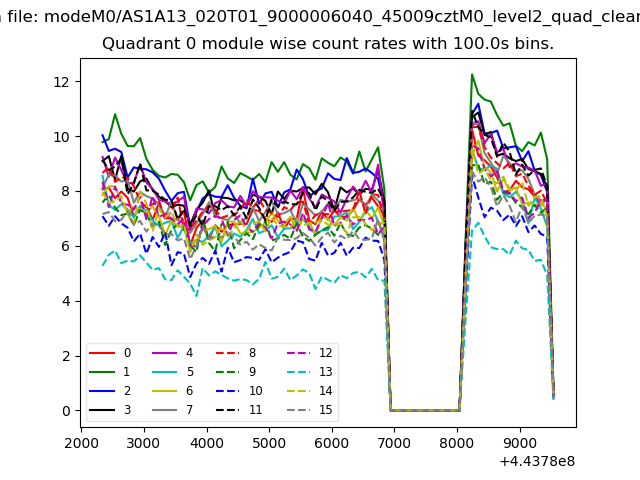 |
 |
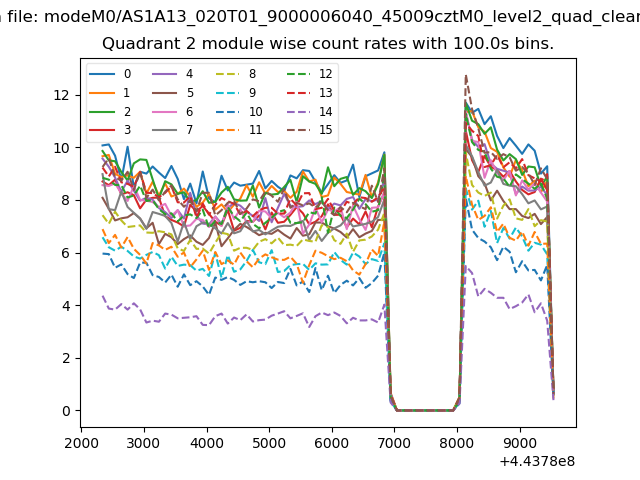
| Module-wise count rates for Quadrant B Data is divided into 100 sec bins |
 |
 |
| Module-wise count rates for Quadrant C Data is divided into 100 sec bins |
 |
 |
| Module-wise count rates for Quadrant D Data is divided into 100 sec bins |
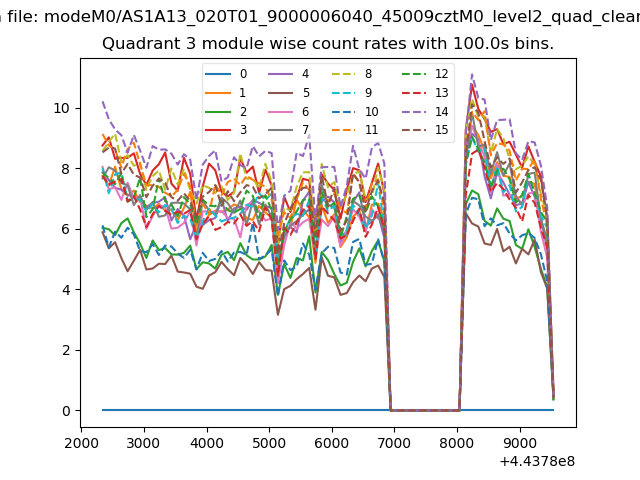 |
 |
| Parameter | Plot |
|---|---|
| CZT HV Monitor | 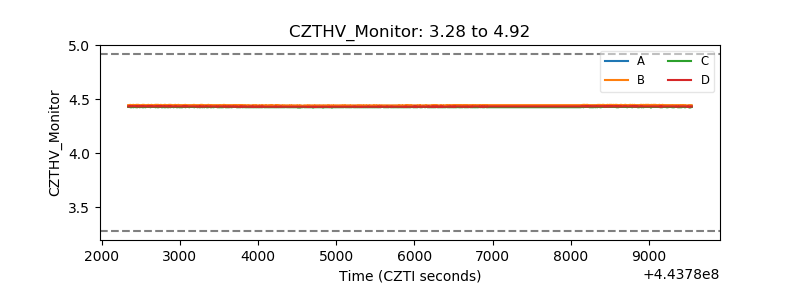 |
| D_VDD | 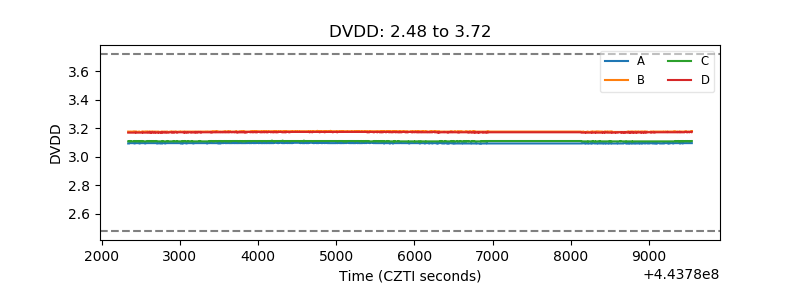 |
| Temperature 1 | 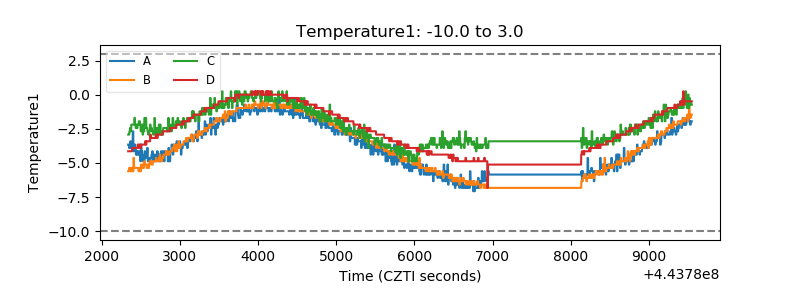 |
| Veto HV Monitor | 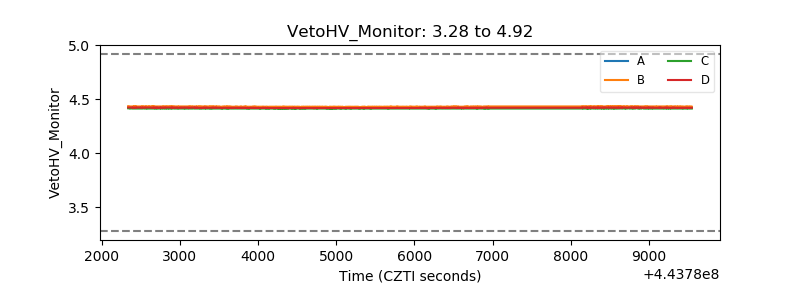 |
| Veto LLD | 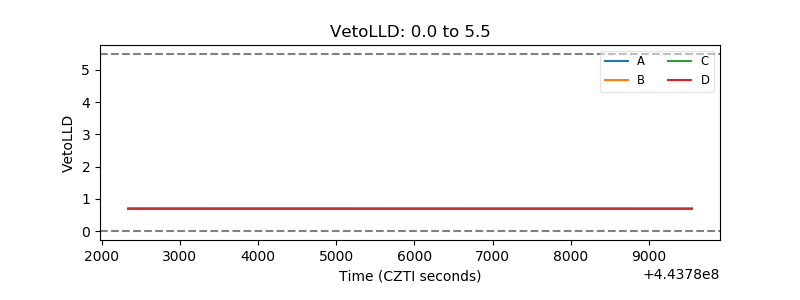 |
| Alpha Counter | 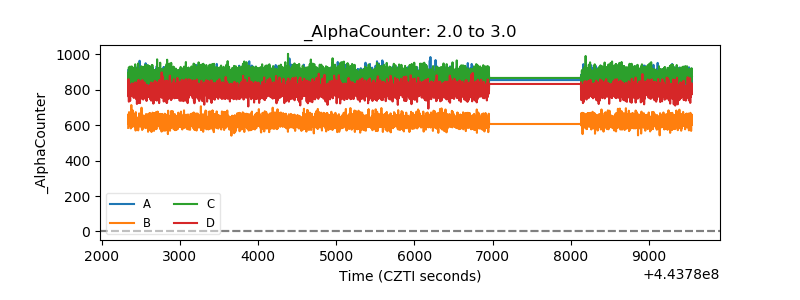 |
| _CPM_Rate | 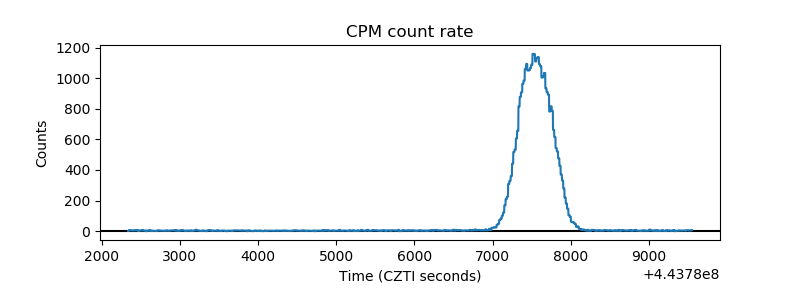 |
| CZT Counter | 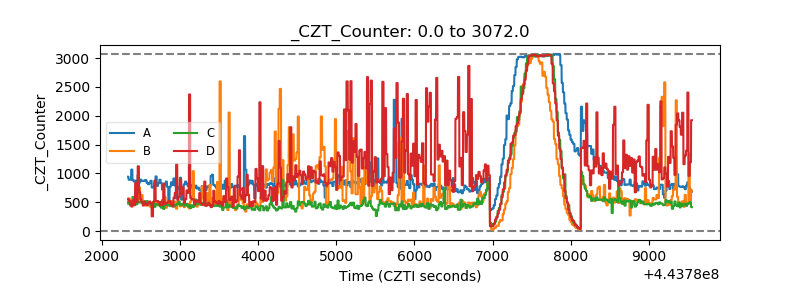 |
| +2.5 Volts monitor | 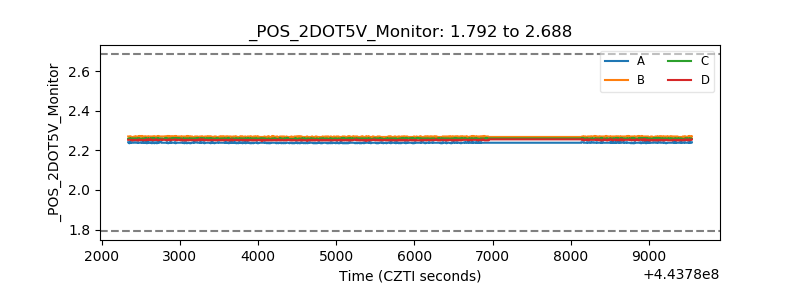 |
| +5 Volts monitor | 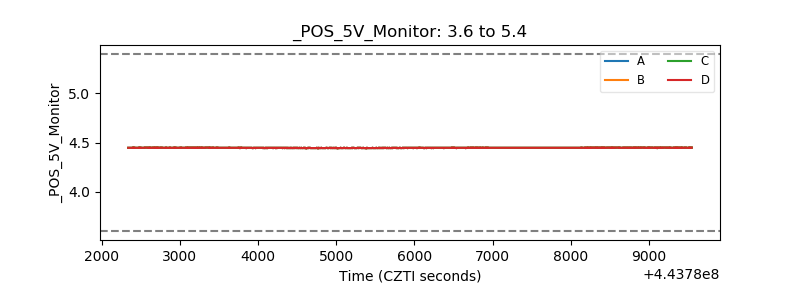 |
| _ROLL_ROT | 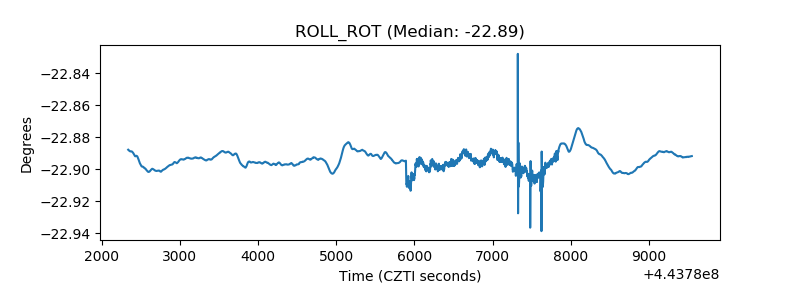 |
| _Roll_DEC | 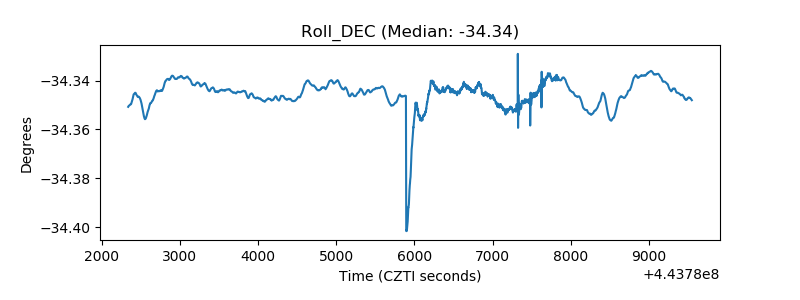 |
| _Roll_RA | 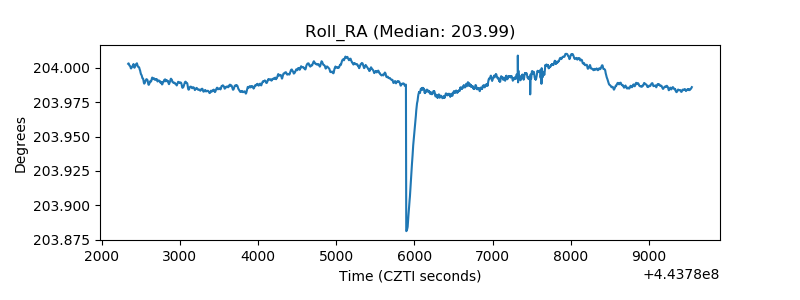 |
| Veto Counter | 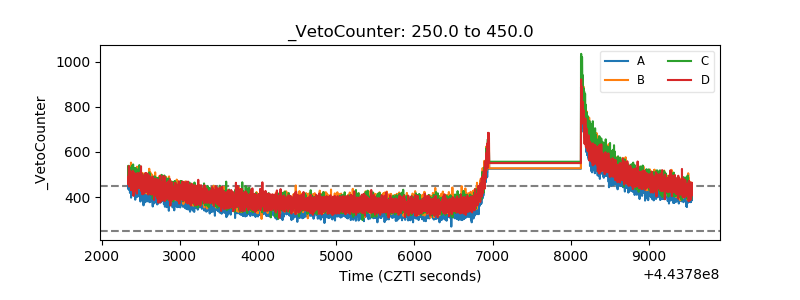 |