| Param | Original file | Final file |
|---|---|---|
| Filename | modeM0/AS1A13_020T01_9000006040_45010cztM0_level2.fits | modeM0/AS1A13_020T01_9000006040_45010cztM0_level2_quad_clean.evt |
| Size (bytes) | 616,443,840 | 120,407,040 |
| Size | 587.9 MB | 114.8 MB |
| Events in quadrant A | 5,946,792 | 822,841 |
| Events in quadrant B | 4,313,607 | 843,616 |
| Events in quadrant C | 3,368,329 | 828,024 |
| Events in quadrant D | 8,664,464 | 678,081 |
| Mode SS | |||
|---|---|---|---|
| Quadrant | BADHDUFLAG | Total packets | Discarded packets |
| A | 0 | 138 | 0 |
| B | 0 | 138 | 0 |
| C | 0 | 138 | 0 |
| D | 0 | 138 | 0 |
| Mode M9 | |||
|---|---|---|---|
| Quadrant | BADHDUFLAG | Total packets | Discarded packets |
| A | 0 | 13 | 0 |
| B | 0 | 14 | 0 |
| C | 0 | 14 | 0 |
| D | 0 | 14 | 0 |
| Mode M0 | |||
|---|---|---|---|
| Quadrant | BADHDUFLAG | Total packets | Discarded packets |
| A | 0 | 21957 | 2 |
| B | 0 | 17177 | 2 |
| C | 0 | 14396 | 2 |
| D | 0 | 30589 | 2 |
| Quadrant | Total seconds | Saturated seconds | Saturation percentage |
|---|---|---|---|
| A | 6794 | 256 | 3.768031% |
| B | 6794 | 283 | 4.165440% |
| C | 6794 | 84 | 1.236385% |
| D | 6794 | 1007 | 14.821902% |
Noise dominated data is calculated using 1-second bins in cleaned event files. If a bin has >2000 counts, and if more than 50% of those come from <1% of pixels, then it is considered to be noise-dominated and hence unusable.
| Quadrant | # 1 sec bins | Bins with >0 counts | Bins with >2000 counts | High rate bins dominated by noise | Noise dominated (total time) | Noise dominated (detector-on time) | Marked lightcurve |
|---|---|---|---|---|---|---|---|
| A | 7994 | 6795 | 5 | 5 | 0.06% | 0.07% | 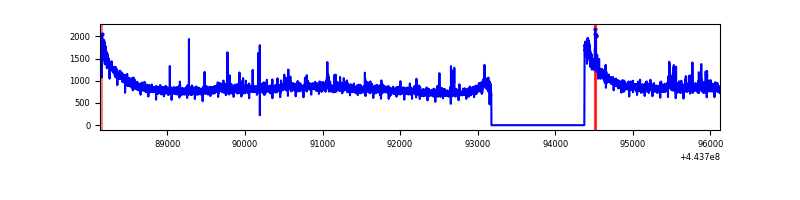 |
| B | 7994 | 6795 | 86 | 86 | 1.08% | 1.27% | 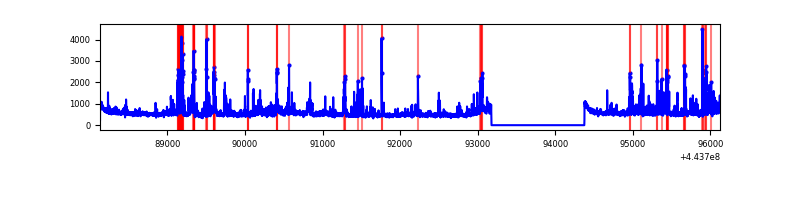 |
| C | 7994 | 6795 | 9 | 9 | 0.11% | 0.13% | 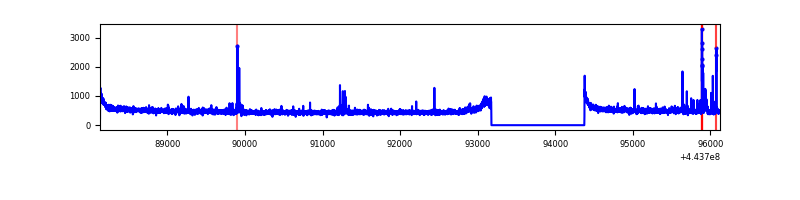 |
| D | 7994 | 6795 | 823 | 823 | 10.30% | 12.11% | 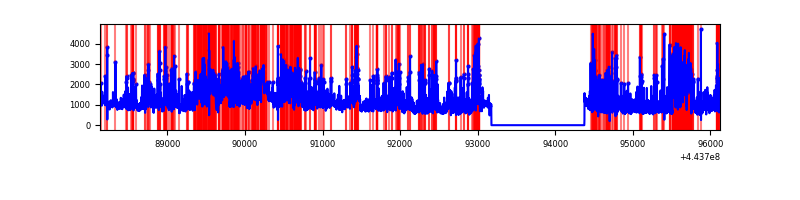 |
Top three noisy pixels from each quadrant. If the there are fewer than three noisy pixels in the level2.evt file, extra rows are filled as -1
| Pixel properties | Quadrant properties | ||||||
|---|---|---|---|---|---|---|---|
| Quadrant | DetID | PixID | Counts | Sigma | Mean | Median | Sigma |
| A | 10 | 83 | 2582360 | 14968.52 | 839 | 821 | 172.5 |
| A | 13 | 248 | 99993 | 575.03 | 839 | 821 | 172.5 |
| A | 0 | 243 | 17781 | 98.34 | 839 | 821 | 172.5 |
| B | 5 | 172 | 168720 | 1043.47 | 828 | 805 | 160.9 |
| B | 5 | 255 | 149976 | 926.99 | 828 | 805 | 160.9 |
| B | 0 | 183 | 141635 | 875.16 | 828 | 805 | 160.9 |
| C | 15 | 208 | 74470 | 380.31 | 829 | 834 | 193.6 |
| C | 3 | 233 | 23101 | 115.0 | 829 | 834 | 193.6 |
| C | 12 | 2 | 18072 | 89.03 | 829 | 834 | 193.6 |
| D | 11 | 241 | 2191854 | 10939.89 | 794 | 770 | 200.3 |
| D | 12 | 33 | 680190 | 3392.28 | 794 | 770 | 200.3 |
| D | 13 | 249 | 568160 | 2832.93 | 794 | 770 | 200.3 |
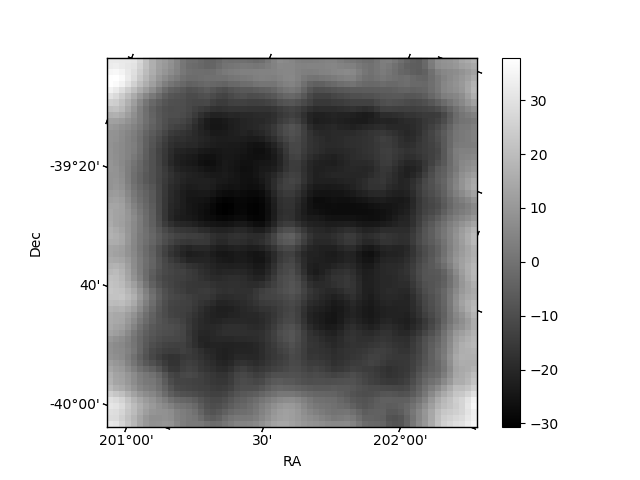
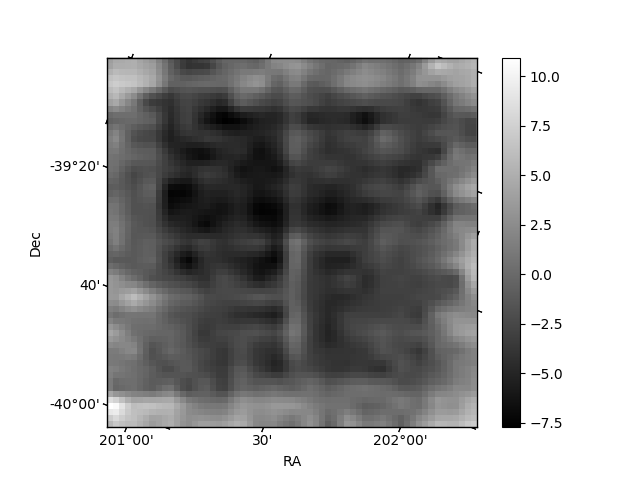
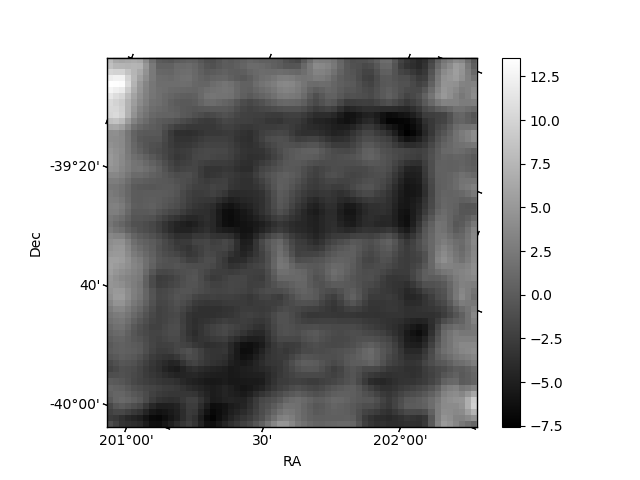
Histogram calculated using DETX and DETY for each event in the final _common_clean file
| Quadrant A | 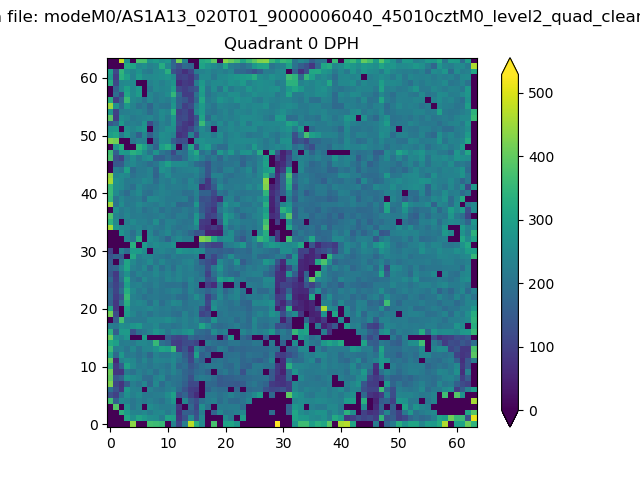 |
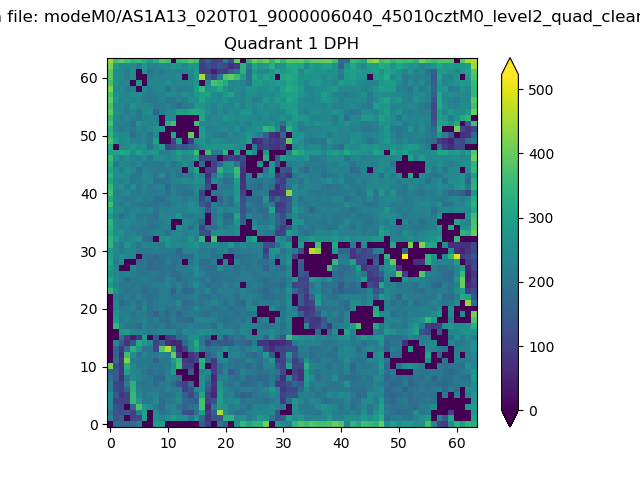 |
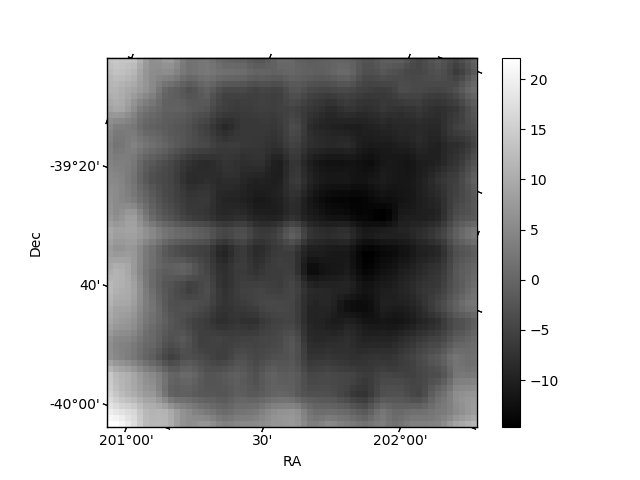
Quadrant B |
|---|---|---|---|
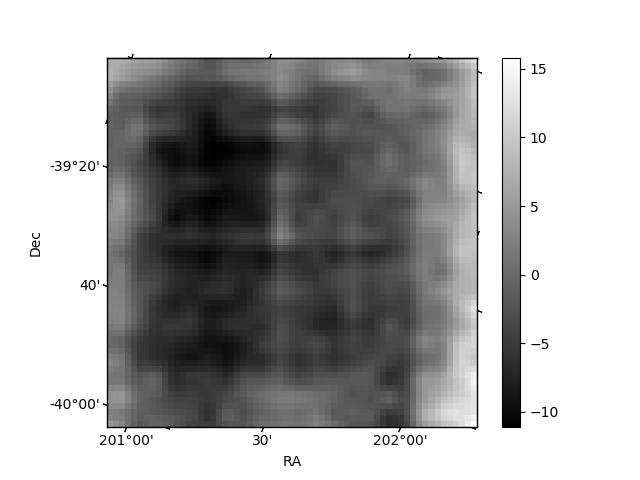
| Quadrant D | 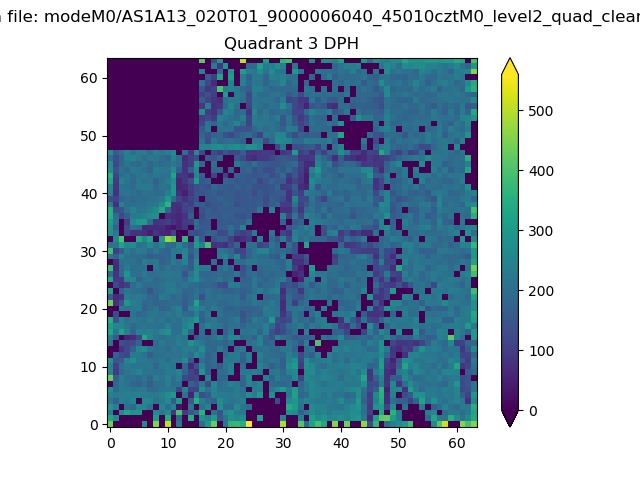 |
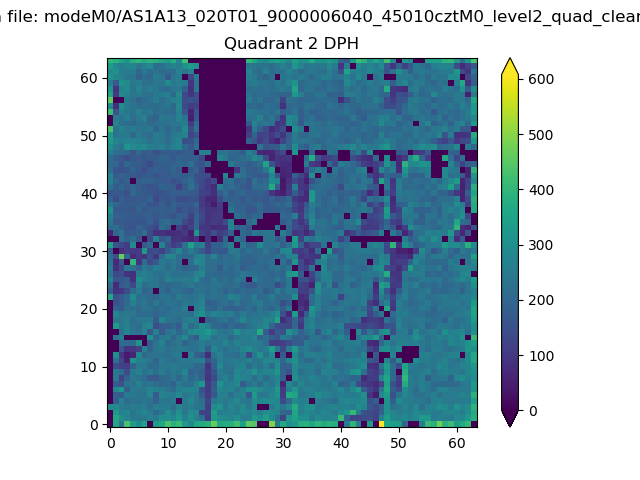 |
Quadrant C |
| Plot type | Count rate plots | Images |
|---|---|---|
| Comparison with Poisson distribution Blue bars denote a histogram of data divided into 1 sec bins. Red curve is a Poisson curve with rate = median count rate of data. |
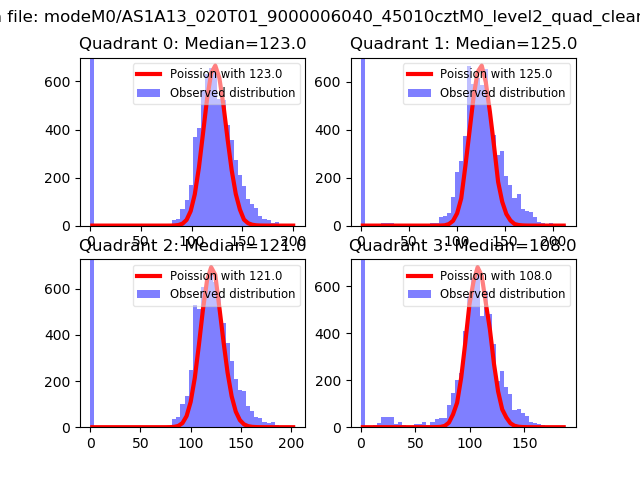 |
 |
| Quadrant-wise count rates Data is divided into 100 sec bins |
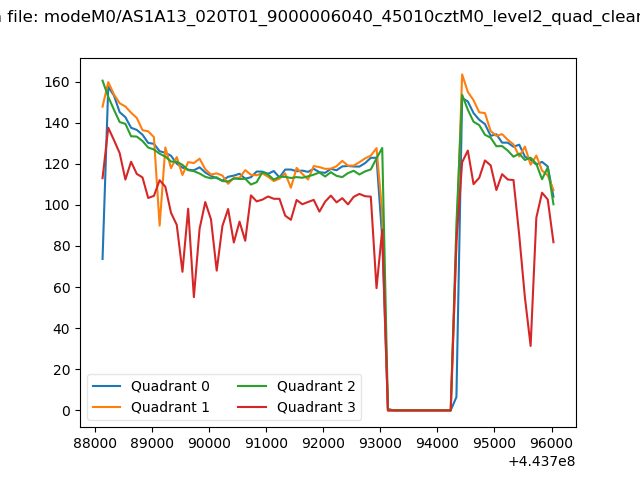 |
|
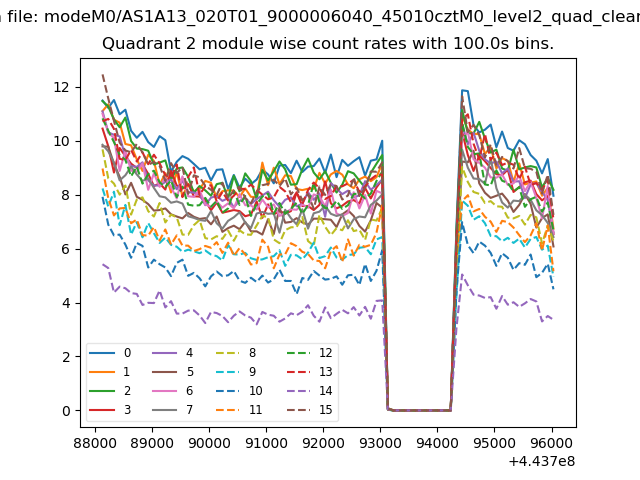
| Module-wise count rates for Quadrant A Data is divided into 100 sec bins |
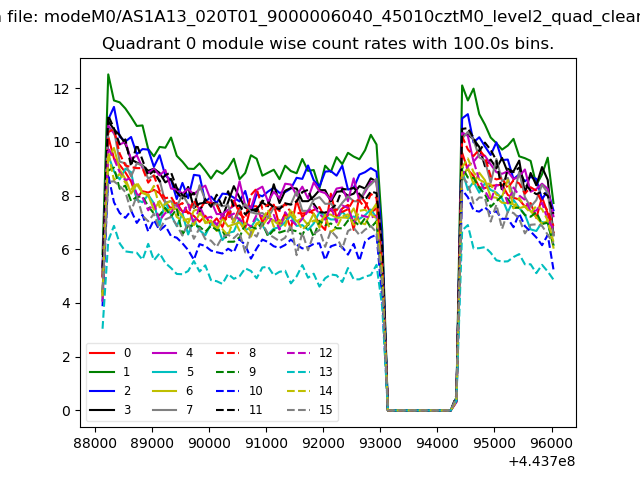 |
 |
| Module-wise count rates for Quadrant B Data is divided into 100 sec bins |
 |
 |
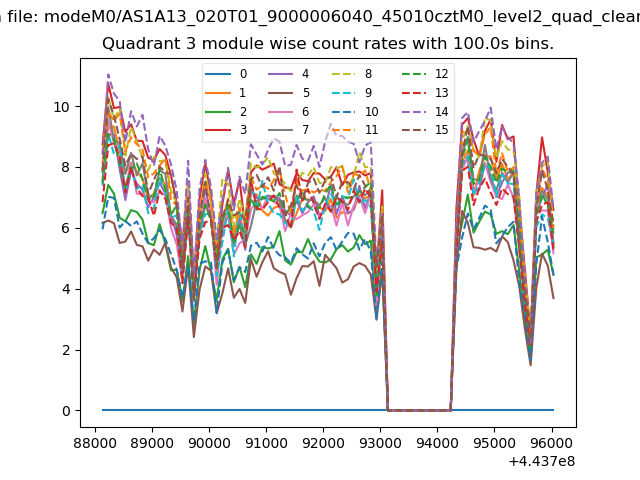
| Module-wise count rates for Quadrant C Data is divided into 100 sec bins |
 |
 |
| Module-wise count rates for Quadrant D Data is divided into 100 sec bins |
 |
 |
| Parameter | Plot |
|---|---|
| CZT HV Monitor | 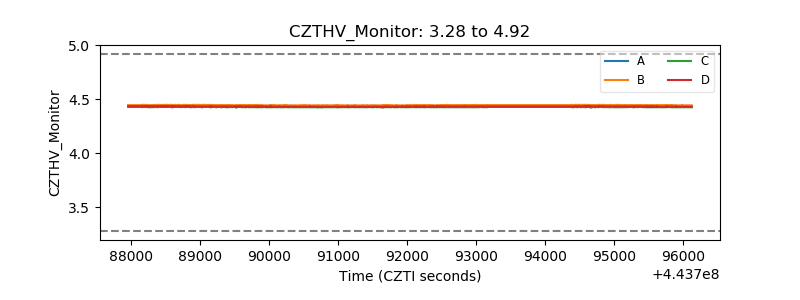 |
| D_VDD | 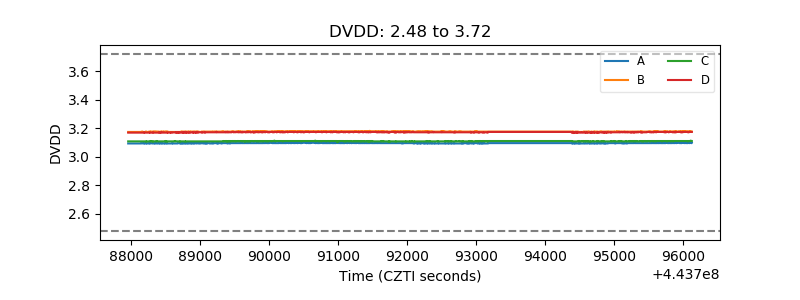 |
| Temperature 1 | 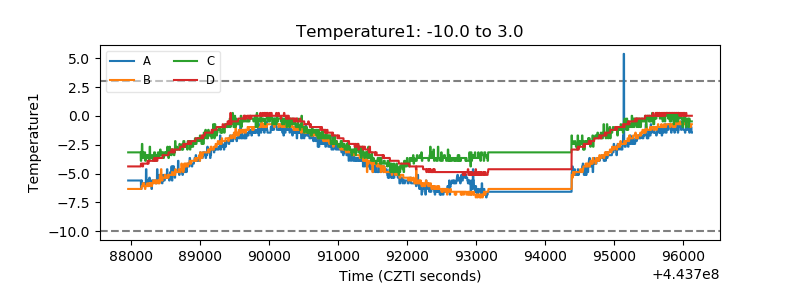 |
| Veto HV Monitor | 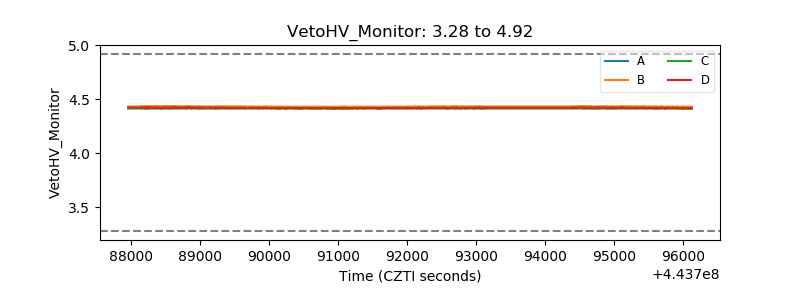 |
| Veto LLD | 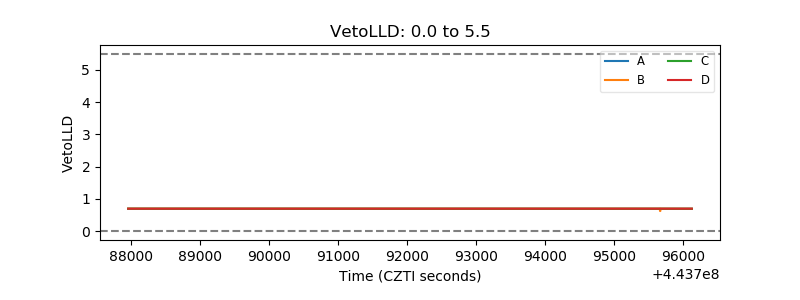 |
| Alpha Counter | 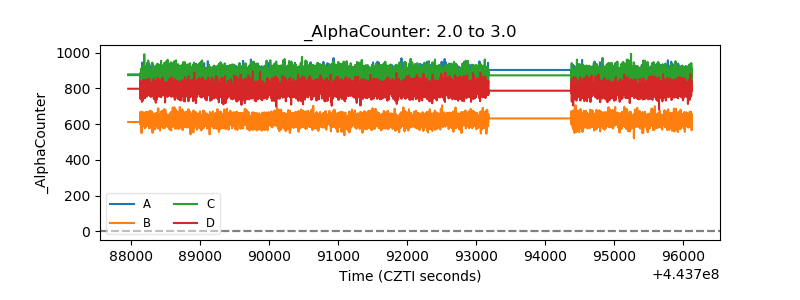 |
| _CPM_Rate | 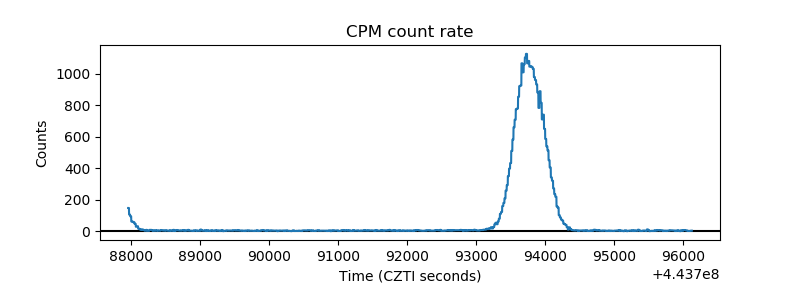 |
| CZT Counter | 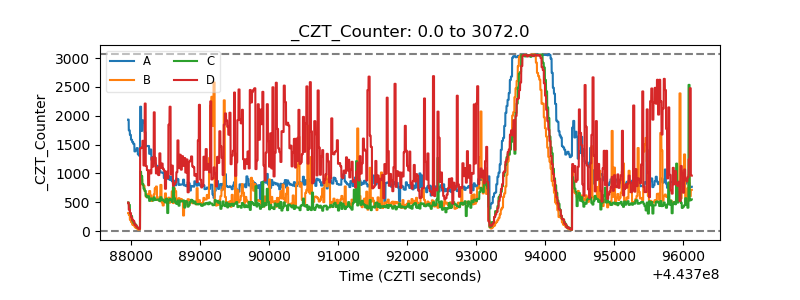 |
| +2.5 Volts monitor | 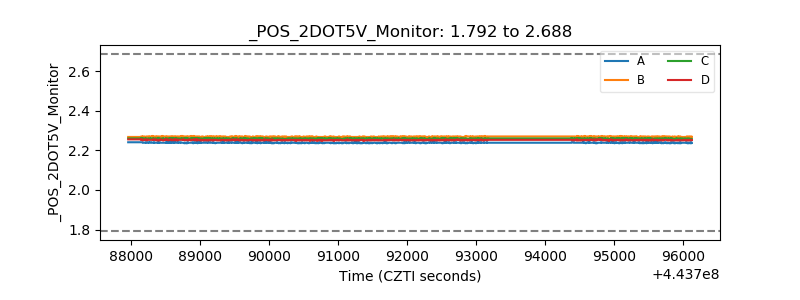 |
| +5 Volts monitor | 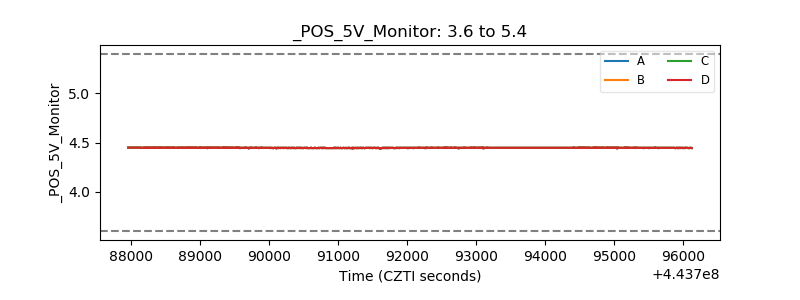 |
| _ROLL_ROT | 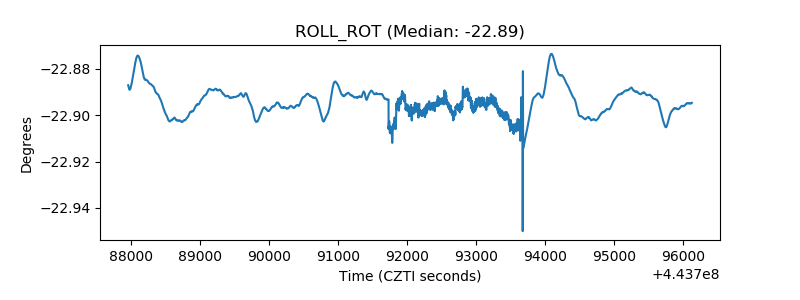 |
| _Roll_DEC | 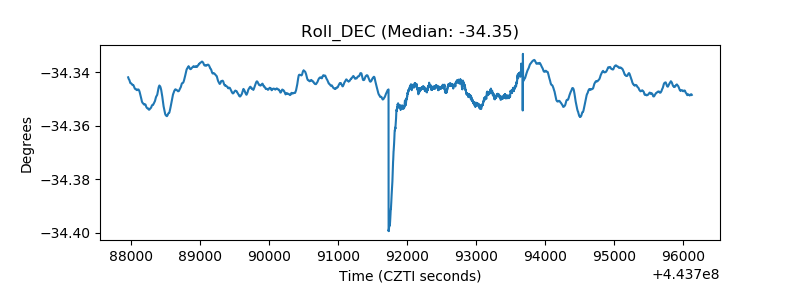 |
| _Roll_RA | 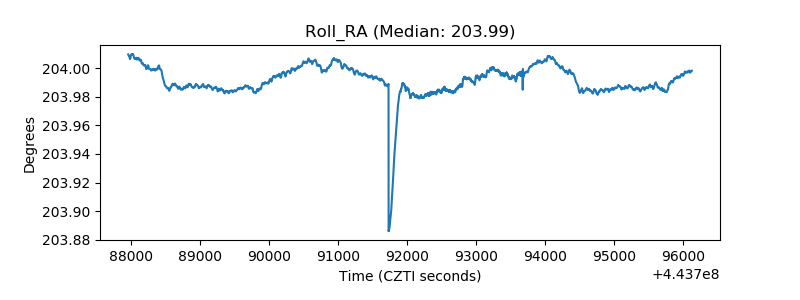 |
| Veto Counter | 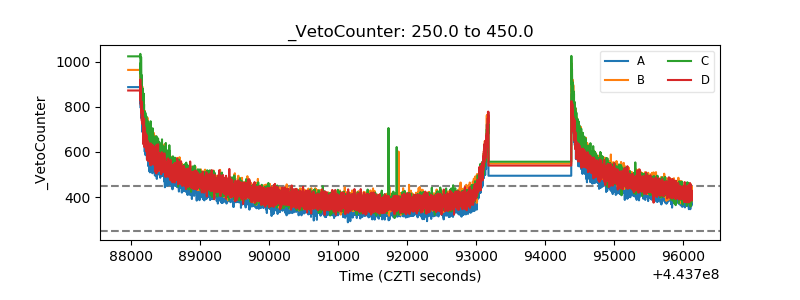 |