| Param | Original file | Final file |
|---|---|---|
| Filename | modeM0/AS1A13_020T01_9000006040_45012cztM0_level2.fits | modeM0/AS1A13_020T01_9000006040_45012cztM0_level2_quad_clean.evt |
| Size (bytes) | 583,346,880 | 112,893,120 |
| Size | 556.3 MB | 107.7 MB |
| Events in quadrant A | 6,379,054 | 737,088 |
| Events in quadrant B | 4,096,525 | 798,695 |
| Events in quadrant C | 3,299,461 | 781,435 |
| Events in quadrant D | 7,291,560 | 626,665 |
| Mode SS | |||
|---|---|---|---|
| Quadrant | BADHDUFLAG | Total packets | Discarded packets |
| A | 0 | 140 | 0 |
| B | 0 | 140 | 0 |
| C | 0 | 140 | 0 |
| D | 0 | 140 | 0 |
| Mode M9 | |||
|---|---|---|---|
| Quadrant | BADHDUFLAG | Total packets | Discarded packets |
| A | 0 | 11 | 0 |
| B | 0 | 12 | 0 |
| C | 0 | 12 | 0 |
| D | 0 | 12 | 0 |
| Mode M0 | |||
|---|---|---|---|
| Quadrant | BADHDUFLAG | Total packets | Discarded packets |
| A | 0 | 23575 | 2 |
| B | 0 | 16649 | 2 |
| C | 0 | 14477 | 2 |
| D | 0 | 26435 | 2 |
| Quadrant | Total seconds | Saturated seconds | Saturation percentage |
|---|---|---|---|
| A | 6803 | 536 | 7.878877% |
| B | 6802 | 221 | 3.249044% |
| C | 6802 | 94 | 1.381946% |
| D | 6802 | 1026 | 15.083799% |
Noise dominated data is calculated using 1-second bins in cleaned event files. If a bin has >2000 counts, and if more than 50% of those come from <1% of pixels, then it is considered to be noise-dominated and hence unusable.
| Quadrant | # 1 sec bins | Bins with >0 counts | Bins with >2000 counts | High rate bins dominated by noise | Noise dominated (total time) | Noise dominated (detector-on time) | Marked lightcurve |
|---|---|---|---|---|---|---|---|
| A | 7873 | 6804 | 203 | 203 | 2.58% | 2.98% | 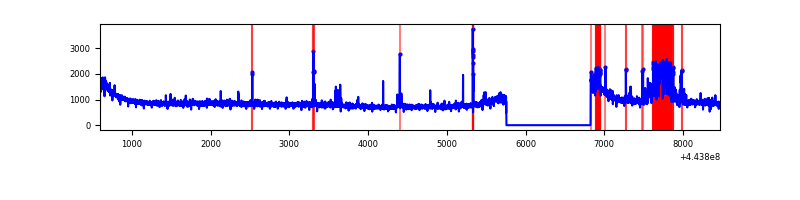 |
| B | 7872 | 6803 | 34 | 34 | 0.43% | 0.50% | 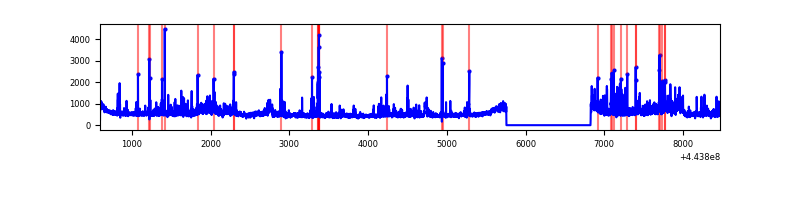 |
| C | 7872 | 6803 | 19 | 19 | 0.24% | 0.28% | 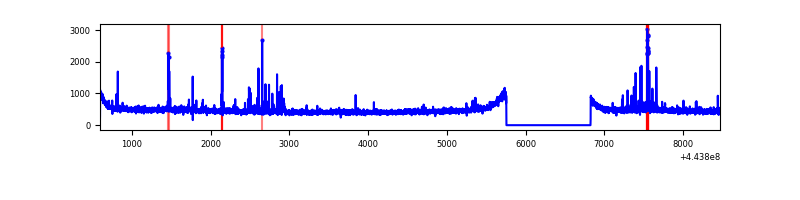 |
| D | 7872 | 6803 | 761 | 761 | 9.67% | 11.19% | 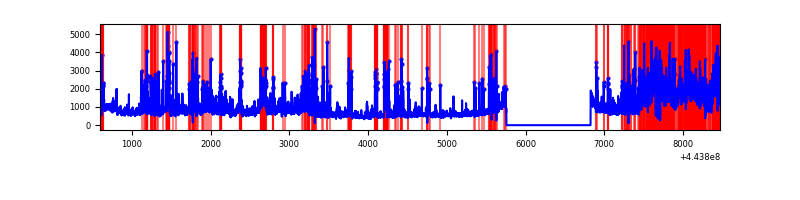 |
Top three noisy pixels from each quadrant. If the there are fewer than three noisy pixels in the level2.evt file, extra rows are filled as -1
| Pixel properties | Quadrant properties | ||||||
|---|---|---|---|---|---|---|---|
| Quadrant | DetID | PixID | Counts | Sigma | Mean | Median | Sigma |
| A | 10 | 83 | 2669045 | 15928.9 | 809 | 792 | 167.5 |
| A | 13 | 248 | 517188 | 3082.77 | 809 | 792 | 167.5 |
| A | 0 | 243 | 23346 | 134.64 | 809 | 792 | 167.5 |
| B | 0 | 189 | 180334 | 1117.63 | 816 | 793 | 160.6 |
| B | 0 | 183 | 154217 | 955.06 | 816 | 793 | 160.6 |
| B | 0 | 168 | 126181 | 780.53 | 816 | 793 | 160.6 |
| C | 12 | 2 | 63255 | 332.45 | 805 | 811 | 187.8 |
| C | 15 | 208 | 58264 | 305.87 | 805 | 811 | 187.8 |
| C | 14 | 254 | 28753 | 148.76 | 805 | 811 | 187.8 |
| D | 11 | 241 | 859224 | 4421.87 | 763 | 740 | 194.1 |
| D | 12 | 33 | 701851 | 3611.27 | 763 | 740 | 194.1 |
| D | 5 | 235 | 625779 | 3219.44 | 763 | 740 | 194.1 |
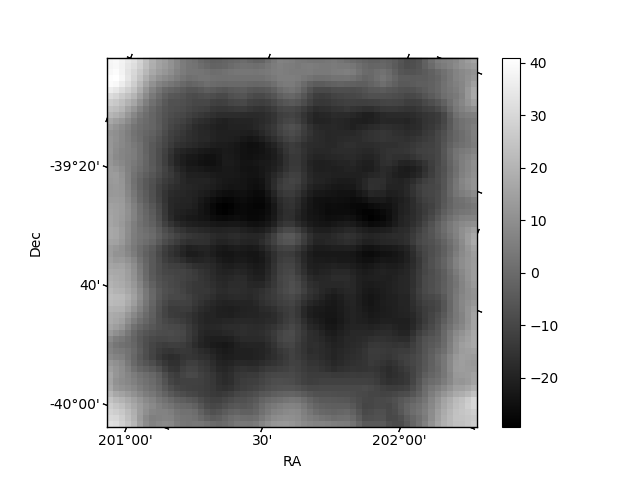
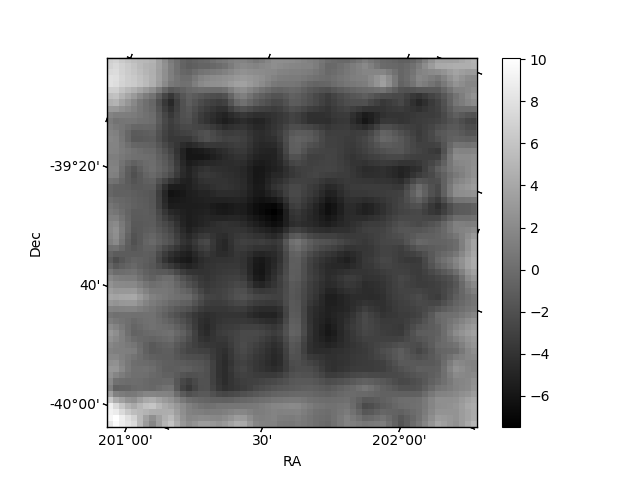
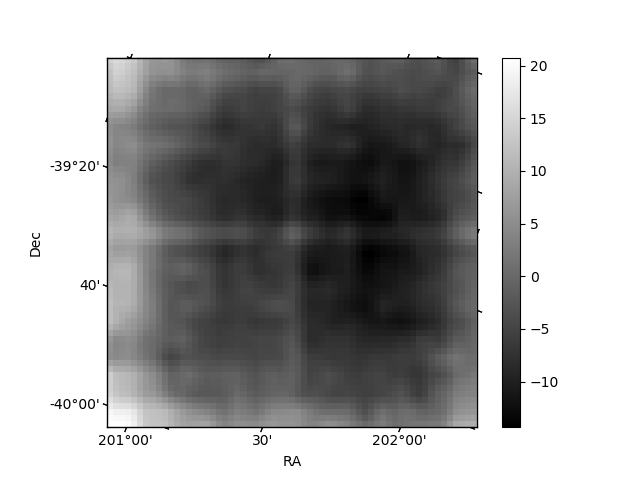
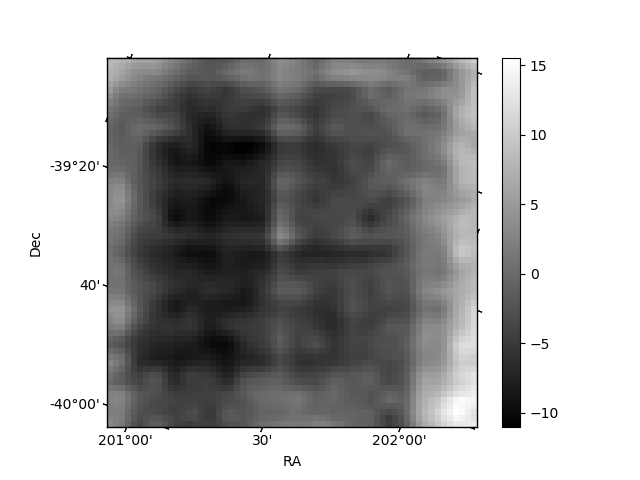
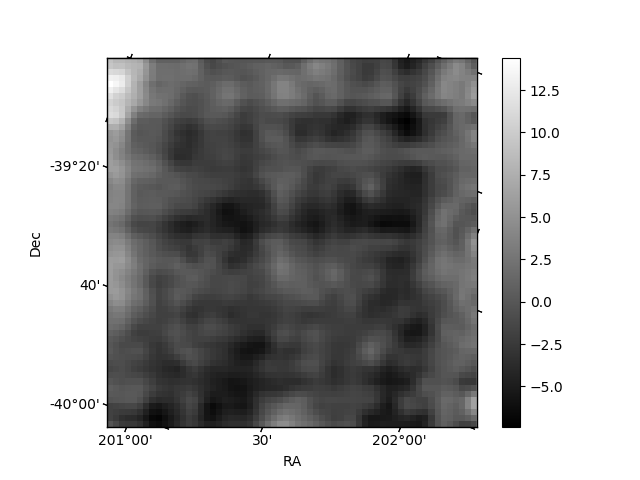
Histogram calculated using DETX and DETY for each event in the final _common_clean file
| Quadrant A | 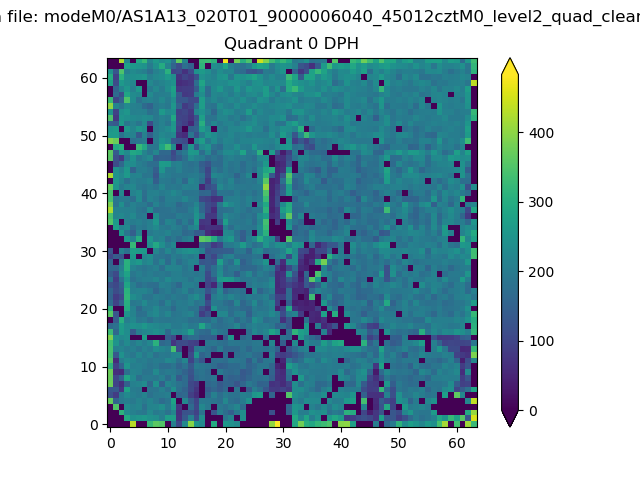 |
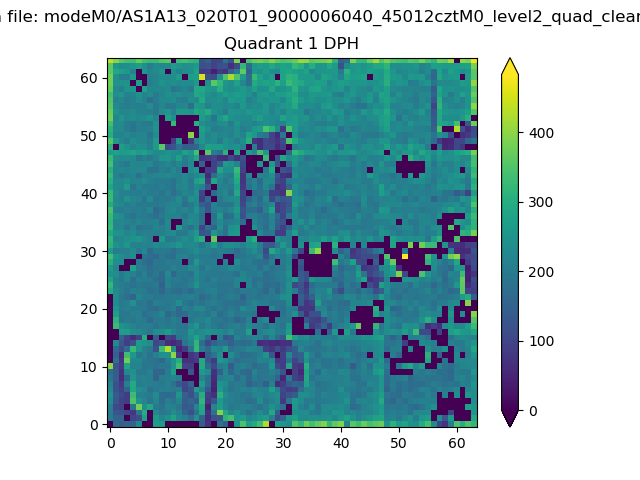 |
Quadrant B |
|---|---|---|---|
| Quadrant D | 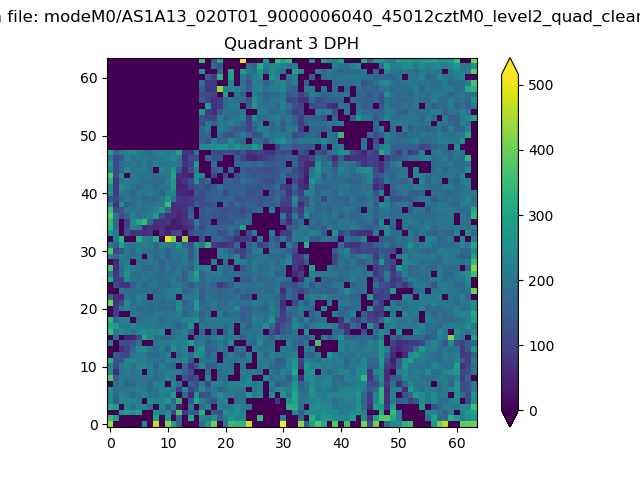 |
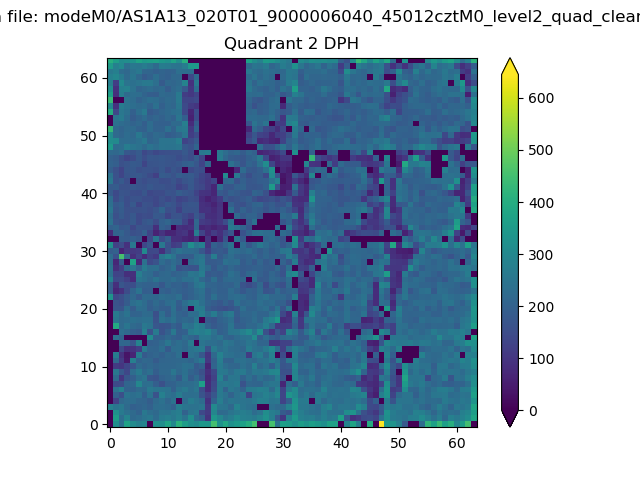 |
Quadrant C |
| Plot type | Count rate plots | Images |
|---|---|---|
| Comparison with Poisson distribution Blue bars denote a histogram of data divided into 1 sec bins. Red curve is a Poisson curve with rate = median count rate of data. |
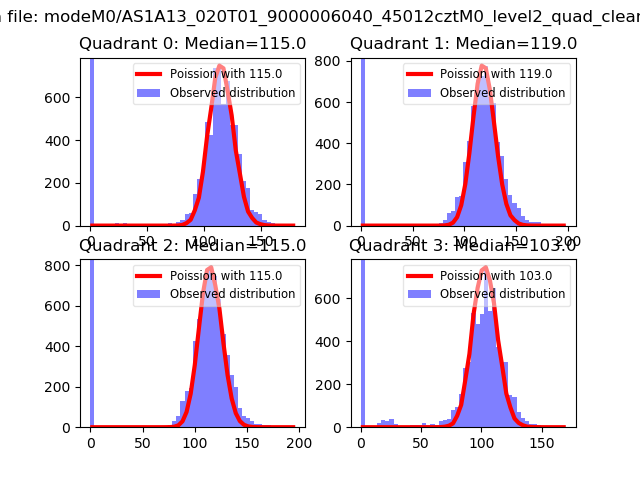 |
 |
| Quadrant-wise count rates Data is divided into 100 sec bins |
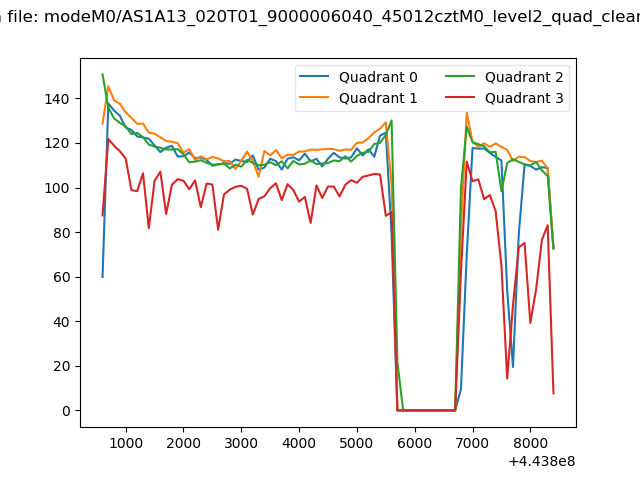 |
|
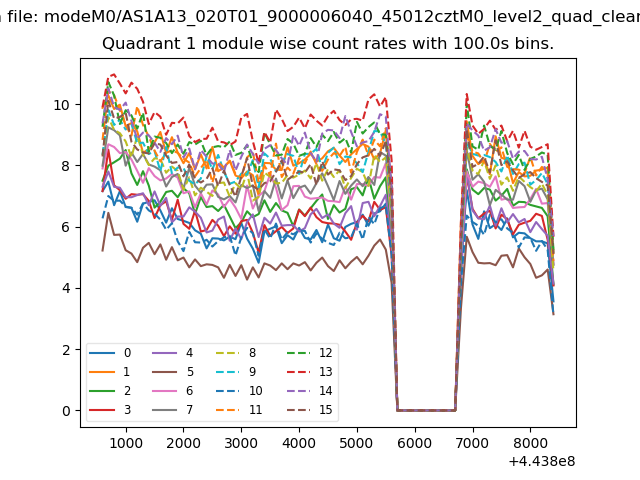
| Module-wise count rates for Quadrant A Data is divided into 100 sec bins |
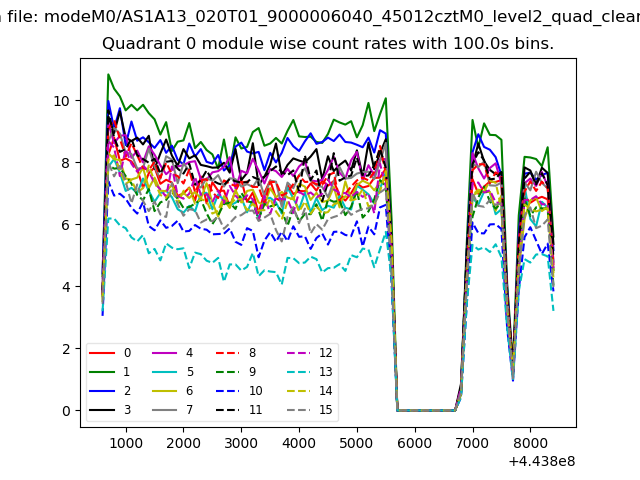 |
 |
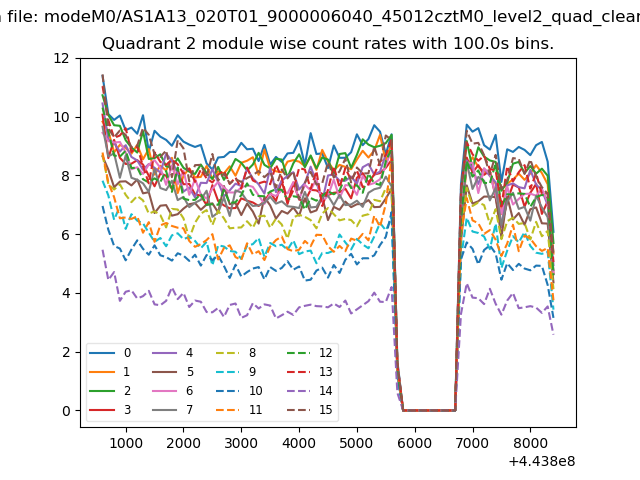
| Module-wise count rates for Quadrant B Data is divided into 100 sec bins |
 |
 |
| Module-wise count rates for Quadrant C Data is divided into 100 sec bins |
 |
 |
| Module-wise count rates for Quadrant D Data is divided into 100 sec bins |
 |
 |
| Parameter | Plot |
|---|---|
| CZT HV Monitor | 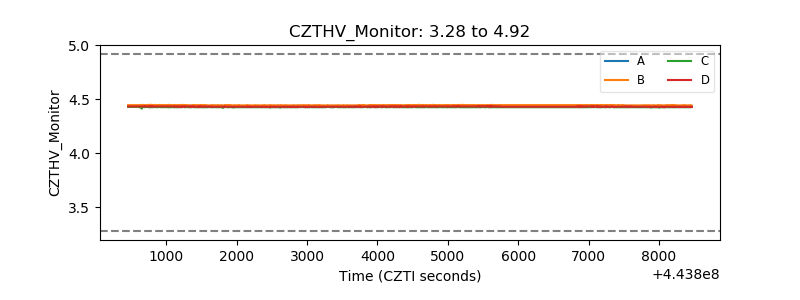 |
| D_VDD | 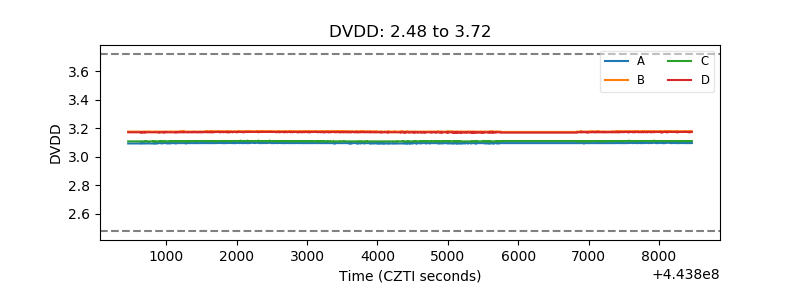 |
| Temperature 1 | 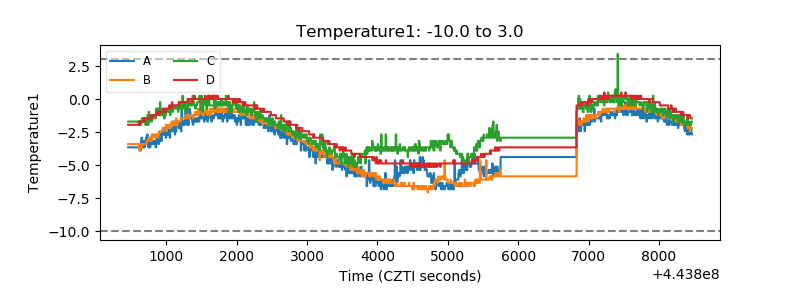 |
| Veto HV Monitor | 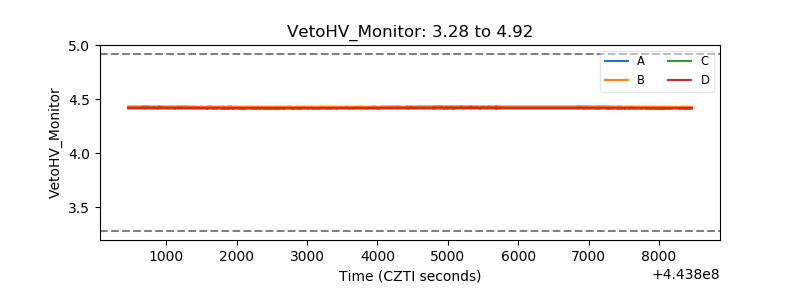 |
| Veto LLD | 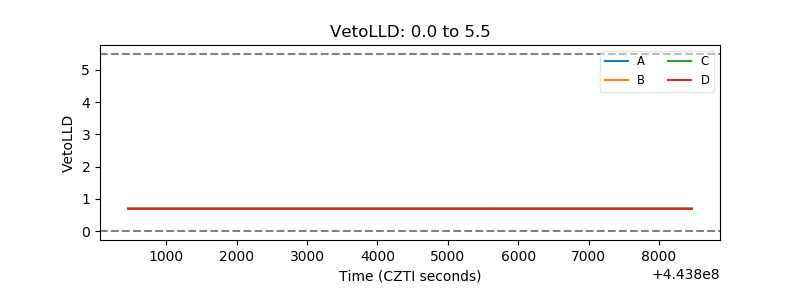 |
| Alpha Counter | 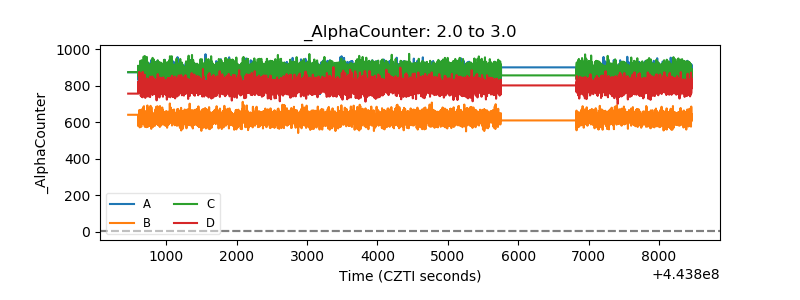 |
| _CPM_Rate | 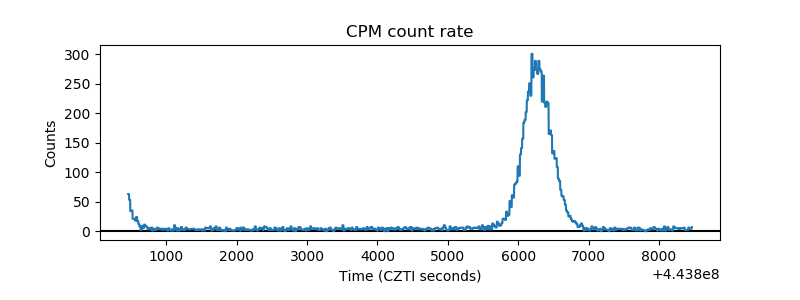 |
| CZT Counter | 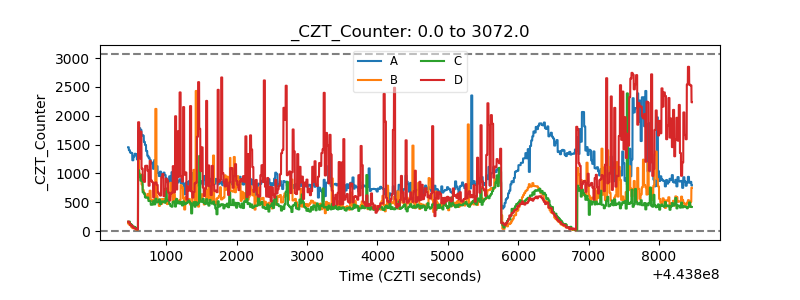 |
| +2.5 Volts monitor | 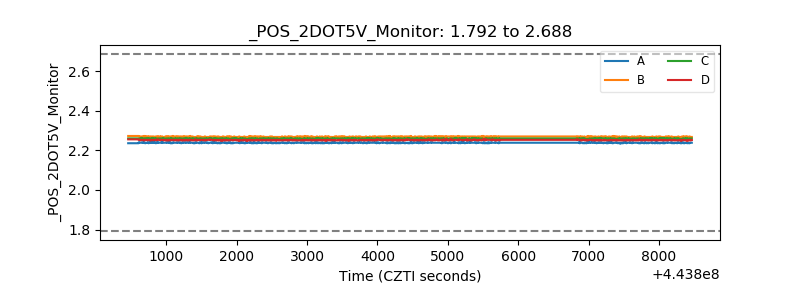 |
| +5 Volts monitor | 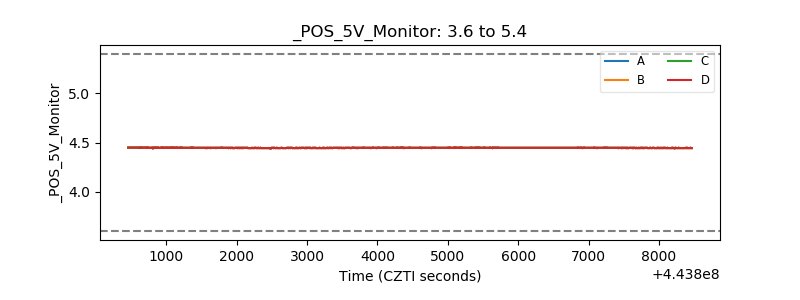 |
| _ROLL_ROT |  |
| _Roll_DEC | 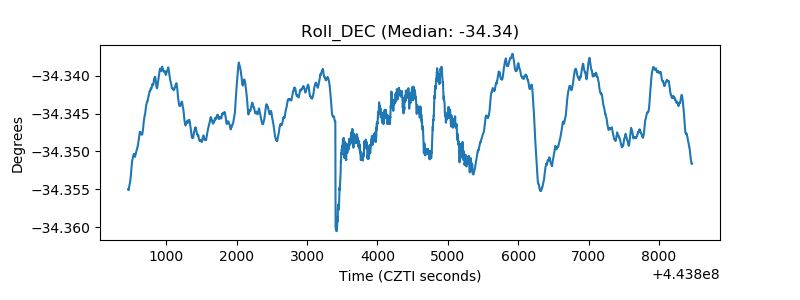 |
| _Roll_RA | 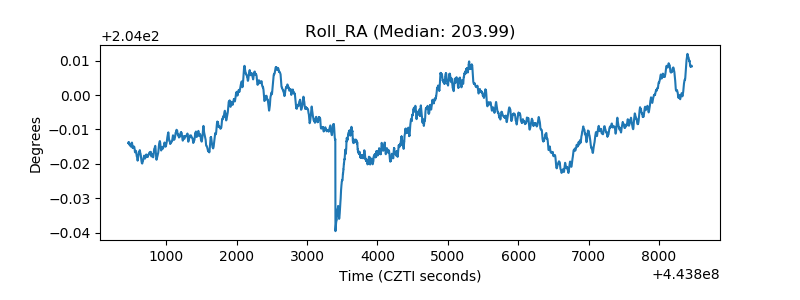 |
| Veto Counter | 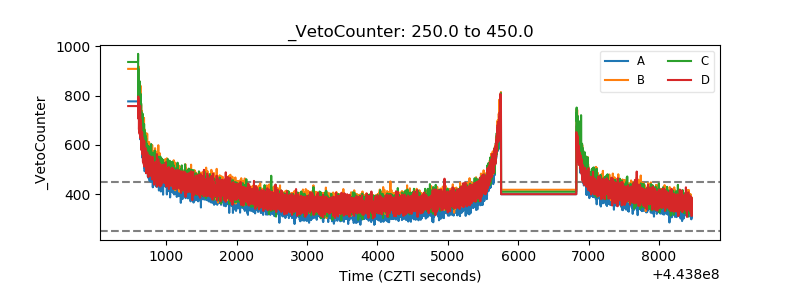 |