| Param | Original file | Final file |
|---|---|---|
| Filename | modeM0/AS1A13_020T01_9000006040_45014cztM0_level2.fits | modeM0/AS1A13_020T01_9000006040_45014cztM0_level2_quad_clean.evt |
| Size (bytes) | 600,580,800 | 109,226,880 |
| Size | 572.8 MB | 104.2 MB |
| Events in quadrant A | 5,851,653 | 738,741 |
| Events in quadrant B | 4,440,541 | 741,686 |
| Events in quadrant C | 4,045,325 | 719,476 |
| Events in quadrant D | 7,350,366 | 618,204 |
| Mode SS | |||
|---|---|---|---|
| Quadrant | BADHDUFLAG | Total packets | Discarded packets |
| A | 0 | 146 | 0 |
| B | 0 | 146 | 0 |
| C | 0 | 146 | 0 |
| D | 0 | 146 | 0 |
| Mode M9 | |||
|---|---|---|---|
| Quadrant | BADHDUFLAG | Total packets | Discarded packets |
| A | 0 | 2 | 0 |
| B | 0 | 2 | 0 |
| C | 0 | 2 | 0 |
| D | 0 | 2 | 0 |
| Mode M0 | |||
|---|---|---|---|
| Quadrant | BADHDUFLAG | Total packets | Discarded packets |
| A | 0 | 22418 | 1 |
| B | 0 | 17890 | 1 |
| C | 0 | 17098 | 1 |
| D | 0 | 26842 | 1 |
| Quadrant | Total seconds | Saturated seconds | Saturation percentage |
|---|---|---|---|
| A | 7014 | 330 | 4.704876% |
| B | 7015 | 461 | 6.571632% |
| C | 7015 | 413 | 5.887384% |
| D | 7015 | 930 | 13.257306% |
Noise dominated data is calculated using 1-second bins in cleaned event files. If a bin has >2000 counts, and if more than 50% of those come from <1% of pixels, then it is considered to be noise-dominated and hence unusable.
| Quadrant | # 1 sec bins | Bins with >0 counts | Bins with >2000 counts | High rate bins dominated by noise | Noise dominated (total time) | Noise dominated (detector-on time) | Marked lightcurve |
|---|---|---|---|---|---|---|---|
| A | 7214 | 7016 | 37 | 37 | 0.51% | 0.53% | 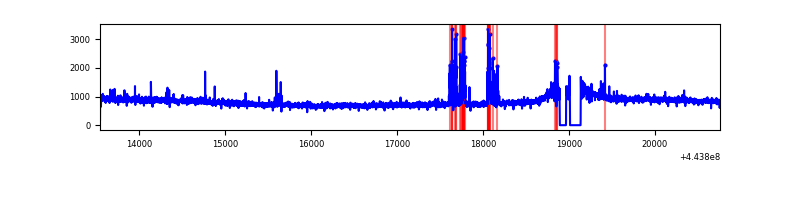 |
| B | 7215 | 7017 | 181 | 181 | 2.51% | 2.58% | 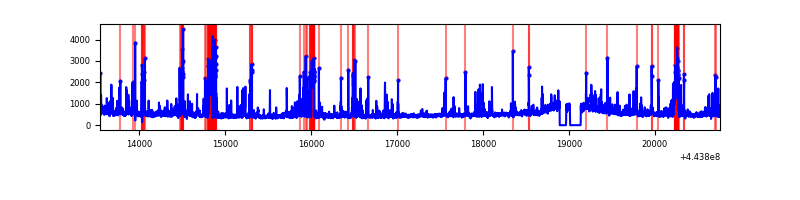 |
| C | 7215 | 7017 | 230 | 230 | 3.19% | 3.28% | 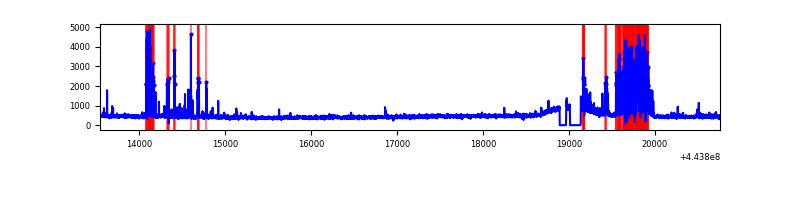 |
| D | 7215 | 7017 | 583 | 583 | 8.08% | 8.31% | 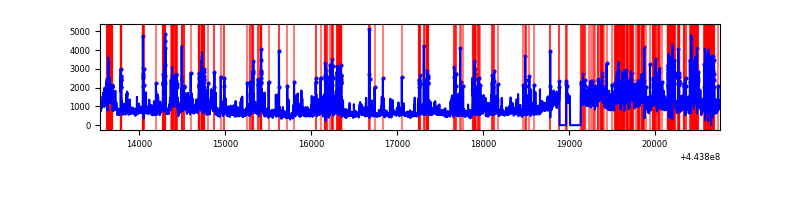 |
Top three noisy pixels from each quadrant. If the there are fewer than three noisy pixels in the level2.evt file, extra rows are filled as -1
| Pixel properties | Quadrant properties | ||||||
|---|---|---|---|---|---|---|---|
| Quadrant | DetID | PixID | Counts | Sigma | Mean | Median | Sigma |
| A | 10 | 83 | 2490126 | 14798.81 | 804 | 783 | 168.2 |
| A | 13 | 248 | 208526 | 1235.0 | 804 | 783 | 168.2 |
| A | 0 | 243 | 32196 | 186.75 | 804 | 783 | 168.2 |
| B | 0 | 189 | 645321 | 4084.05 | 796 | 770 | 157.8 |
| B | 4 | 171 | 146125 | 921.01 | 796 | 770 | 157.8 |
| B | 5 | 255 | 110342 | 694.28 | 796 | 770 | 157.8 |
| C | 14 | 254 | 688750 | 3767.9 | 775 | 780 | 182.6 |
| C | 12 | 2 | 240421 | 1312.47 | 775 | 780 | 182.6 |
| C | 15 | 208 | 47833 | 257.7 | 775 | 780 | 182.6 |
| D | 11 | 241 | 895884 | 4667.4 | 754 | 728 | 191.8 |
| D | 5 | 235 | 621877 | 3238.71 | 754 | 728 | 191.8 |
| D | 1 | 52 | 594421 | 3095.55 | 754 | 728 | 191.8 |
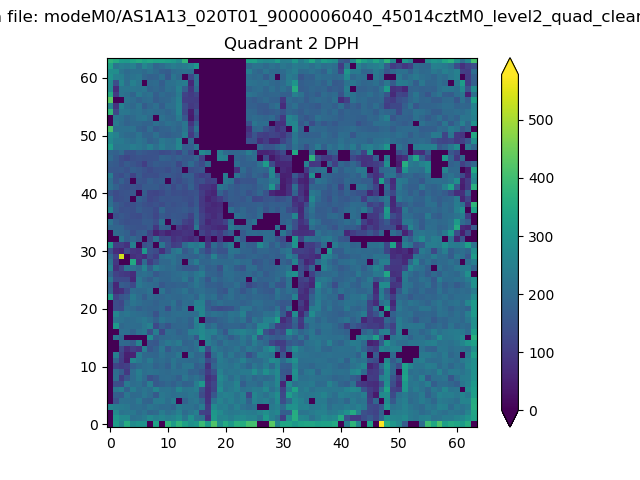
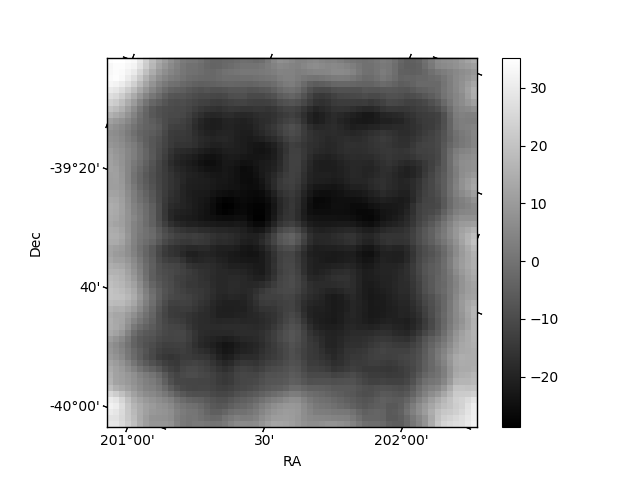
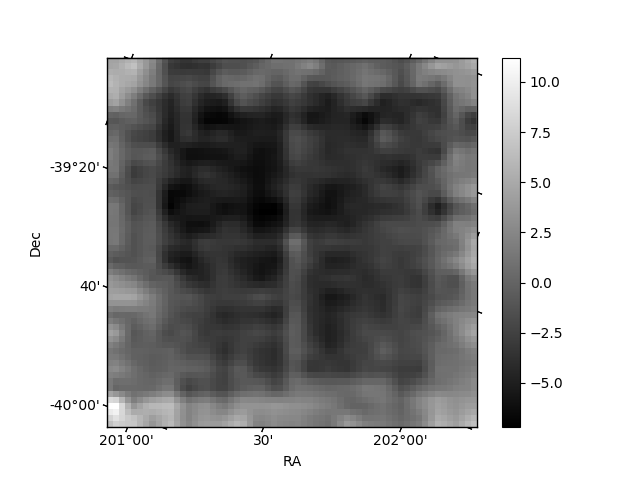
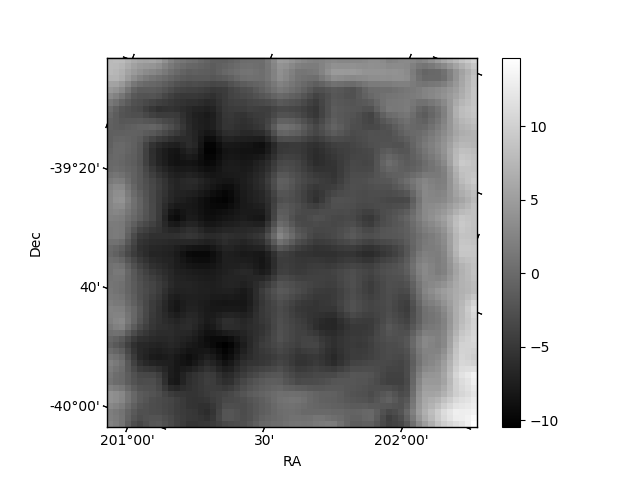
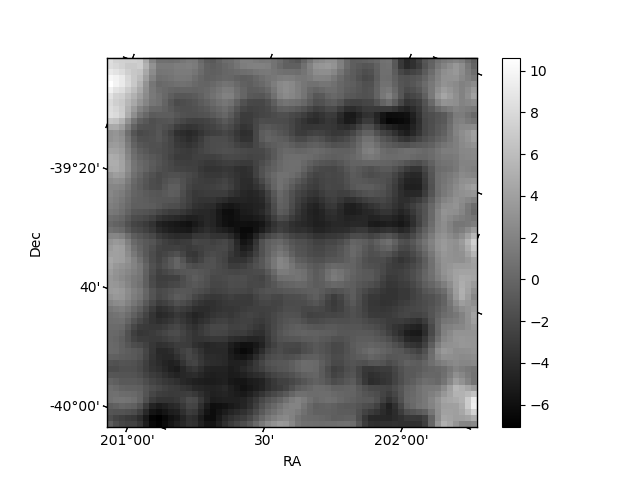
Histogram calculated using DETX and DETY for each event in the final _common_clean file
| Quadrant A | 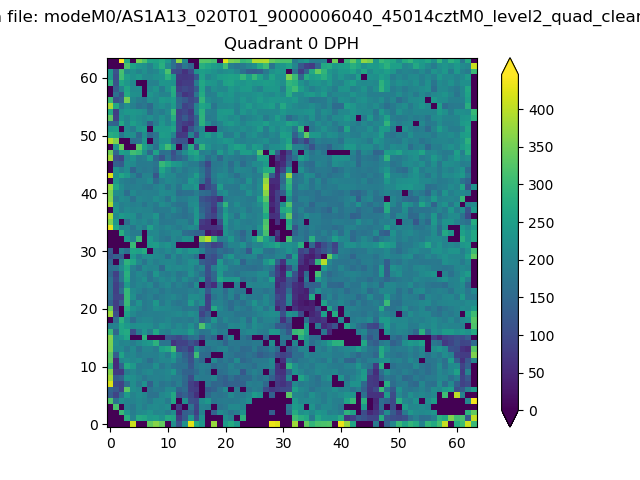 |
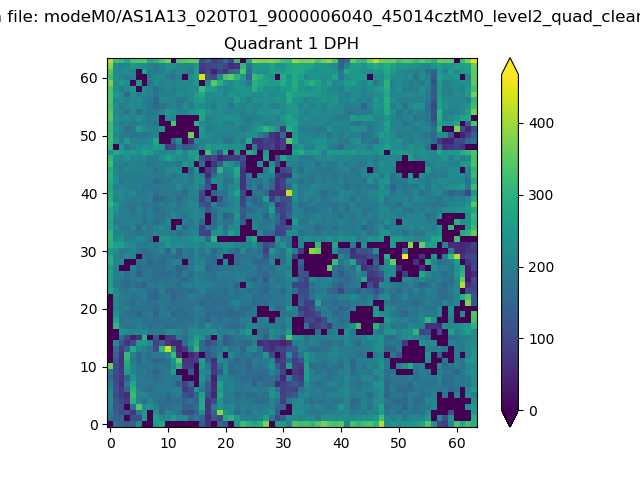 |
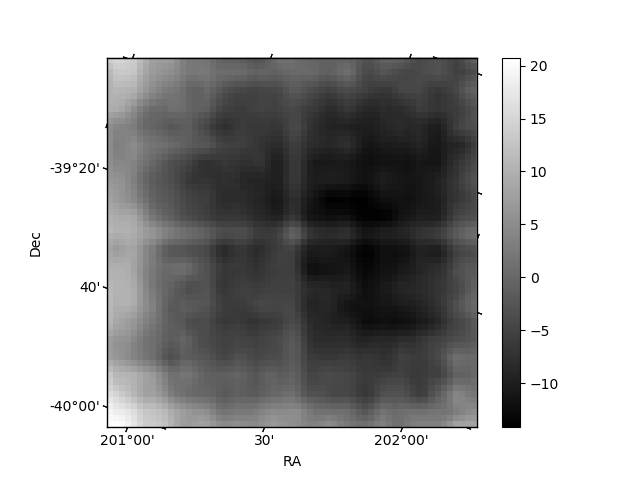
Quadrant B |
|---|---|---|---|
| Quadrant D | 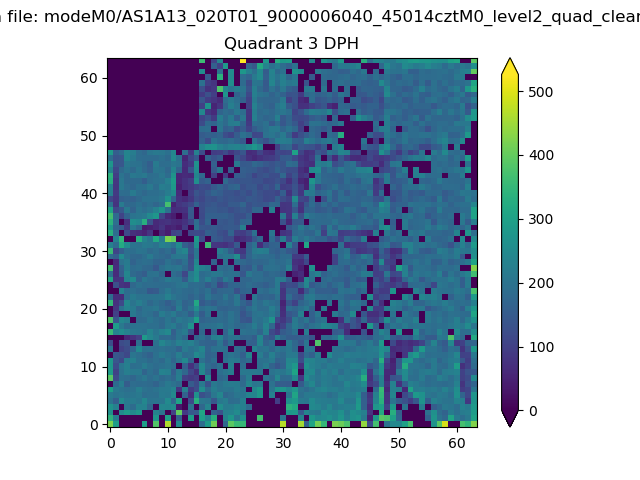 |
 |
Quadrant C |
| Plot type | Count rate plots | Images |
|---|---|---|
| Comparison with Poisson distribution Blue bars denote a histogram of data divided into 1 sec bins. Red curve is a Poisson curve with rate = median count rate of data. |
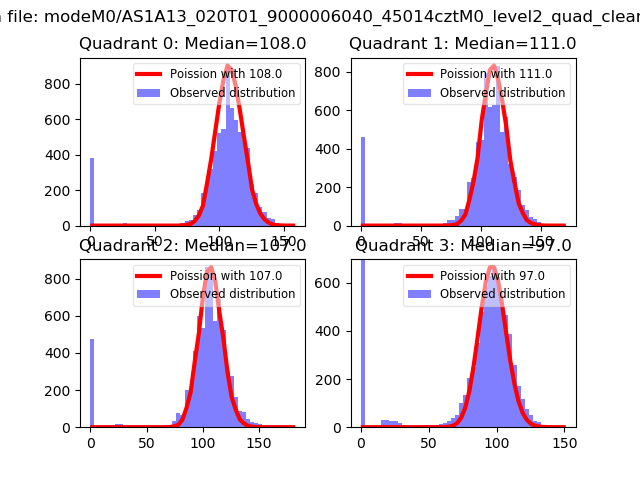 |
 |
| Quadrant-wise count rates Data is divided into 100 sec bins |
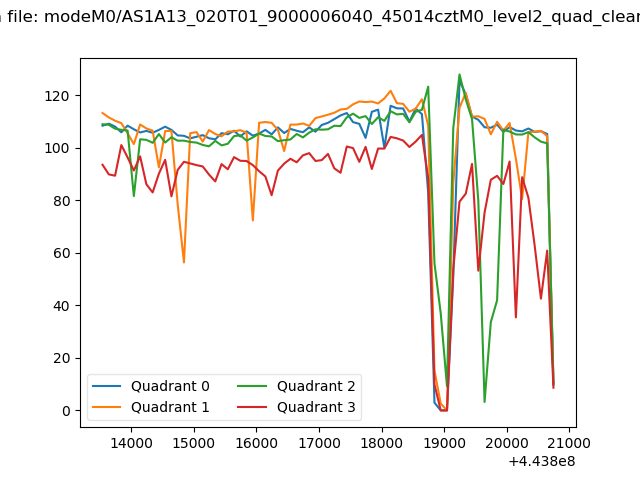 |
|
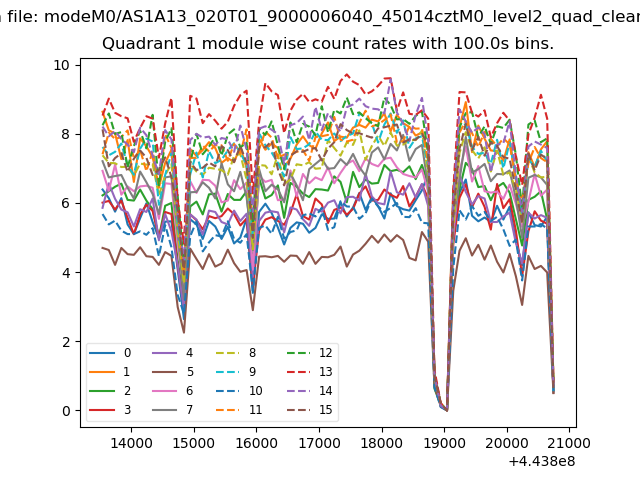
| Module-wise count rates for Quadrant A Data is divided into 100 sec bins |
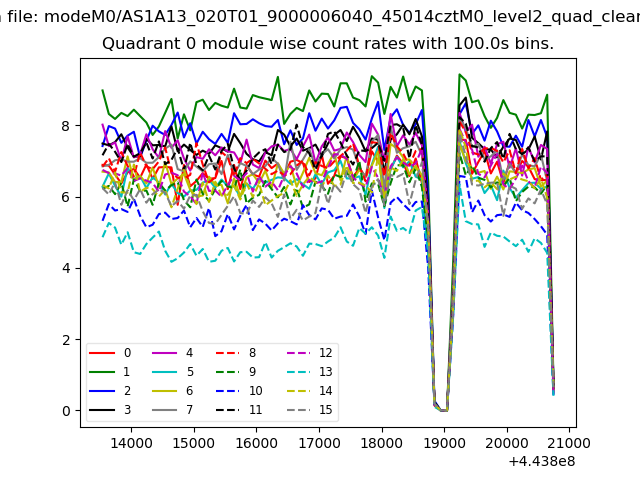 |
 |
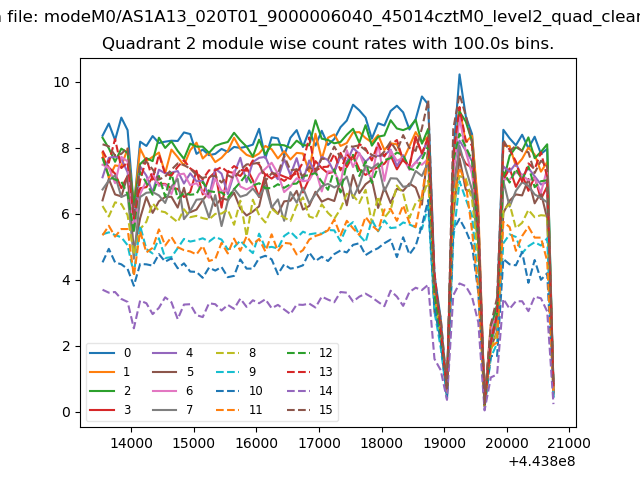
| Module-wise count rates for Quadrant B Data is divided into 100 sec bins |
 |
 |
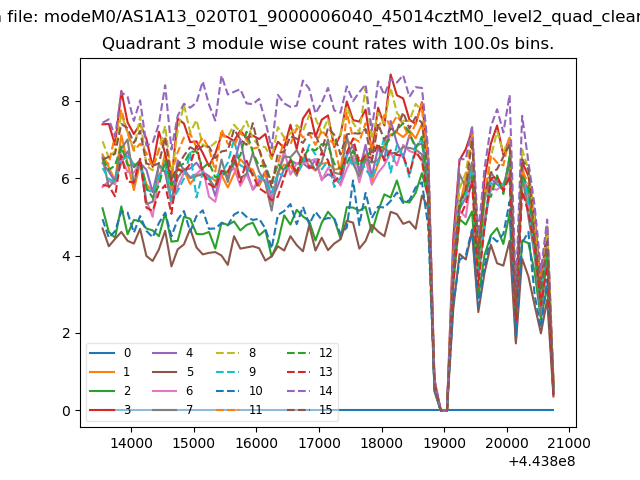
| Module-wise count rates for Quadrant C Data is divided into 100 sec bins |
 |
 |
| Module-wise count rates for Quadrant D Data is divided into 100 sec bins |
 |
 |
| Parameter | Plot |
|---|---|
| CZT HV Monitor | 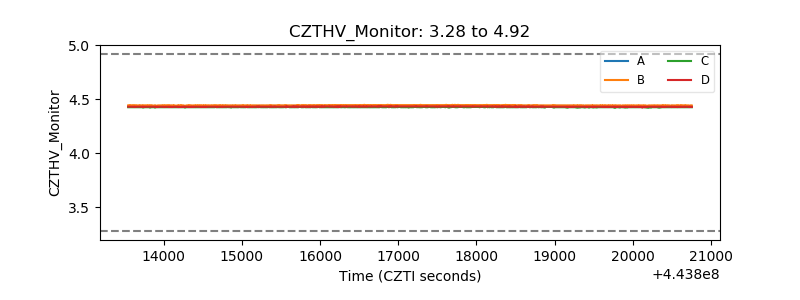 |
| D_VDD | 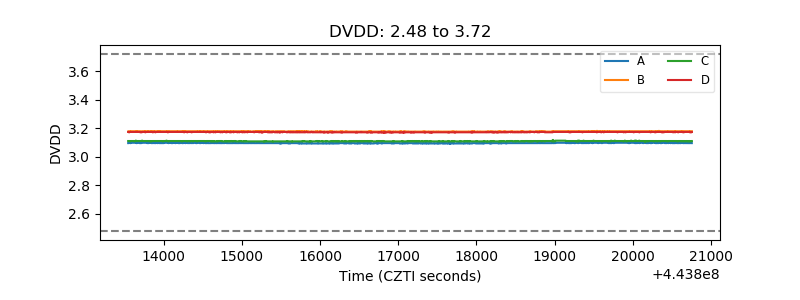 |
| Temperature 1 | 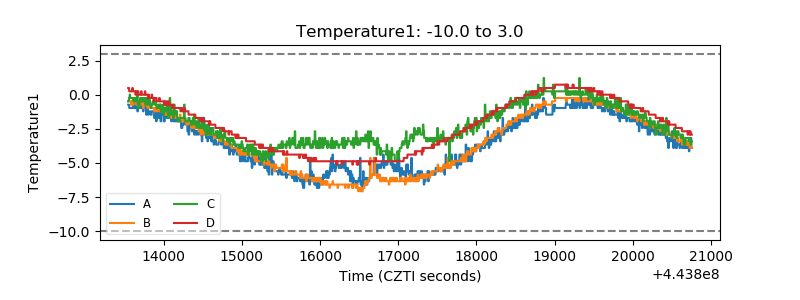 |
| Veto HV Monitor | 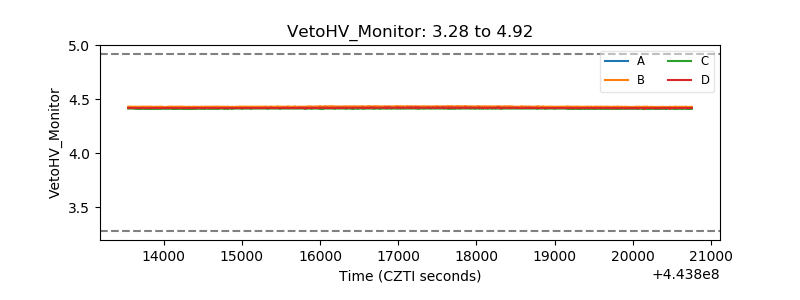 |
| Veto LLD | 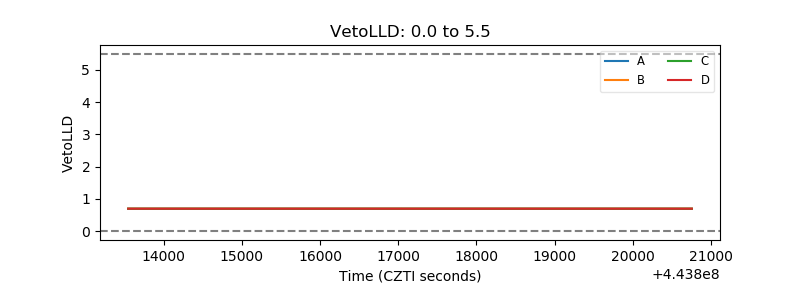 |
| Alpha Counter | 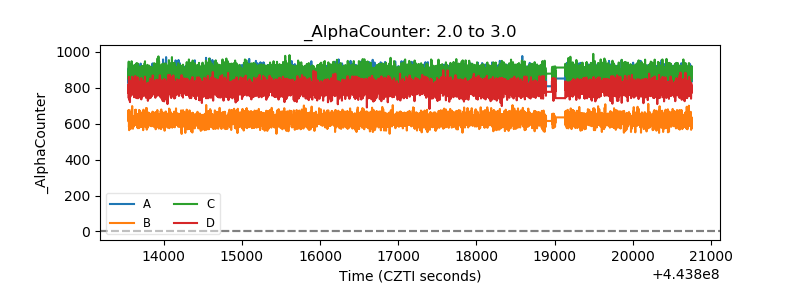 |
| _CPM_Rate | 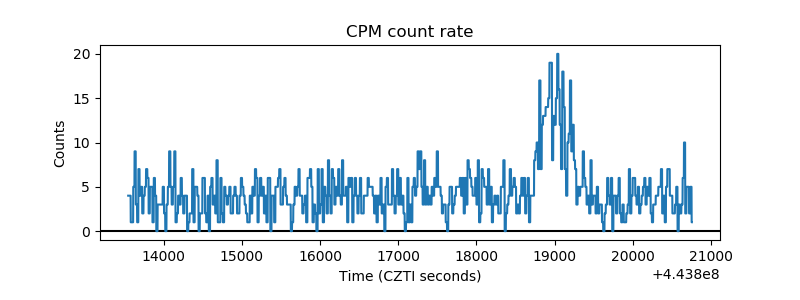 |
| CZT Counter | 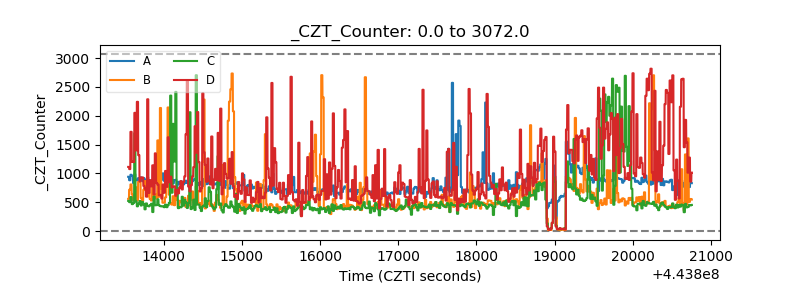 |
| +2.5 Volts monitor | 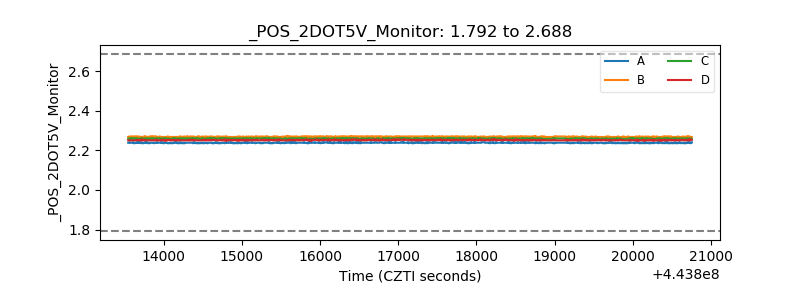 |
| +5 Volts monitor | 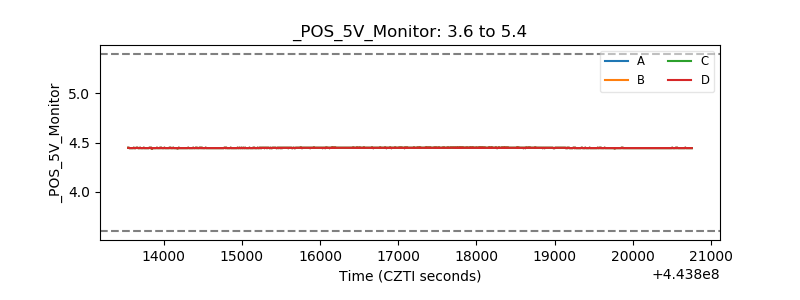 |
| _ROLL_ROT | 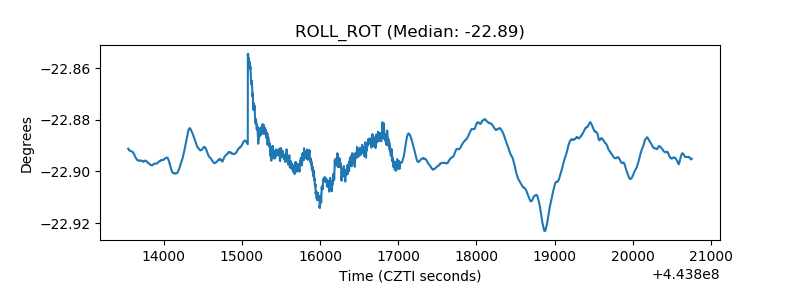 |
| _Roll_DEC | 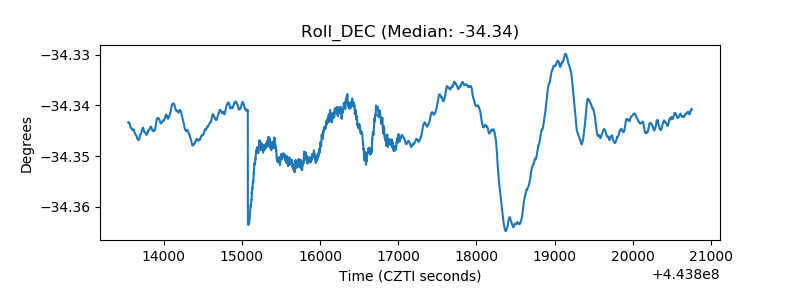 |
| _Roll_RA | 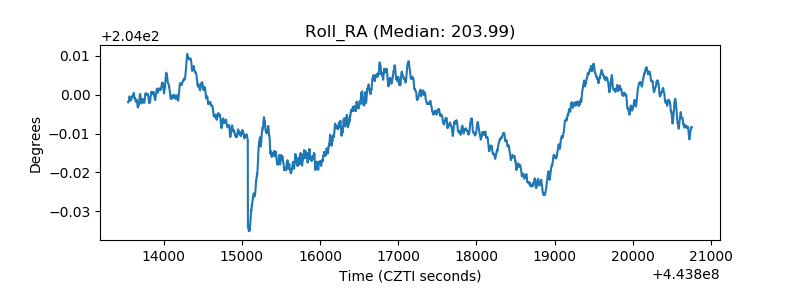 |
| Veto Counter | 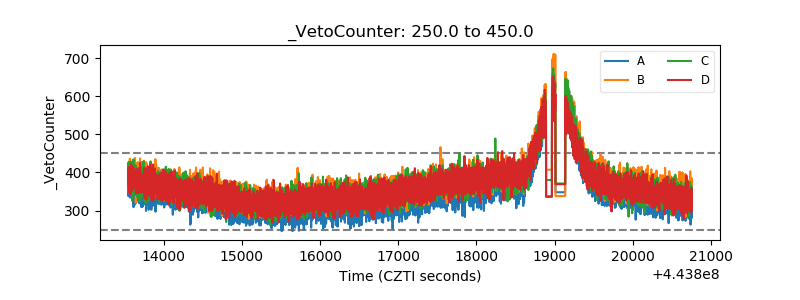 |