| Param | Original file | Final file |
|---|---|---|
| Filename | modeM0/AS1A13_020T01_9000006040_45015cztM0_level2.fits | modeM0/AS1A13_020T01_9000006040_45015cztM0_level2_quad_clean.evt |
| Size (bytes) | 713,234,880 | 111,317,760 |
| Size | 680.2 MB | 106.2 MB |
| Events in quadrant A | 6,011,110 | 793,637 |
| Events in quadrant B | 5,425,286 | 760,382 |
| Events in quadrant C | 3,815,892 | 766,144 |
| Events in quadrant D | 10,578,275 | 536,452 |
| Mode SS | |||
|---|---|---|---|
| Quadrant | BADHDUFLAG | Total packets | Discarded packets |
| A | 0 | 148 | 0 |
| B | 0 | 148 | 0 |
| C | 0 | 148 | 0 |
| D | 0 | 148 | 0 |
| Mode M0 | |||
|---|---|---|---|
| Quadrant | BADHDUFLAG | Total packets | Discarded packets |
| A | 0 | 23192 | 0 |
| B | 0 | 21119 | 0 |
| C | 0 | 16705 | 0 |
| D | 0 | 36675 | 0 |
| Quadrant | Total seconds | Saturated seconds | Saturation percentage |
|---|---|---|---|
| A | 7377 | 108 | 1.464010% |
| B | 7377 | 611 | 8.282500% |
| C | 7377 | 204 | 2.765352% |
| D | 7377 | 2091 | 28.344856% |
Noise dominated data is calculated using 1-second bins in cleaned event files. If a bin has >2000 counts, and if more than 50% of those come from <1% of pixels, then it is considered to be noise-dominated and hence unusable.
| Quadrant | # 1 sec bins | Bins with >0 counts | Bins with >2000 counts | High rate bins dominated by noise | Noise dominated (total time) | Noise dominated (detector-on time) | Marked lightcurve |
|---|---|---|---|---|---|---|---|
| A | 7377 | 7376 | 16 | 16 | 0.22% | 0.22% | 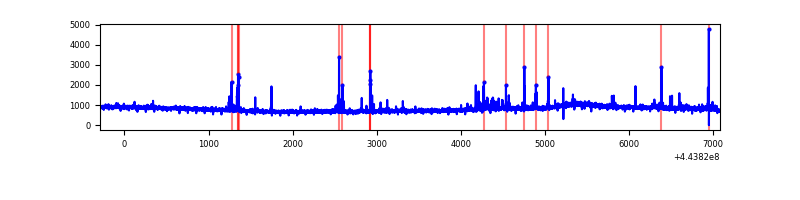 |
| B | 7377 | 7377 | 348 | 348 | 4.72% | 4.72% | 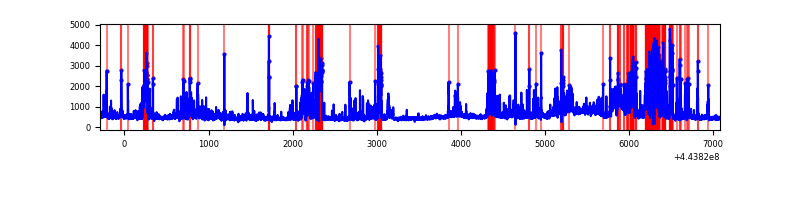 |
| C | 7377 | 7377 | 131 | 131 | 1.78% | 1.78% | 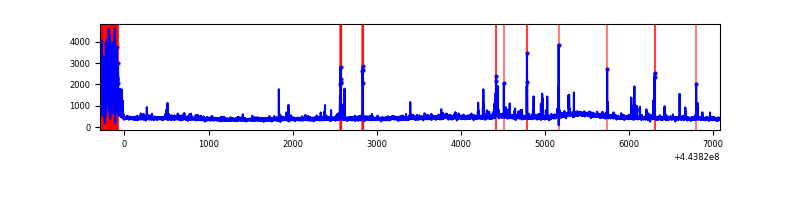 |
| D | 7377 | 7377 | 1881 | 1881 | 25.50% | 25.50% | 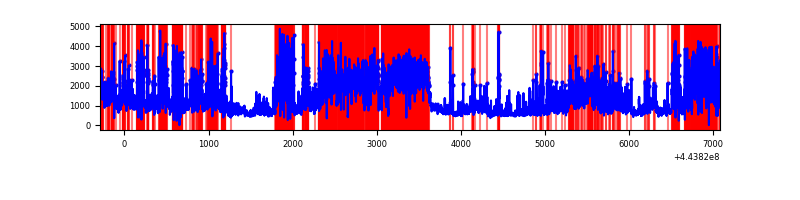 |
Top three noisy pixels from each quadrant. If the there are fewer than three noisy pixels in the level2.evt file, extra rows are filled as -1
| Pixel properties | Quadrant properties | ||||||
|---|---|---|---|---|---|---|---|
| Quadrant | DetID | PixID | Counts | Sigma | Mean | Median | Sigma |
| A | 10 | 83 | 2616066 | 15046.43 | 829 | 810 | 173.8 |
| A | 13 | 248 | 142470 | 815.02 | 829 | 810 | 173.8 |
| A | 0 | 243 | 26518 | 147.91 | 829 | 810 | 173.8 |
| B | 0 | 189 | 1051058 | 6619.44 | 808 | 782 | 158.7 |
| B | 4 | 171 | 551257 | 3469.41 | 808 | 782 | 158.7 |
| B | 0 | 155 | 176452 | 1107.17 | 808 | 782 | 158.7 |
| C | 14 | 254 | 500270 | 2641.23 | 803 | 808 | 189.1 |
| C | 12 | 2 | 79230 | 414.71 | 803 | 808 | 189.1 |
| C | 3 | 233 | 58915 | 307.28 | 803 | 808 | 189.1 |
| D | 13 | 187 | 3081838 | 16916.66 | 715 | 692 | 182.1 |
| D | 11 | 241 | 744291 | 4082.64 | 715 | 692 | 182.1 |
| D | 12 | 233 | 732803 | 4019.57 | 715 | 692 | 182.1 |
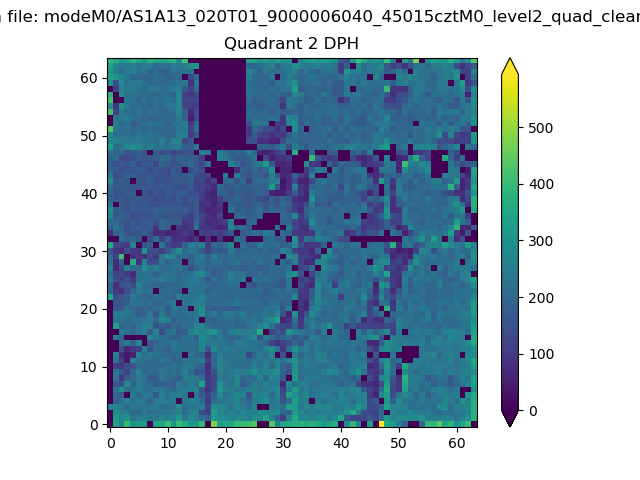
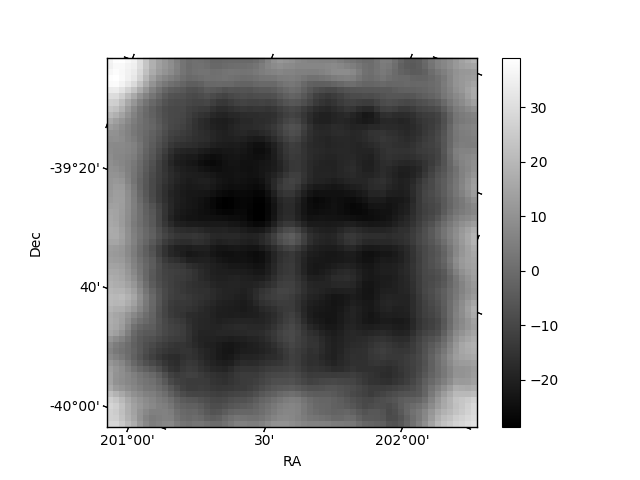
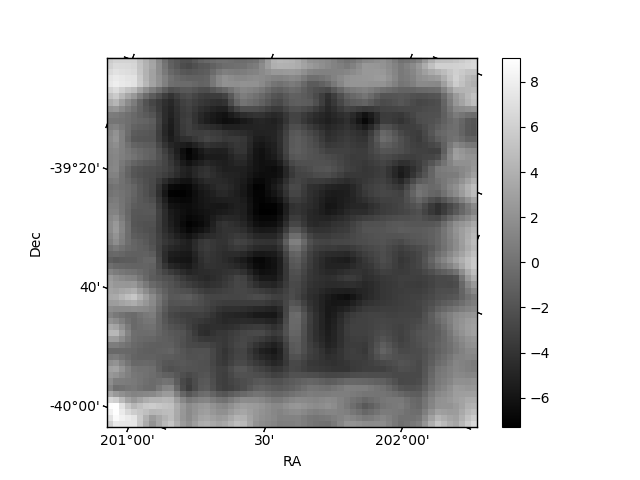
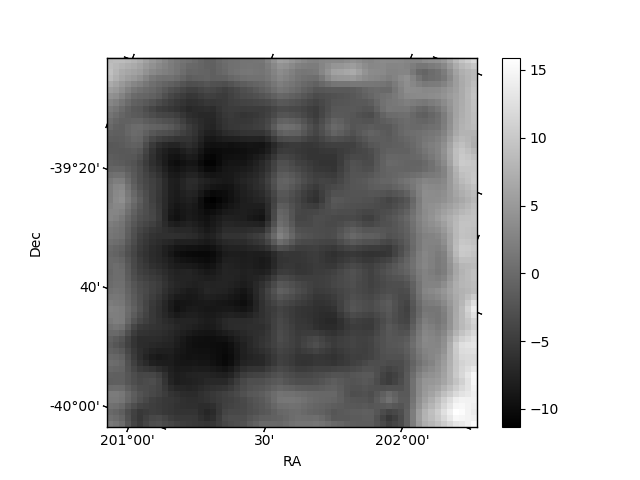
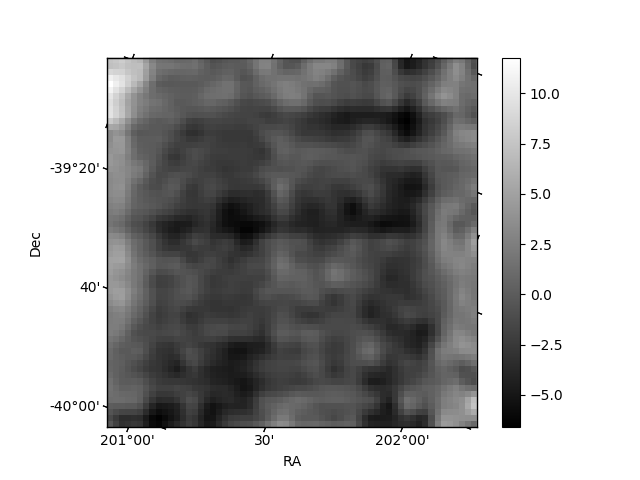
Histogram calculated using DETX and DETY for each event in the final _common_clean file
| Quadrant A | 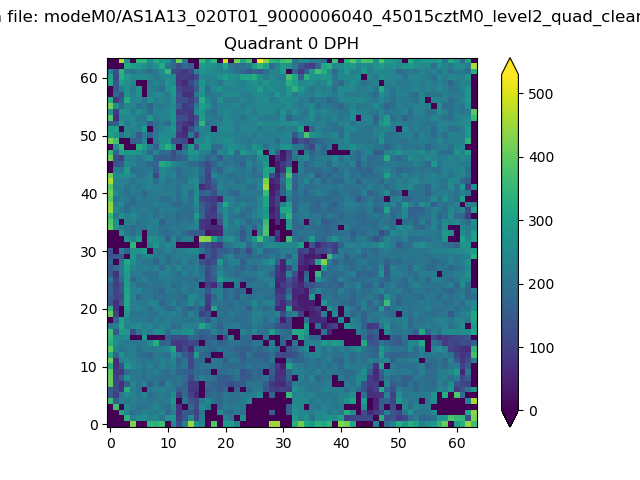 |
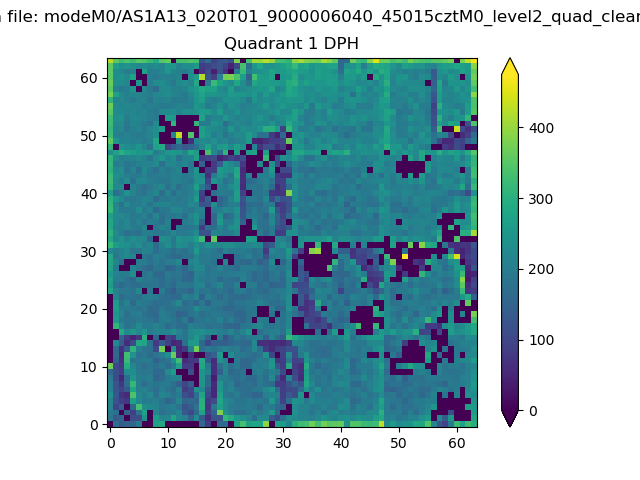 |
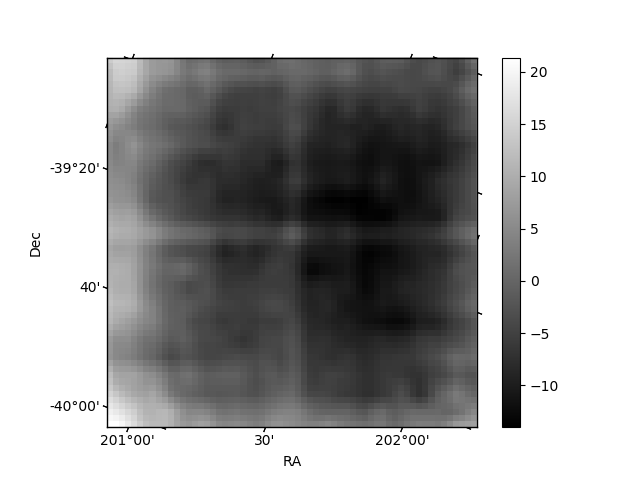
Quadrant B |
|---|---|---|---|
| Quadrant D | 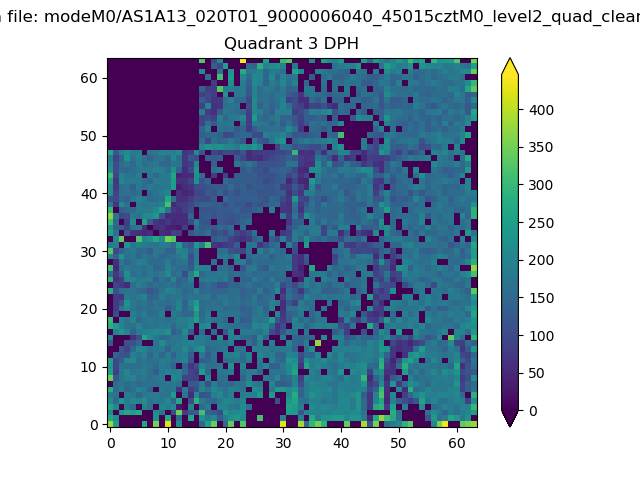 |
 |
Quadrant C |
| Plot type | Count rate plots | Images |
|---|---|---|
| Comparison with Poisson distribution Blue bars denote a histogram of data divided into 1 sec bins. Red curve is a Poisson curve with rate = median count rate of data. |
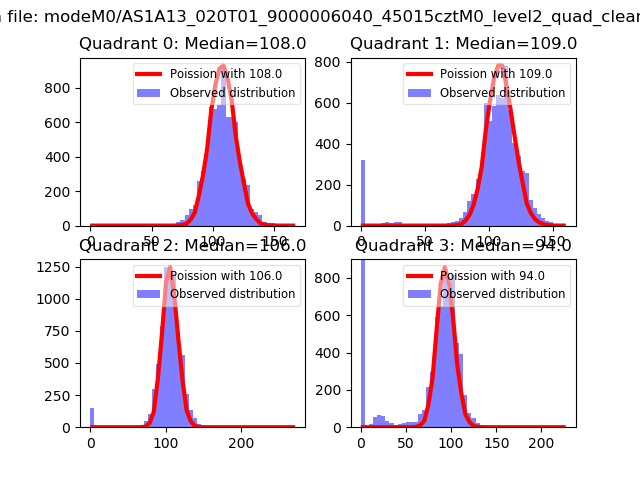 |
 |
| Quadrant-wise count rates Data is divided into 100 sec bins |
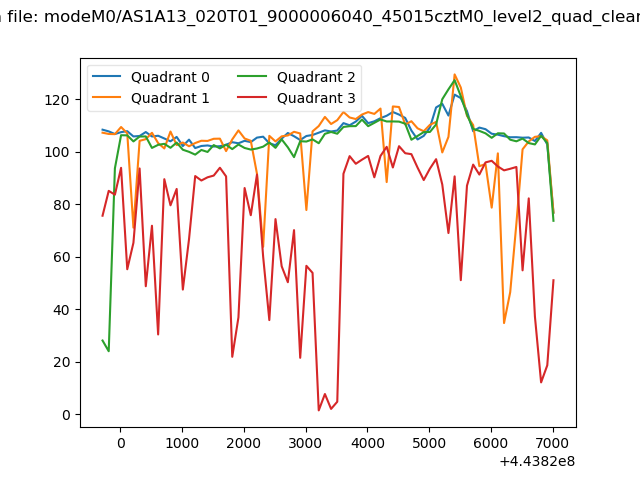 |
|
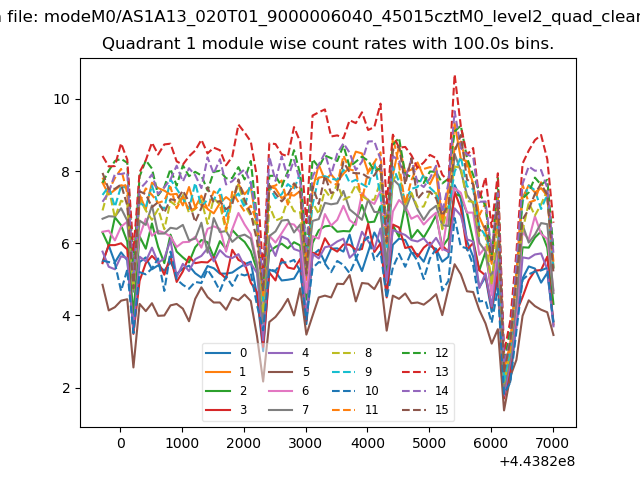
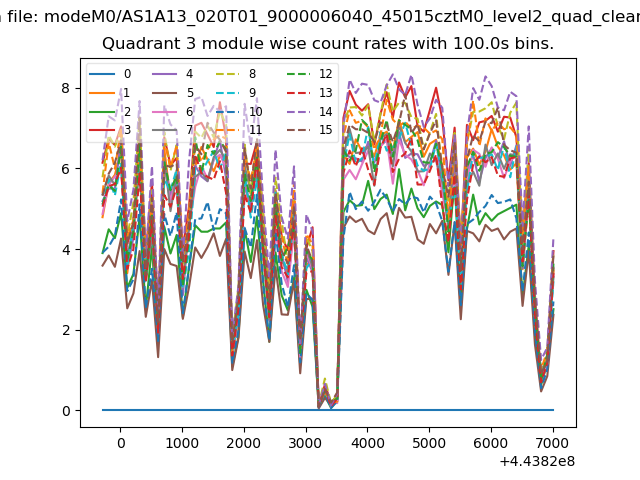
| Module-wise count rates for Quadrant A Data is divided into 100 sec bins |
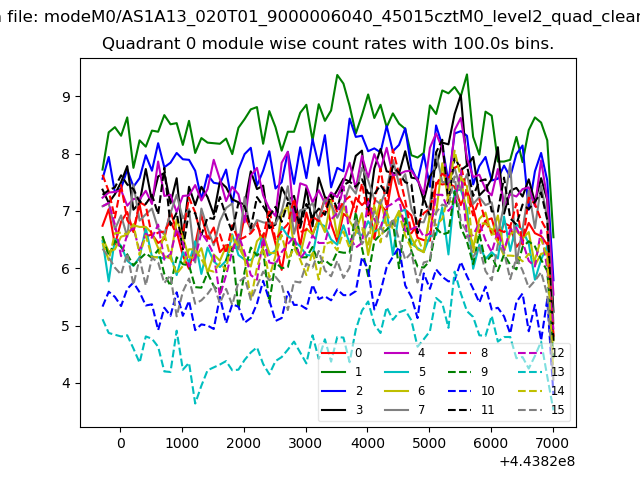 |
 |
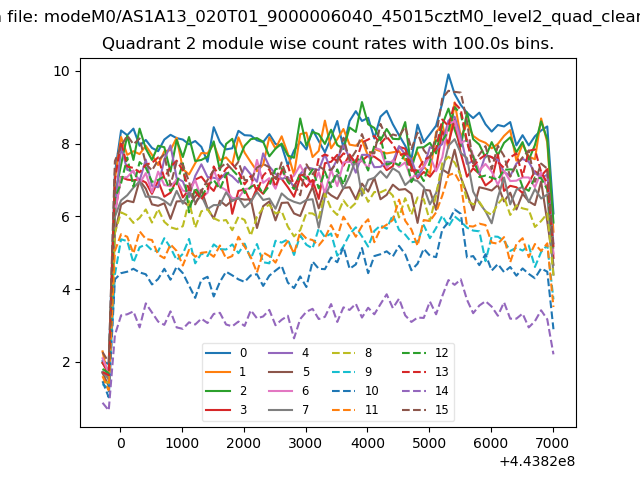
| Module-wise count rates for Quadrant B Data is divided into 100 sec bins |
 |
 |
| Module-wise count rates for Quadrant C Data is divided into 100 sec bins |
 |
 |
| Module-wise count rates for Quadrant D Data is divided into 100 sec bins |
 |
 |
| Parameter | Plot |
|---|---|
| CZT HV Monitor | 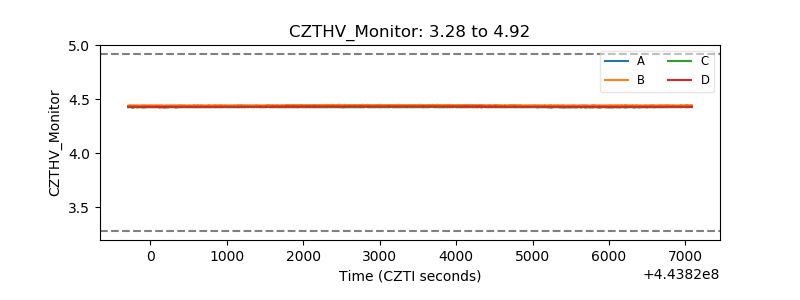 |
| D_VDD | 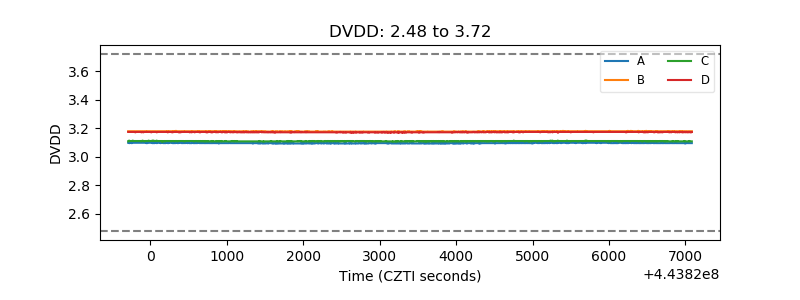 |
| Temperature 1 | 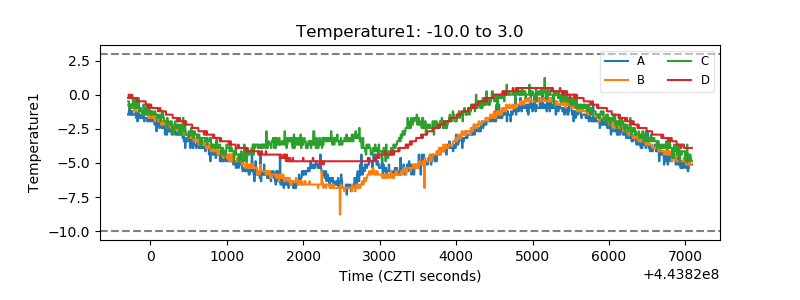 |
| Veto HV Monitor |  |
| Veto LLD | 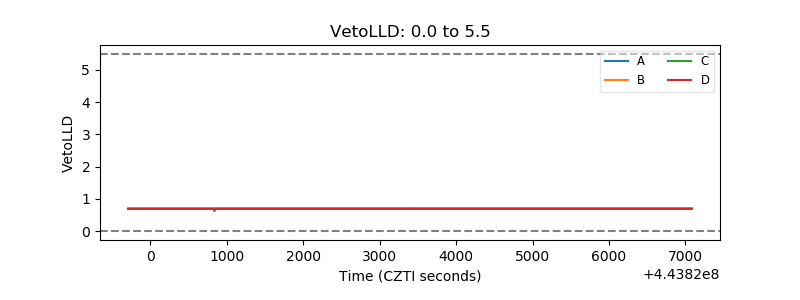 |
| Alpha Counter | 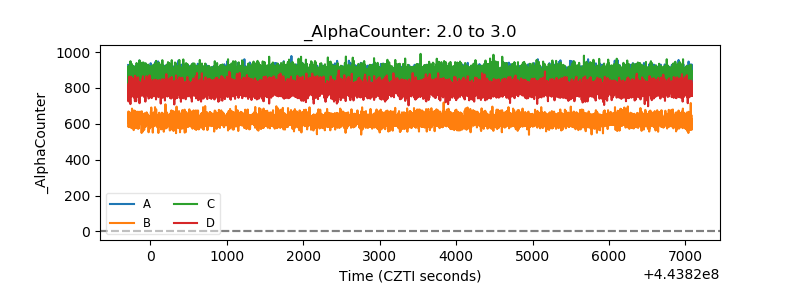 |
| _CPM_Rate | 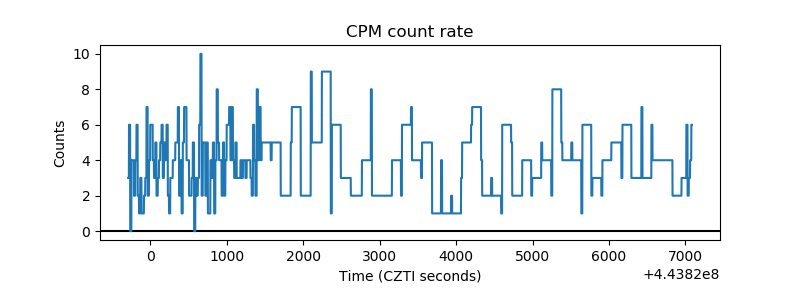 |
| CZT Counter | 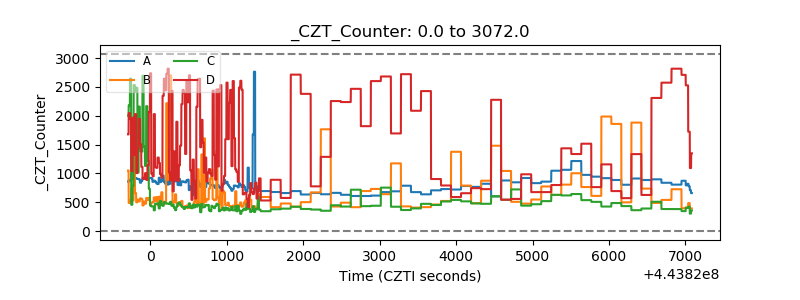 |
| +2.5 Volts monitor | 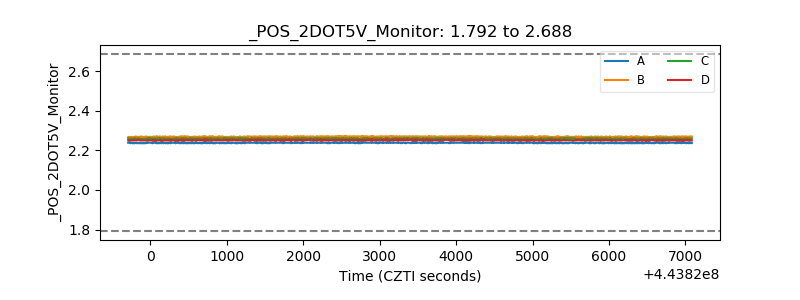 |
| +5 Volts monitor | 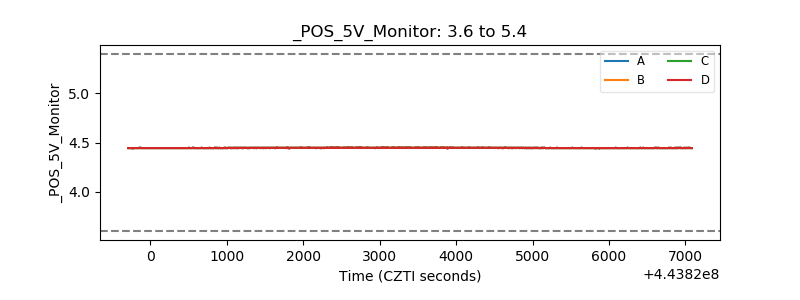 |
| _ROLL_ROT | 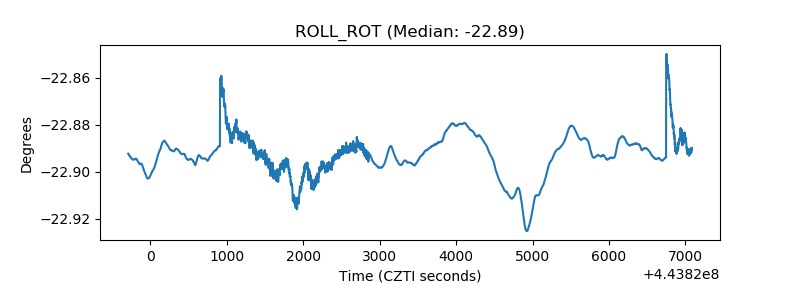 |
| _Roll_DEC |  |
| _Roll_RA | 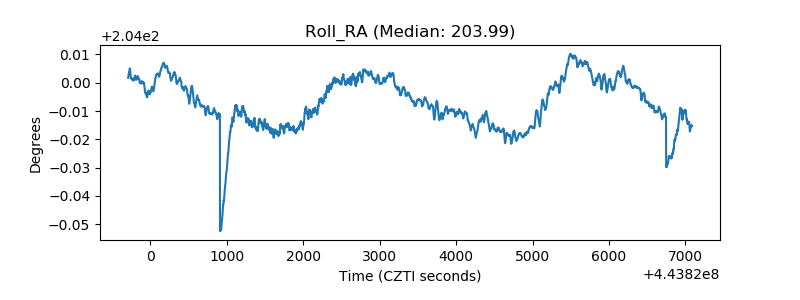 |
| Veto Counter | 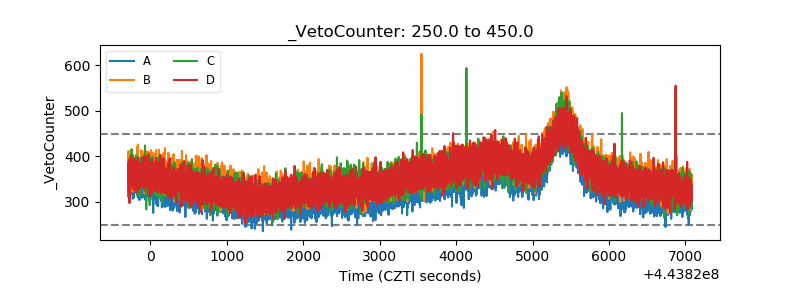 |