| Param | Original file | Final file |
|---|---|---|
| Filename | modeM0/AS1A13_020T01_9000006040_45019cztM0_level2.fits | modeM0/AS1A13_020T01_9000006040_45019cztM0_level2_quad_clean.evt |
| Size (bytes) | 801,132,480 | 136,304,640 |
| Size | 764.0 MB | 130.0 MB |
| Events in quadrant A | 6,993,478 | 960,316 |
| Events in quadrant B | 6,249,236 | 932,022 |
| Events in quadrant C | 4,026,722 | 951,634 |
| Events in quadrant D | 11,689,360 | 658,203 |
| Mode SS | |||
|---|---|---|---|
| Quadrant | BADHDUFLAG | Total packets | Discarded packets |
| A | 0 | 180 | 0 |
| B | 0 | 180 | 0 |
| C | 0 | 180 | 0 |
| D | 0 | 180 | 0 |
| Mode M0 | |||
|---|---|---|---|
| Quadrant | BADHDUFLAG | Total packets | Discarded packets |
| A | 0 | 27780 | 0 |
| B | 0 | 24926 | 0 |
| C | 0 | 18700 | 0 |
| D | 0 | 41008 | 3 |
| Quadrant | Total seconds | Saturated seconds | Saturation percentage |
|---|---|---|---|
| A | 8998 | 107 | 1.189153% |
| B | 8998 | 639 | 7.101578% |
| C | 8999 | 23 | 0.255584% |
| D | 8998 | 2362 | 26.250278% |
Noise dominated data is calculated using 1-second bins in cleaned event files. If a bin has >2000 counts, and if more than 50% of those come from <1% of pixels, then it is considered to be noise-dominated and hence unusable.
| Quadrant | # 1 sec bins | Bins with >0 counts | Bins with >2000 counts | High rate bins dominated by noise | Noise dominated (total time) | Noise dominated (detector-on time) | Marked lightcurve |
|---|---|---|---|---|---|---|---|
| A | 8998 | 8997 | 2 | 2 | 0.02% | 0.02% | 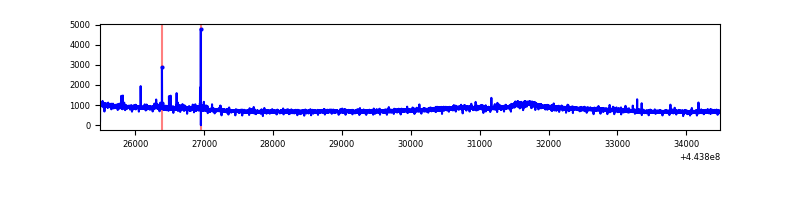 |
| B | 8998 | 8998 | 349 | 349 | 3.88% | 3.88% | 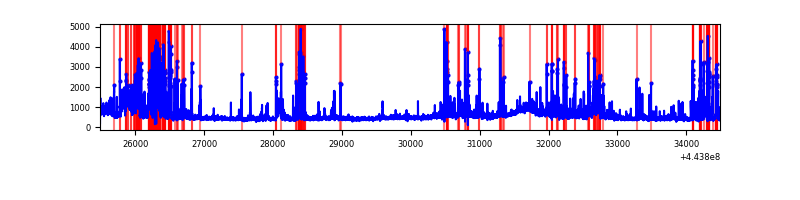 |
| C | 8999 | 8999 | 11 | 11 | 0.12% | 0.12% | 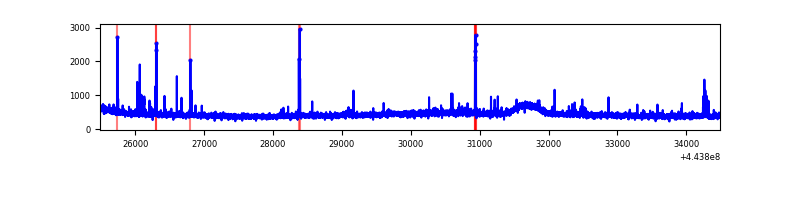 |
| D | 8998 | 8998 | 2067 | 2067 | 22.97% | 22.97% |  |
Top three noisy pixels from each quadrant. If the there are fewer than three noisy pixels in the level2.evt file, extra rows are filled as -1
| Pixel properties | Quadrant properties | ||||||
|---|---|---|---|---|---|---|---|
| Quadrant | DetID | PixID | Counts | Sigma | Mean | Median | Sigma |
| A | 10 | 83 | 3069112 | 14656.56 | 1001 | 980 | 209.3 |
| A | 0 | 243 | 26847 | 123.57 | 1001 | 980 | 209.3 |
| A | 10 | 248 | 12882 | 56.86 | 1001 | 980 | 209.3 |
| B | 0 | 189 | 833773 | 4317.03 | 982 | 953 | 192.9 |
| B | 4 | 171 | 789807 | 4089.12 | 982 | 953 | 192.9 |
| B | 12 | 3 | 240246 | 1240.41 | 982 | 953 | 192.9 |
| C | 3 | 233 | 59763 | 250.88 | 990 | 996 | 234.2 |
| C | 12 | 2 | 45989 | 192.08 | 990 | 996 | 234.2 |
| C | 15 | 208 | 41830 | 174.32 | 990 | 996 | 234.2 |
| D | 13 | 249 | 1641428 | 7630.49 | 852 | 827 | 215.0 |
| D | 1 | 52 | 1231986 | 5726.17 | 852 | 827 | 215.0 |
| D | 13 | 187 | 1216641 | 5654.8 | 852 | 827 | 215.0 |
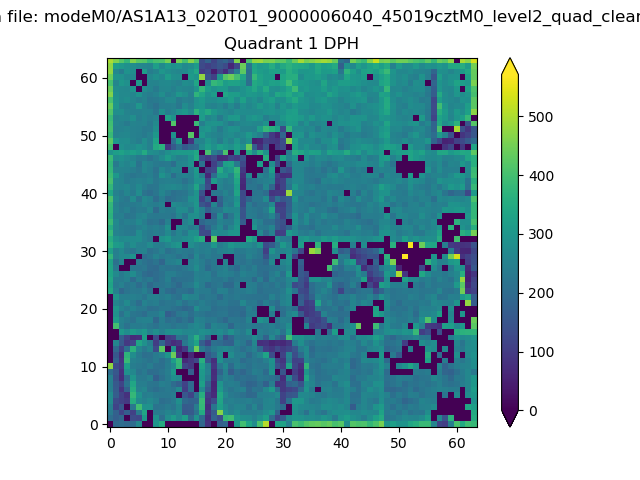
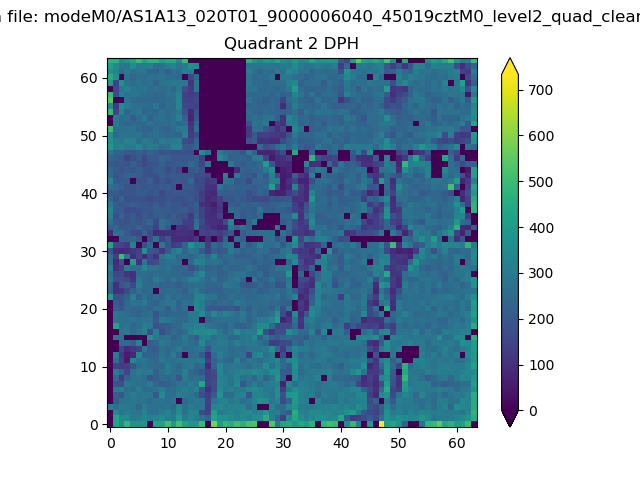
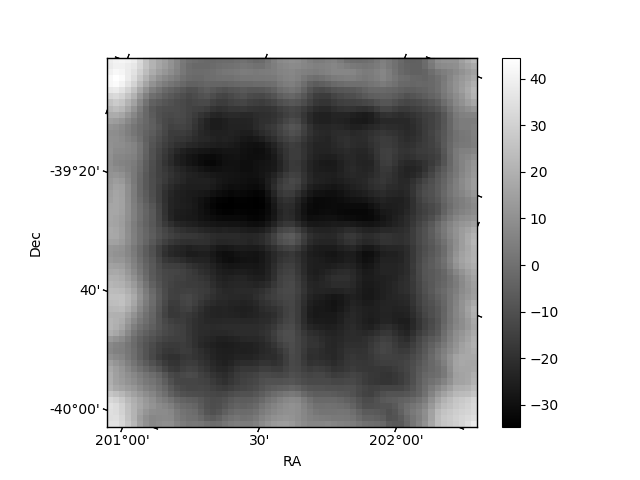
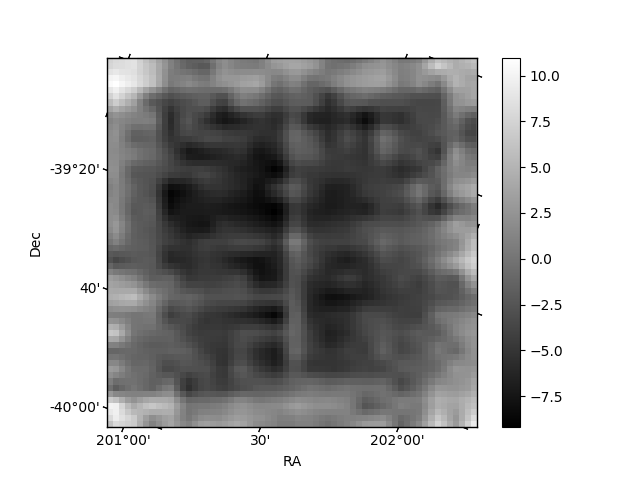
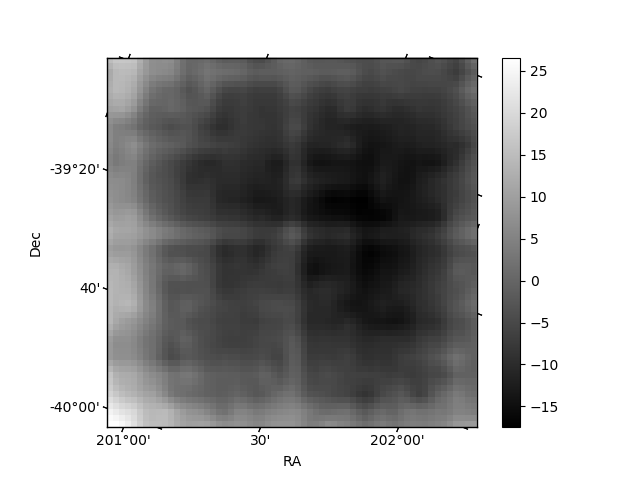
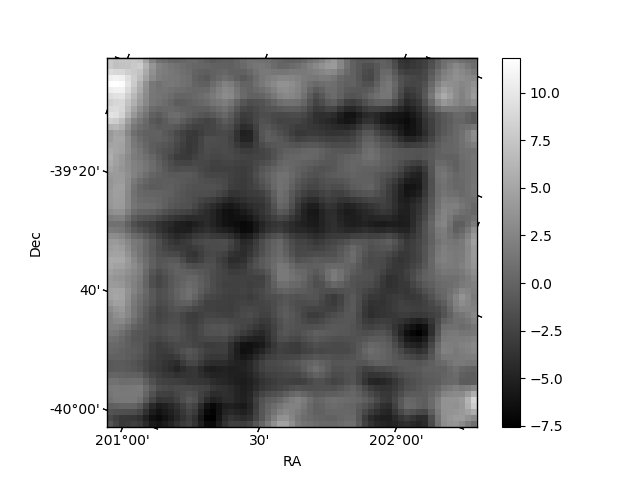
Histogram calculated using DETX and DETY for each event in the final _common_clean file
| Quadrant A | 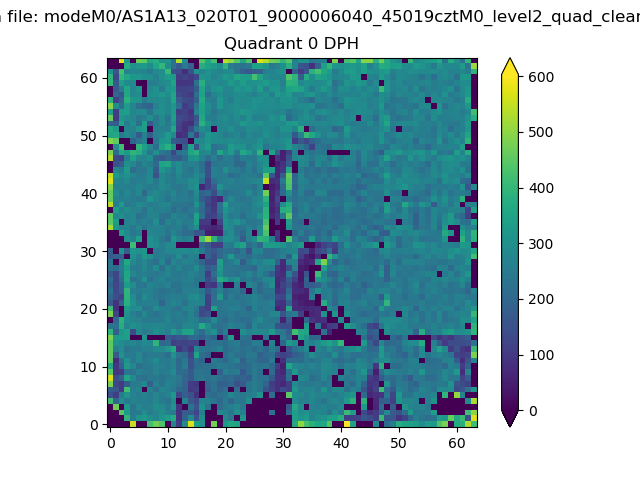 |
 |
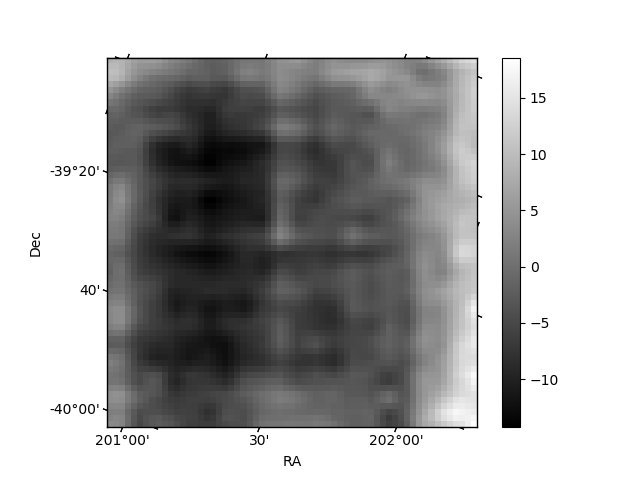
Quadrant B |
|---|---|---|---|
| Quadrant D | 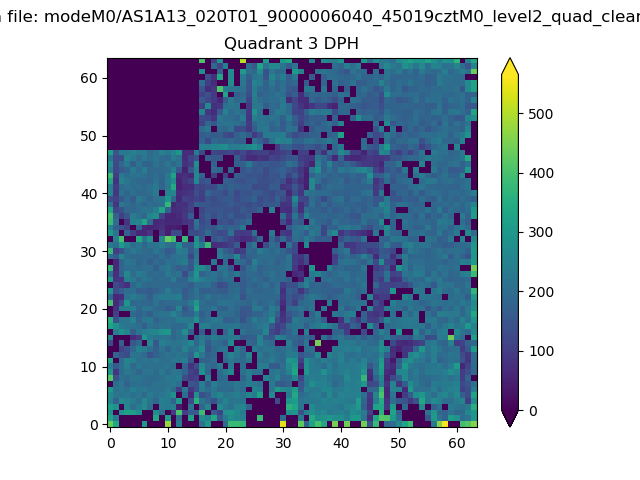 |
 |
Quadrant C |
| Plot type | Count rate plots | Images |
|---|---|---|
| Comparison with Poisson distribution Blue bars denote a histogram of data divided into 1 sec bins. Red curve is a Poisson curve with rate = median count rate of data. |
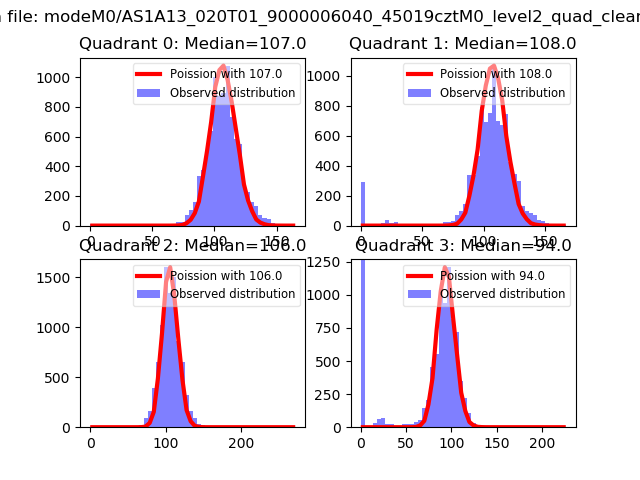 |
 |
| Quadrant-wise count rates Data is divided into 100 sec bins |
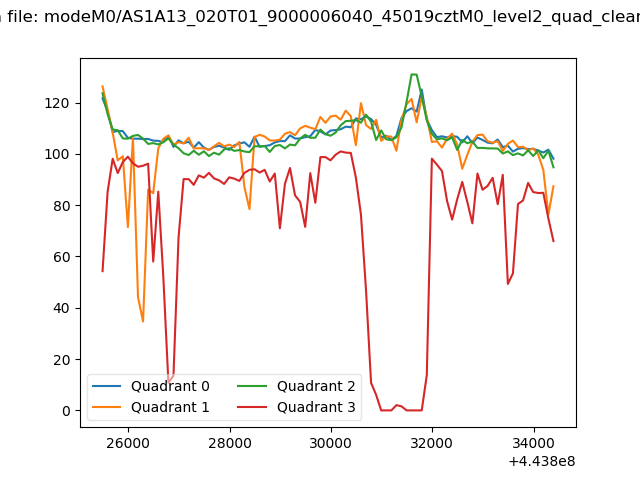 |
|
| Module-wise count rates for Quadrant A Data is divided into 100 sec bins |
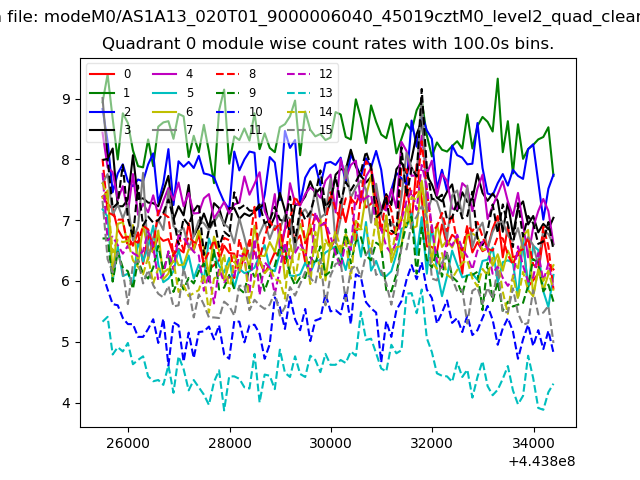 |
 |
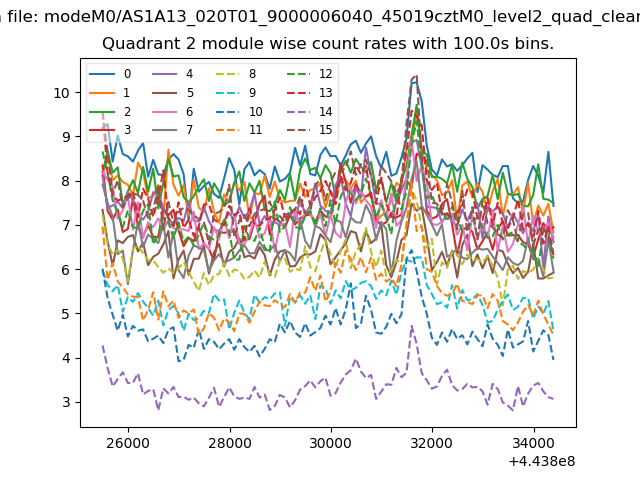
| Module-wise count rates for Quadrant B Data is divided into 100 sec bins |
 |
 |
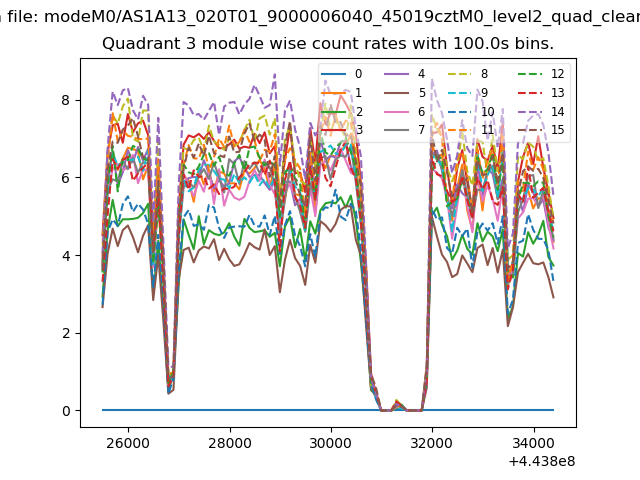
| Module-wise count rates for Quadrant C Data is divided into 100 sec bins |
 |
 |
| Module-wise count rates for Quadrant D Data is divided into 100 sec bins |
 |
 |
| Parameter | Plot |
|---|---|
| CZT HV Monitor |  |
| D_VDD | 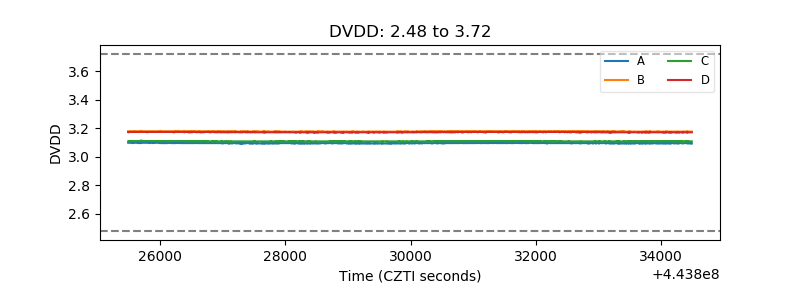 |
| Temperature 1 | 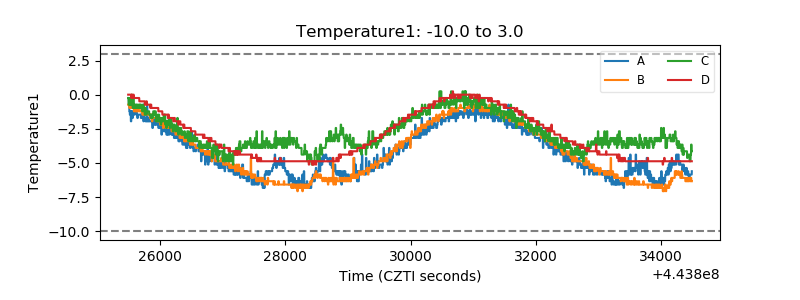 |
| Veto HV Monitor | 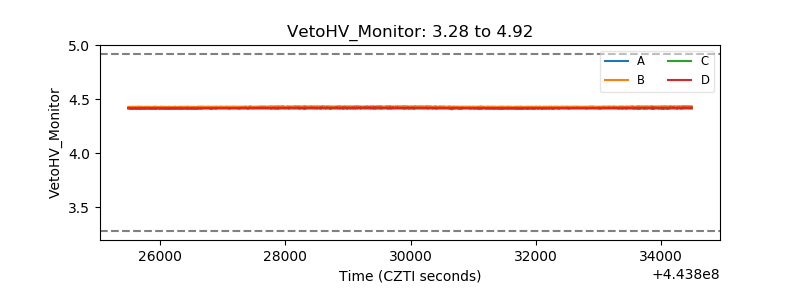 |
| Veto LLD | 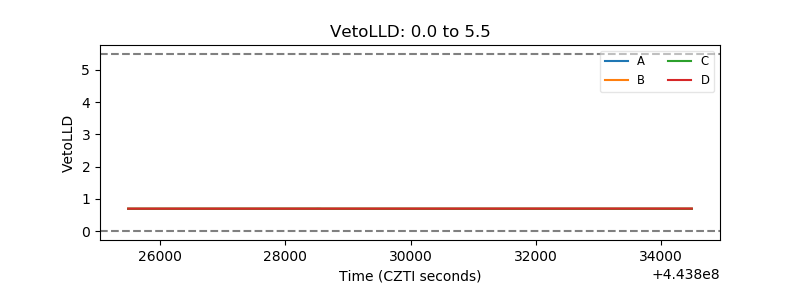 |
| Alpha Counter | 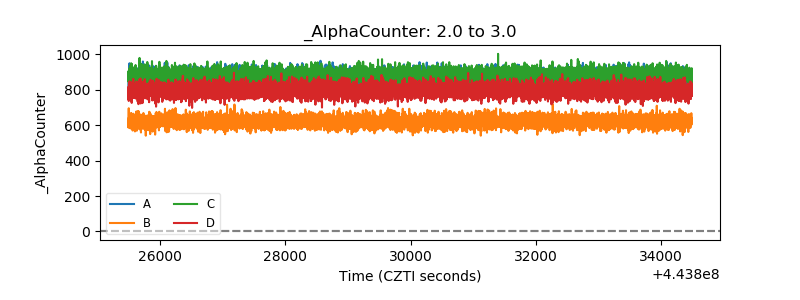 |
| _CPM_Rate | 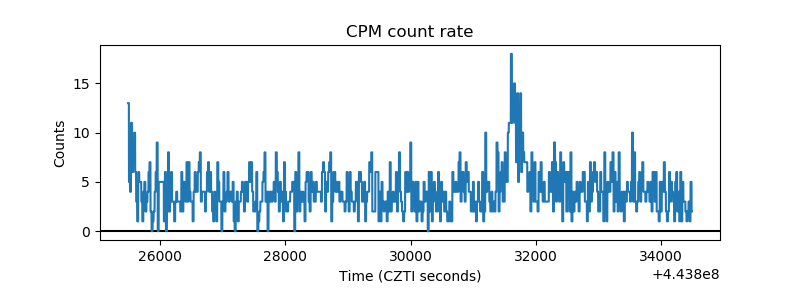 |
| CZT Counter | 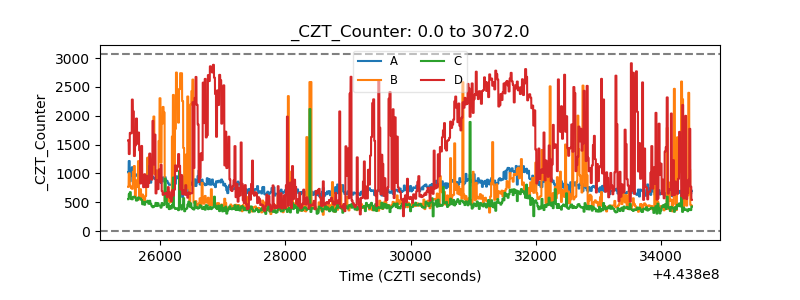 |
| +2.5 Volts monitor | 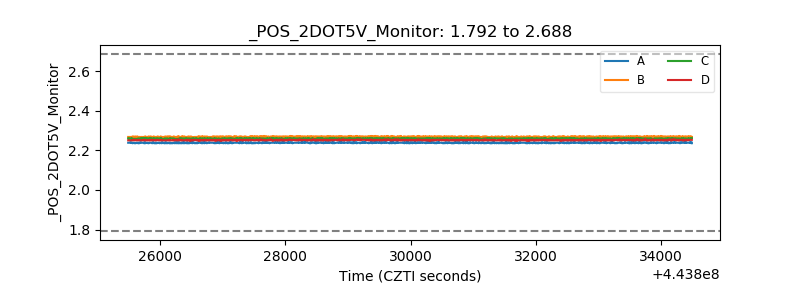 |
| +5 Volts monitor | 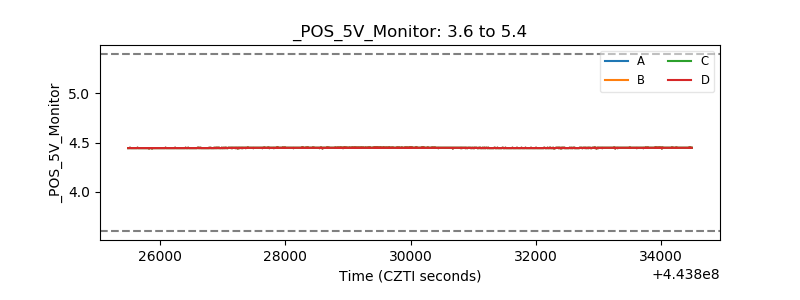 |
| _ROLL_ROT | 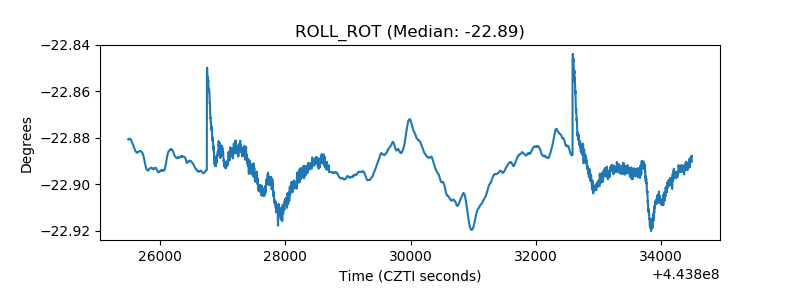 |
| _Roll_DEC | 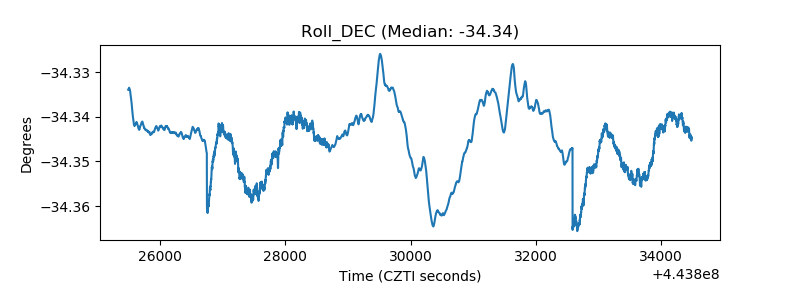 |
| _Roll_RA | 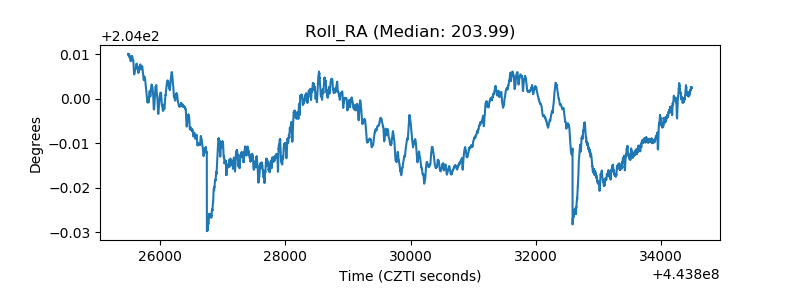 |
| Veto Counter | 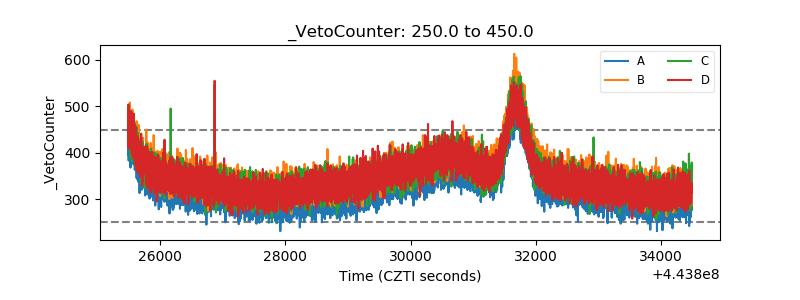 |