| Param | Original file | Final file |
|---|---|---|
| Filename | modeM0/AS1A13_020T01_9000006040_45020cztM0_level2.fits | modeM0/AS1A13_020T01_9000006040_45020cztM0_level2_quad_clean.evt |
| Size (bytes) | 1,885,115,520 | 345,833,280 |
| Size | 1.8 GB | 329.8 MB |
| Events in quadrant A | 17,452,846 | 2,368,688 |
| Events in quadrant B | 12,749,764 | 2,414,313 |
| Events in quadrant C | 10,489,544 | 2,364,793 |
| Events in quadrant D | 27,354,480 | 1,774,637 |
| Mode SS | |||
|---|---|---|---|
| Quadrant | BADHDUFLAG | Total packets | Discarded packets |
| A | 0 | 456 | 0 |
| B | 0 | 456 | 0 |
| C | 0 | 456 | 0 |
| D | 0 | 456 | 0 |
| Mode M9 | |||
|---|---|---|---|
| Quadrant | BADHDUFLAG | Total packets | Discarded packets |
| A | 0 | 26 | 0 |
| B | 0 | 26 | 0 |
| C | 0 | 26 | 0 |
| D | 0 | 26 | 0 |
| Mode M0 | |||
|---|---|---|---|
| Quadrant | BADHDUFLAG | Total packets | Discarded packets |
| A | 0 | 69463 | 4 |
| B | 0 | 53328 | 4 |
| C | 0 | 47377 | 4 |
| D | 0 | 97089 | 4 |
| Quadrant | Total seconds | Saturated seconds | Saturation percentage |
|---|---|---|---|
| A | 22491 | 353 | 1.569517% |
| B | 22491 | 675 | 3.001200% |
| C | 22491 | 192 | 0.853675% |
| D | 22491 | 3626 | 16.122004% |
Noise dominated data is calculated using 1-second bins in cleaned event files. If a bin has >2000 counts, and if more than 50% of those come from <1% of pixels, then it is considered to be noise-dominated and hence unusable.
| Quadrant | # 1 sec bins | Bins with >0 counts | Bins with >2000 counts | High rate bins dominated by noise | Noise dominated (total time) | Noise dominated (detector-on time) | Marked lightcurve |
|---|---|---|---|---|---|---|---|
| A | 25011 | 22495 | 17 | 17 | 0.07% | 0.08% | 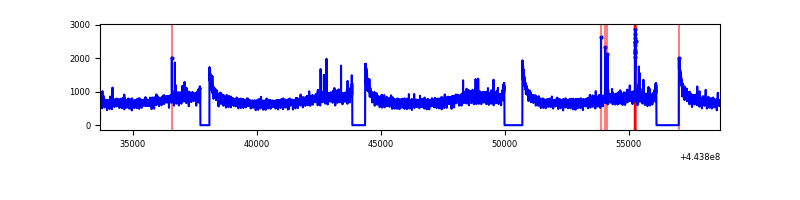 |
| B | 25011 | 22495 | 291 | 291 | 1.16% | 1.29% | 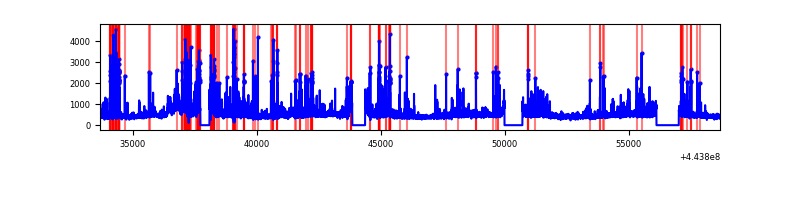 |
| C | 25011 | 22495 | 96 | 96 | 0.38% | 0.43% | 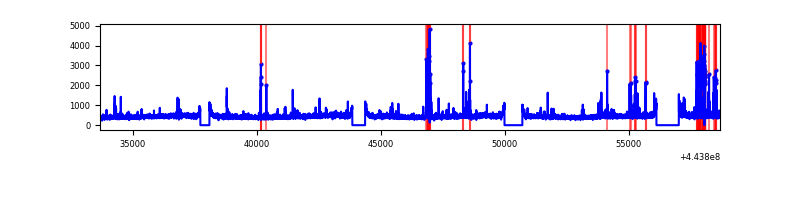 |
| D | 25011 | 22495 | 3017 | 3017 | 12.06% | 13.41% | 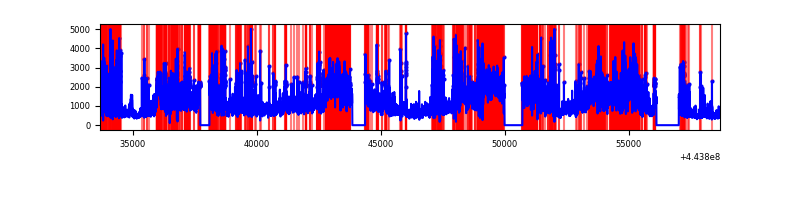 |
Top three noisy pixels from each quadrant. If the there are fewer than three noisy pixels in the level2.evt file, extra rows are filled as -1
| Pixel properties | Quadrant properties | ||||||
|---|---|---|---|---|---|---|---|
| Quadrant | DetID | PixID | Counts | Sigma | Mean | Median | Sigma |
| A | 10 | 83 | 7663635 | 14931.51 | 2498 | 2440 | 513.1 |
| A | 0 | 243 | 58056 | 108.39 | 2498 | 2440 | 513.1 |
| A | 13 | 248 | 42475 | 78.03 | 2498 | 2440 | 513.1 |
| B | 0 | 189 | 1610244 | 3321.52 | 2475 | 2398 | 484.1 |
| B | 5 | 255 | 342492 | 702.57 | 2475 | 2398 | 484.1 |
| B | 5 | 172 | 210574 | 430.05 | 2475 | 2398 | 484.1 |
| C | 14 | 254 | 470810 | 807.07 | 2480 | 2502 | 580.3 |
| C | 1 | 3 | 161692 | 274.34 | 2480 | 2502 | 580.3 |
| C | 3 | 233 | 122065 | 206.05 | 2480 | 2502 | 580.3 |
| D | 11 | 241 | 8134156 | 13734.94 | 2338 | 2268 | 592.1 |
| D | 13 | 174 | 2561861 | 4323.21 | 2338 | 2268 | 592.1 |
| D | 13 | 249 | 2089749 | 3525.8 | 2338 | 2268 | 592.1 |
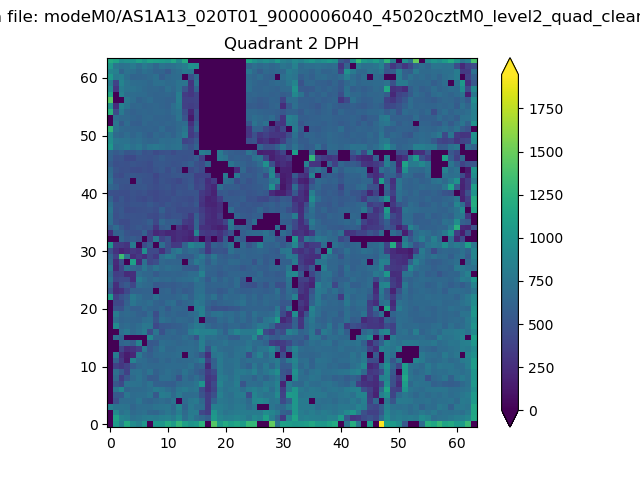
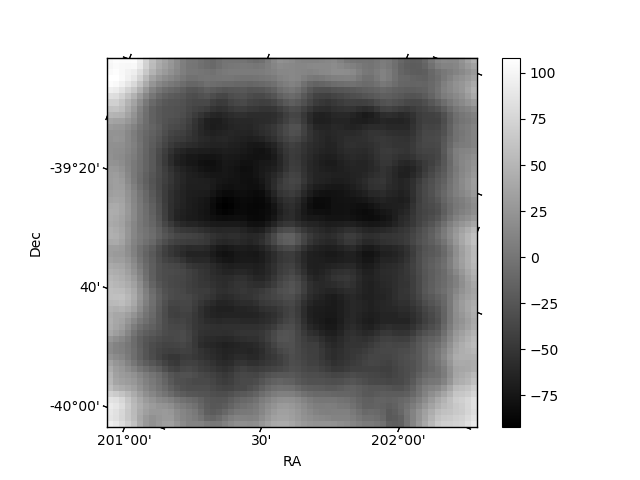
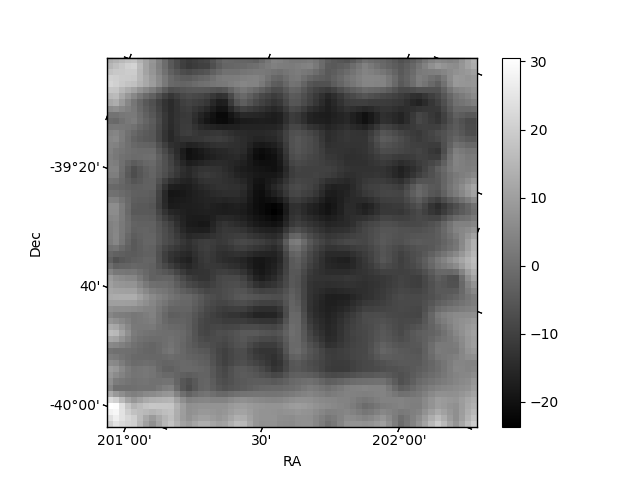
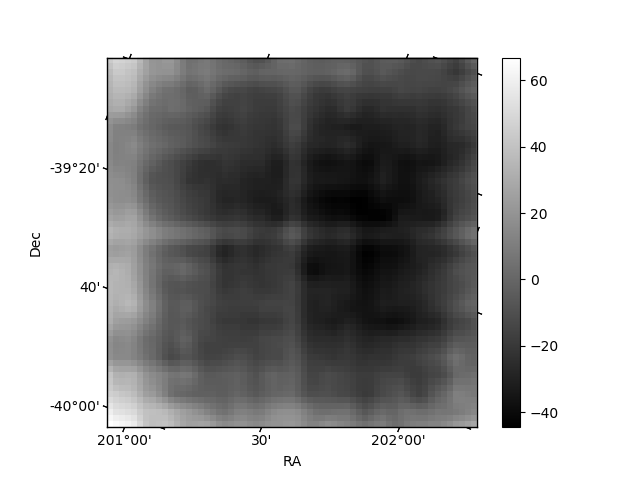
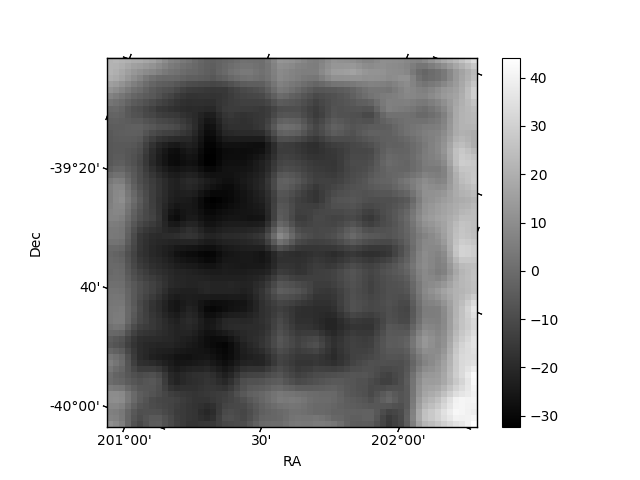
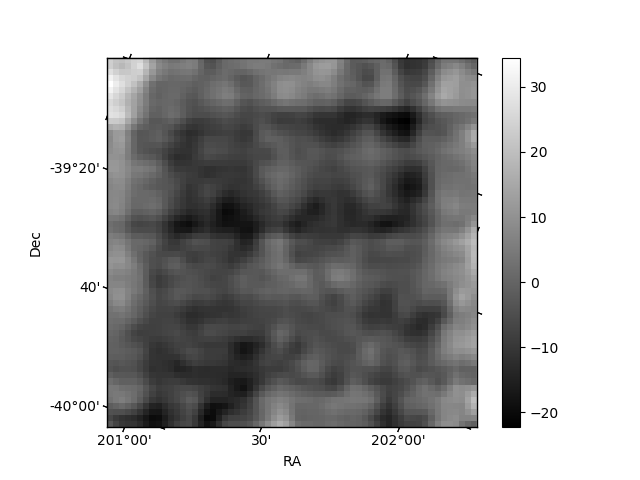
Histogram calculated using DETX and DETY for each event in the final _common_clean file
| Quadrant A | 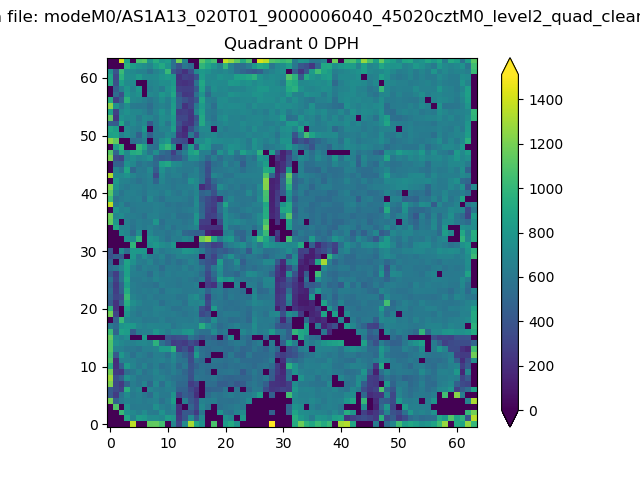 |
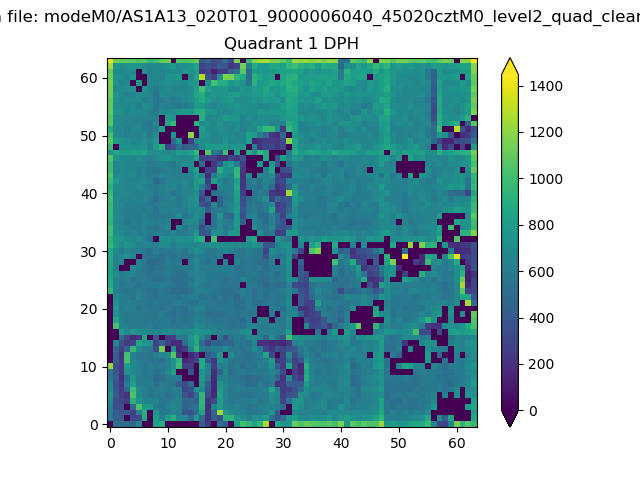 |
Quadrant B |
|---|---|---|---|
| Quadrant D | 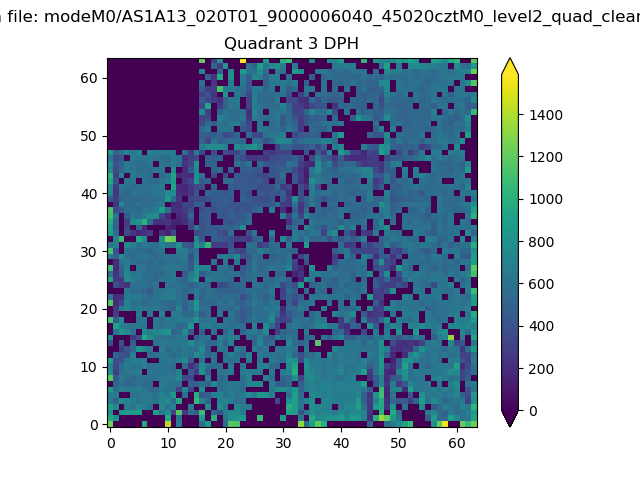 |
 |
Quadrant C |
| Plot type | Count rate plots | Images |
|---|---|---|
| Comparison with Poisson distribution Blue bars denote a histogram of data divided into 1 sec bins. Red curve is a Poisson curve with rate = median count rate of data. |
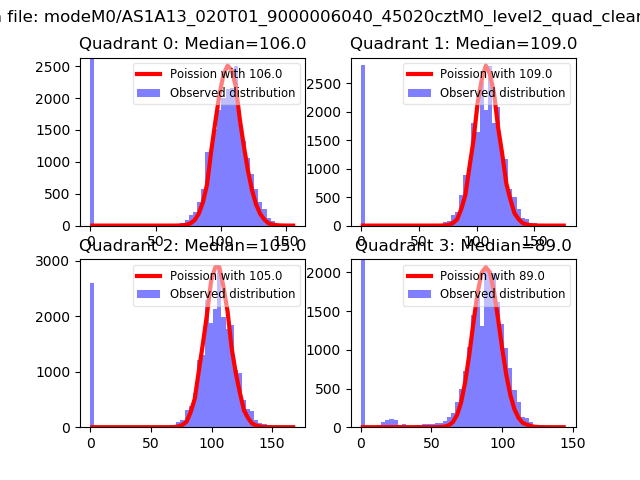 |
 |
| Quadrant-wise count rates Data is divided into 100 sec bins |
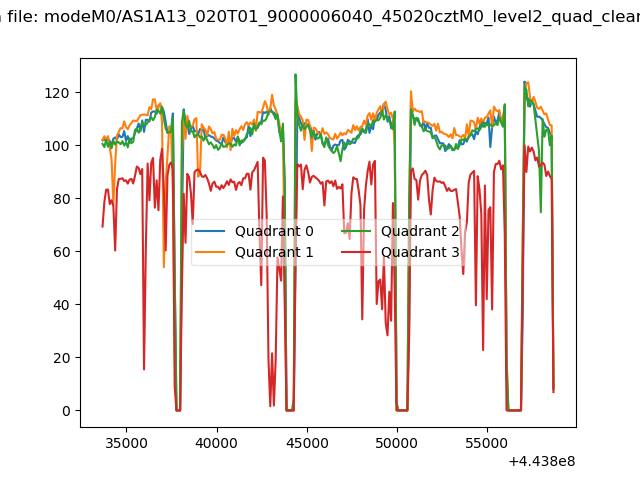 |
|
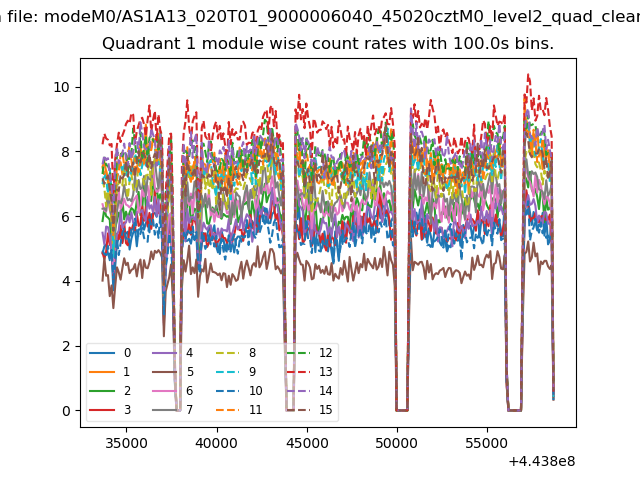
| Module-wise count rates for Quadrant A Data is divided into 100 sec bins |
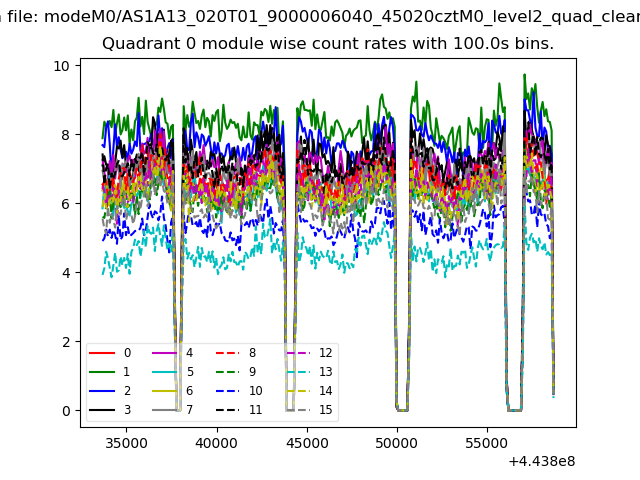 |
 |
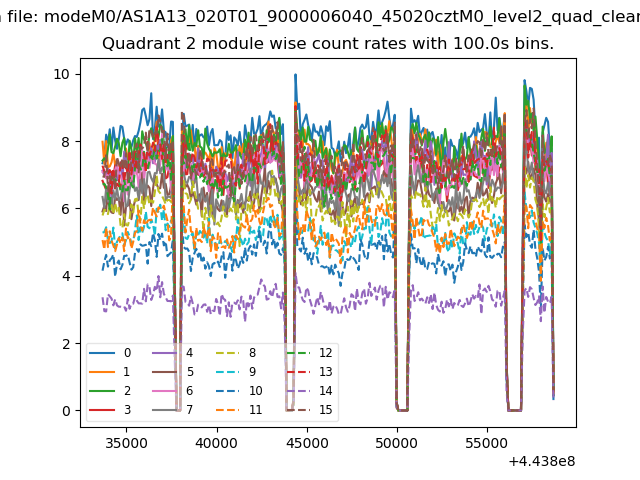
| Module-wise count rates for Quadrant B Data is divided into 100 sec bins |
 |
 |
| Module-wise count rates for Quadrant C Data is divided into 100 sec bins |
 |
 |
| Module-wise count rates for Quadrant D Data is divided into 100 sec bins |
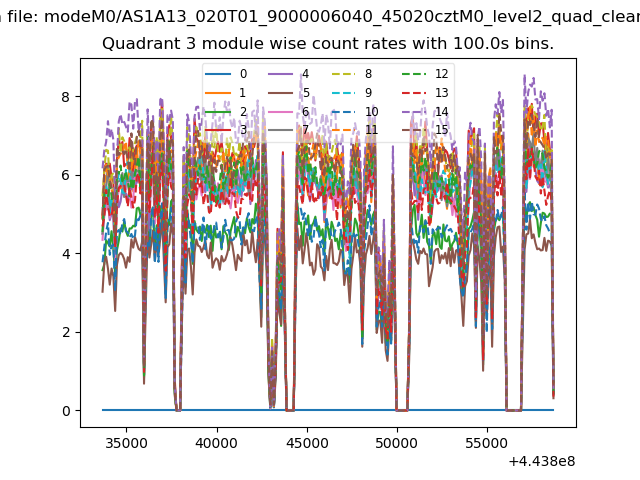 |
 |
| Parameter | Plot |
|---|---|
| CZT HV Monitor | 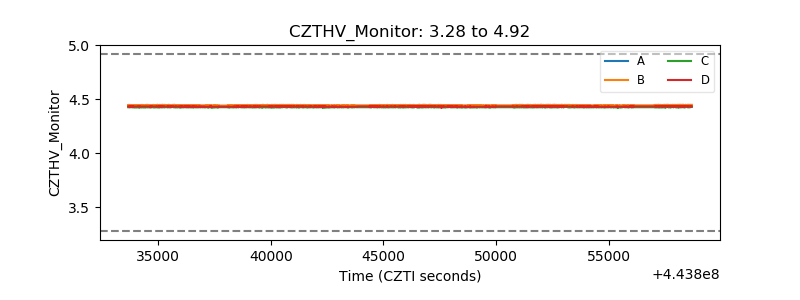 |
| D_VDD | 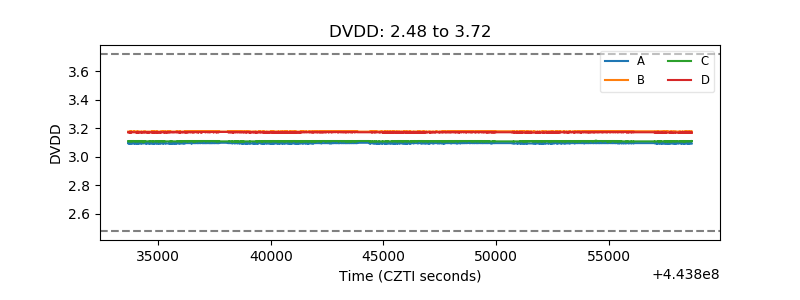 |
| Temperature 1 | 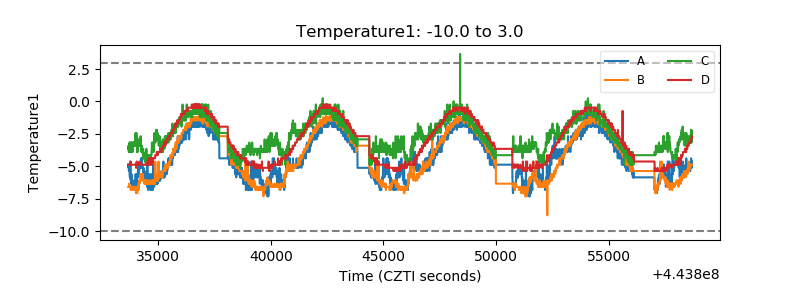 |
| Veto HV Monitor | 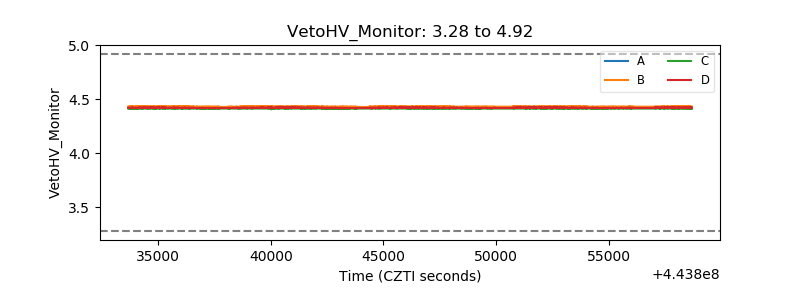 |
| Veto LLD | 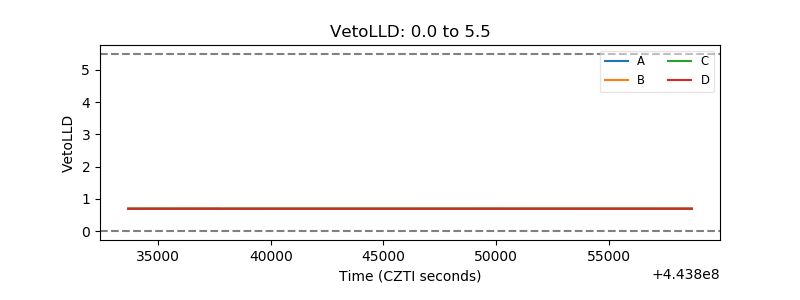 |
| Alpha Counter | 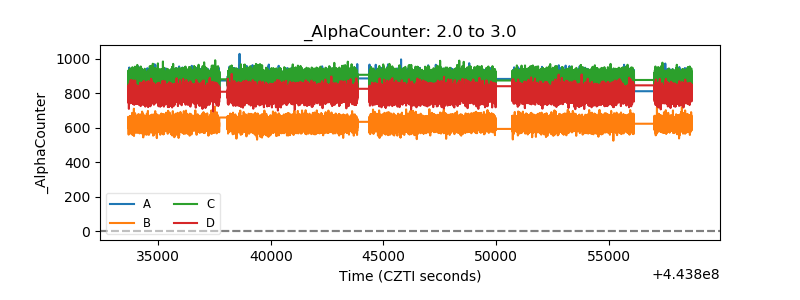 |
| _CPM_Rate | 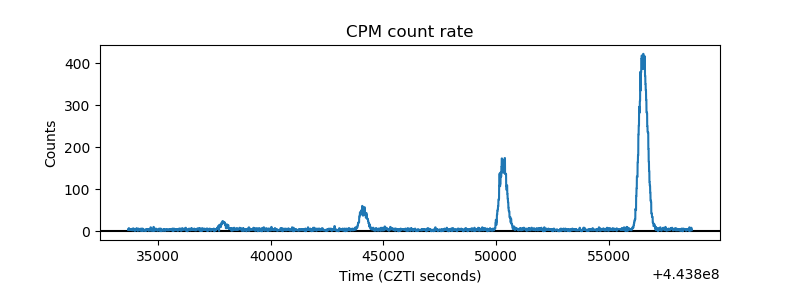 |
| CZT Counter |  |
| +2.5 Volts monitor | 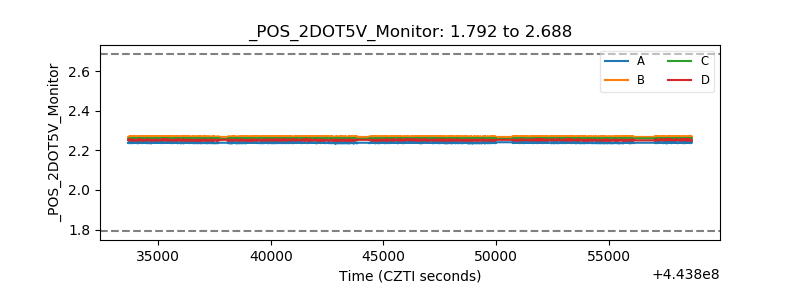 |
| +5 Volts monitor | 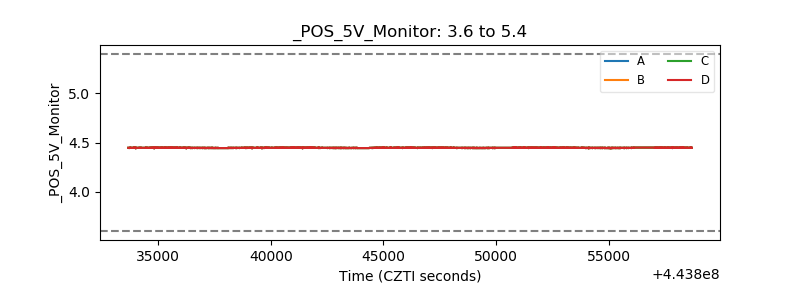 |
| _ROLL_ROT | 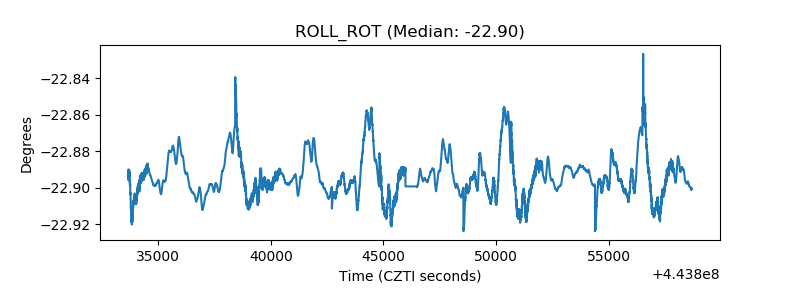 |
| _Roll_DEC | 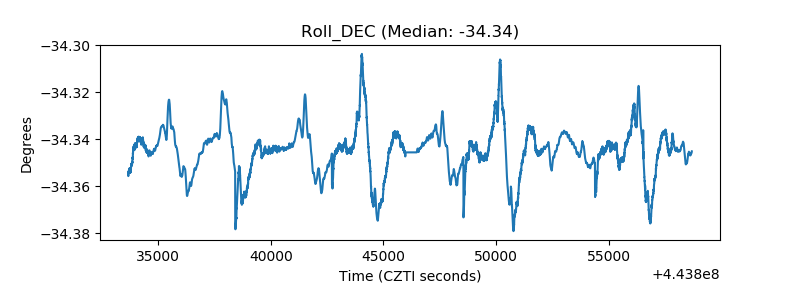 |
| _Roll_RA | 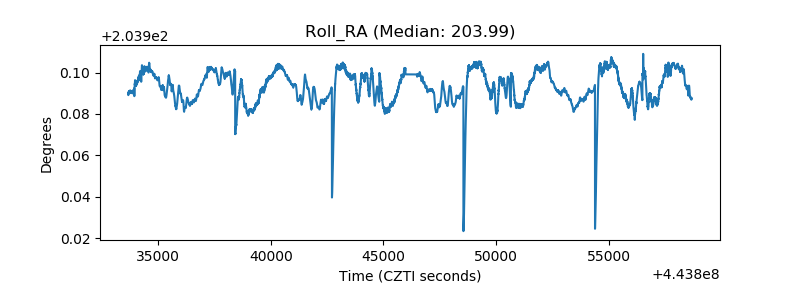 |
| Veto Counter | 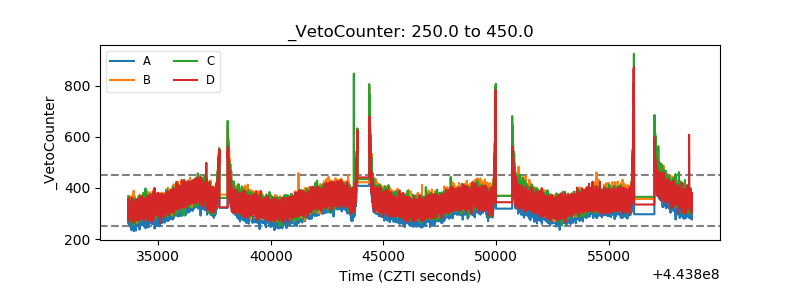 |