| Param | Original file | Final file |
|---|---|---|
| Filename | modeM0/AS1A13_020T01_9000006040_45022cztM0_level2.fits | modeM0/AS1A13_020T01_9000006040_45022cztM0_level2_quad_clean.evt |
| Size (bytes) | 489,165,120 | 96,739,200 |
| Size | 466.5 MB | 92.3 MB |
| Events in quadrant A | 4,737,488 | 655,433 |
| Events in quadrant B | 3,185,159 | 675,472 |
| Events in quadrant C | 3,939,300 | 625,480 |
| Events in quadrant D | 5,782,122 | 555,171 |
| Mode SS | |||
|---|---|---|---|
| Quadrant | BADHDUFLAG | Total packets | Discarded packets |
| A | 0 | 122 | 0 |
| B | 0 | 122 | 0 |
| C | 0 | 122 | 0 |
| D | 0 | 122 | 0 |
| Mode M9 | |||
|---|---|---|---|
| Quadrant | BADHDUFLAG | Total packets | Discarded packets |
| A | 0 | 11 | 0 |
| B | 0 | 11 | 0 |
| C | 0 | 11 | 0 |
| D | 0 | 11 | 0 |
| Mode M0 | |||
|---|---|---|---|
| Quadrant | BADHDUFLAG | Total packets | Discarded packets |
| A | 0 | 18518 | 1 |
| B | 0 | 13476 | 1 |
| C | 0 | 15716 | 1 |
| D | 0 | 21271 | 1 |
| Quadrant | Total seconds | Saturated seconds | Saturation percentage |
|---|---|---|---|
| A | 5974 | 77 | 1.288919% |
| B | 5975 | 102 | 1.707113% |
| C | 5975 | 309 | 5.171548% |
| D | 5975 | 595 | 9.958159% |
Noise dominated data is calculated using 1-second bins in cleaned event files. If a bin has >2000 counts, and if more than 50% of those come from <1% of pixels, then it is considered to be noise-dominated and hence unusable.
| Quadrant | # 1 sec bins | Bins with >0 counts | Bins with >2000 counts | High rate bins dominated by noise | Noise dominated (total time) | Noise dominated (detector-on time) | Marked lightcurve |
|---|---|---|---|---|---|---|---|
| A | 7029 | 5975 | 0 | 0 | 0.00% | 0.00% | 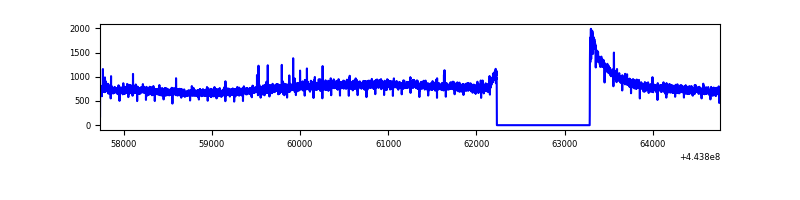 |
| B | 7030 | 5976 | 51 | 51 | 0.73% | 0.85% | 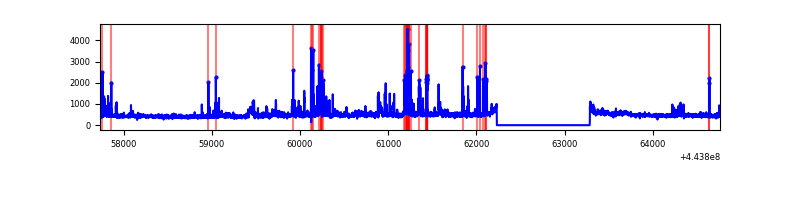 |
| C | 7030 | 5976 | 246 | 246 | 3.50% | 4.12% | 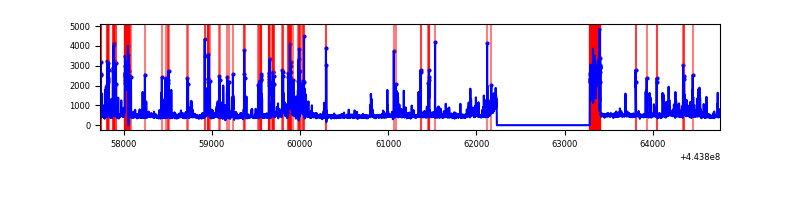 |
| D | 7030 | 5976 | 547 | 547 | 7.78% | 9.15% | 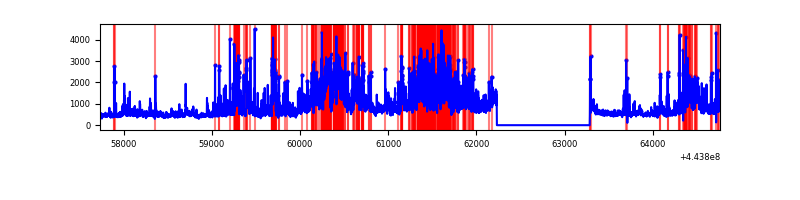 |
Top three noisy pixels from each quadrant. If the there are fewer than three noisy pixels in the level2.evt file, extra rows are filled as -1
| Pixel properties | Quadrant properties | ||||||
|---|---|---|---|---|---|---|---|
| Quadrant | DetID | PixID | Counts | Sigma | Mean | Median | Sigma |
| A | 10 | 83 | 2105933 | 14981.71 | 677 | 661 | 140.5 |
| A | 13 | 248 | 9469 | 62.68 | 677 | 661 | 140.5 |
| A | 3 | 137 | 7474 | 48.48 | 677 | 661 | 140.5 |
| B | 0 | 189 | 262496 | 1973.97 | 669 | 649 | 132.6 |
| B | 4 | 171 | 75378 | 563.35 | 669 | 649 | 132.6 |
| B | 5 | 255 | 63512 | 473.9 | 669 | 649 | 132.6 |
| C | 14 | 254 | 1203270 | 7816.06 | 652 | 655 | 153.9 |
| C | 1 | 3 | 159647 | 1033.32 | 652 | 655 | 153.9 |
| C | 3 | 233 | 27972 | 177.54 | 652 | 655 | 153.9 |
| D | 5 | 222 | 987931 | 6025.37 | 648 | 628 | 163.9 |
| D | 11 | 241 | 607385 | 3702.95 | 648 | 628 | 163.9 |
| D | 13 | 187 | 423644 | 2581.61 | 648 | 628 | 163.9 |
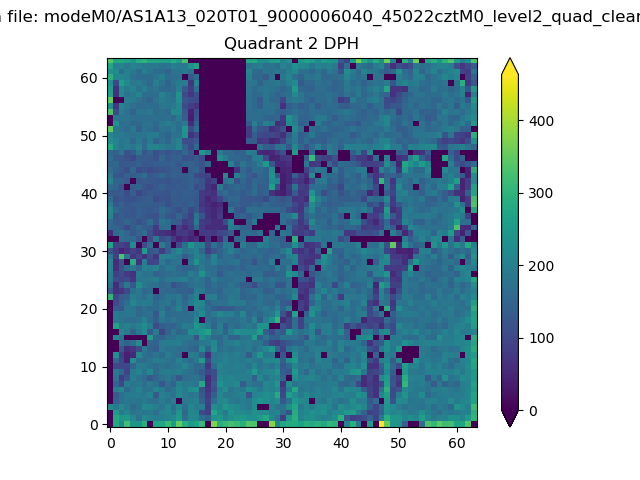
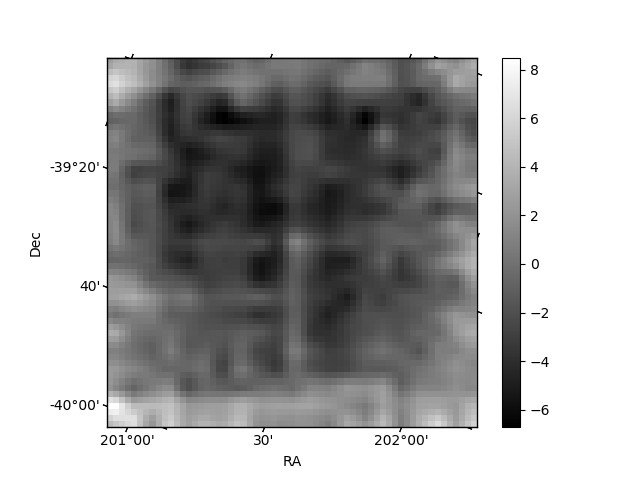
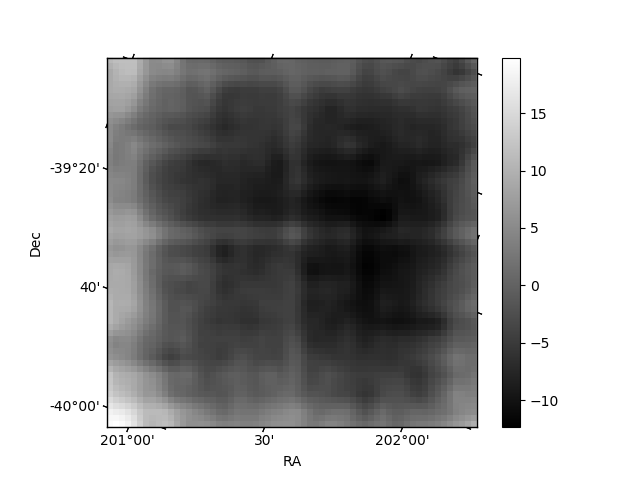
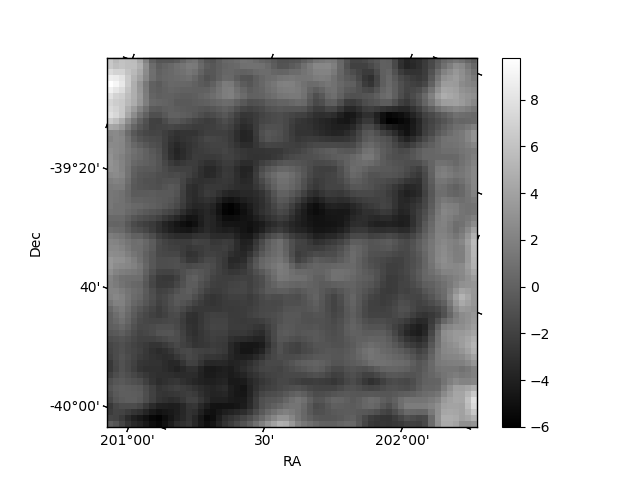
Histogram calculated using DETX and DETY for each event in the final _common_clean file
| Quadrant A | 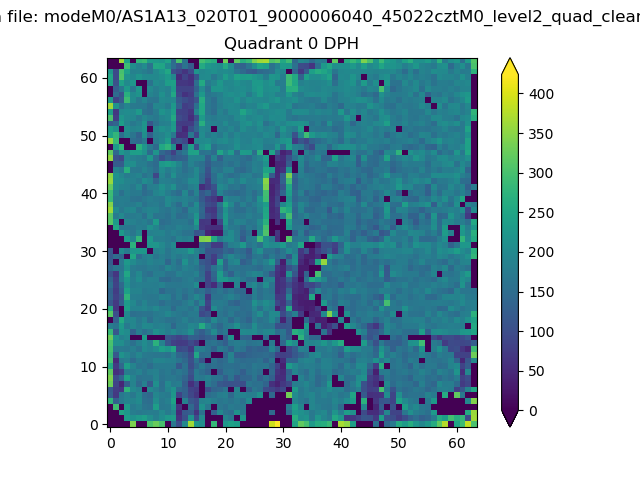 |
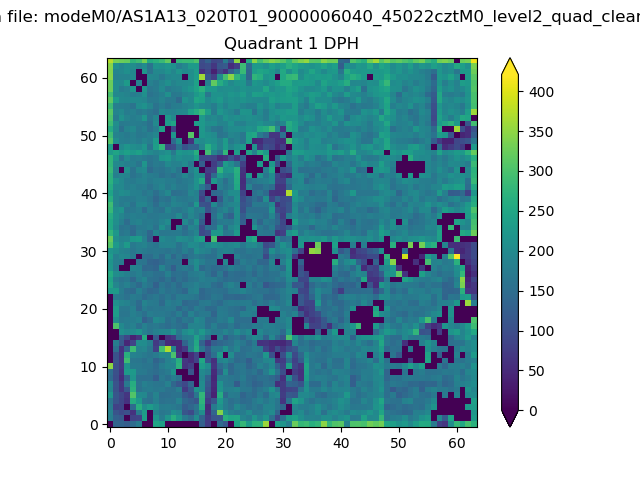 |
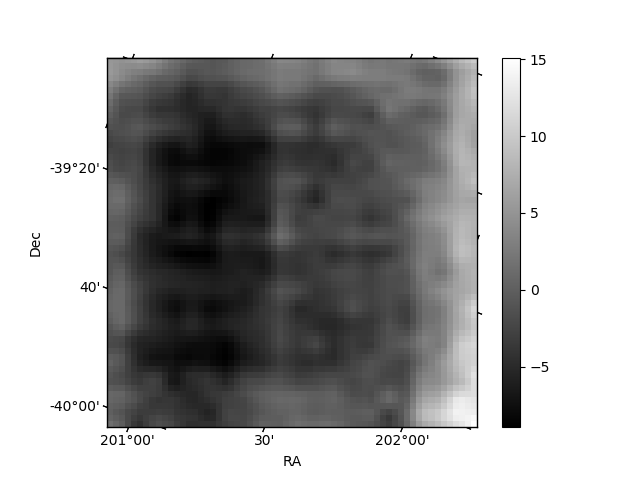
Quadrant B |
|---|---|---|---|
| Quadrant D | 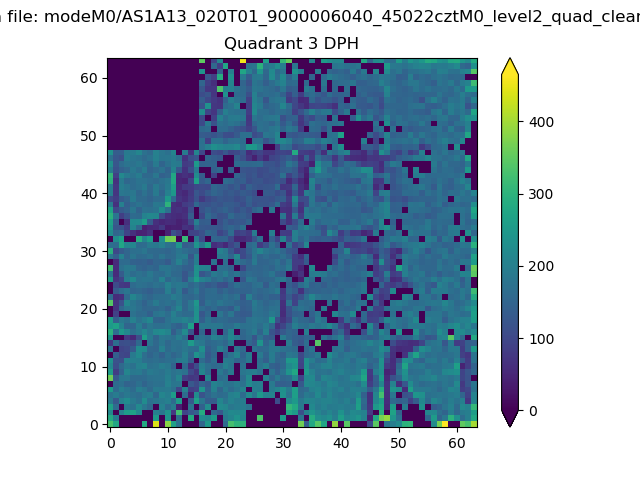 |
 |
Quadrant C |
| Plot type | Count rate plots | Images |
|---|---|---|
| Comparison with Poisson distribution Blue bars denote a histogram of data divided into 1 sec bins. Red curve is a Poisson curve with rate = median count rate of data. |
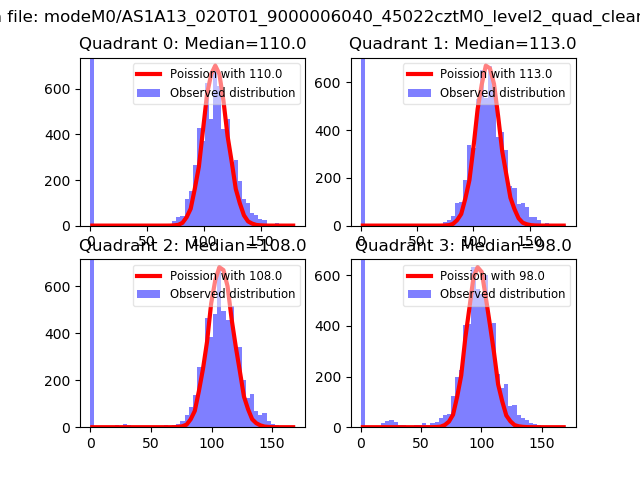 |
 |
| Quadrant-wise count rates Data is divided into 100 sec bins |
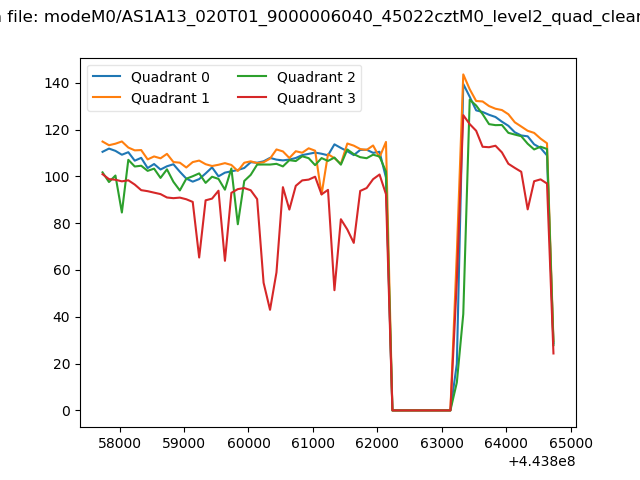 |
|
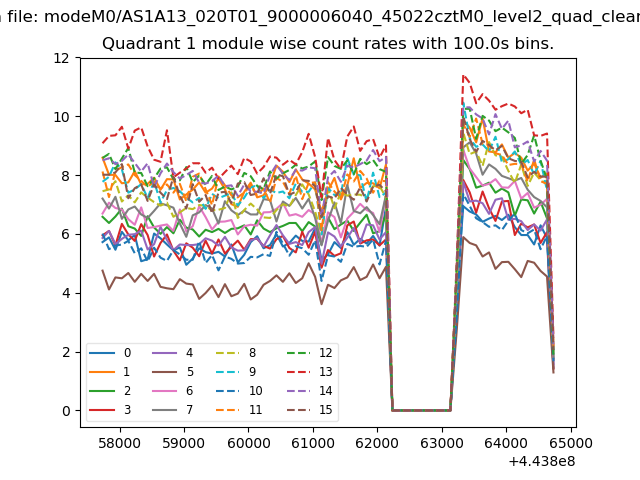
| Module-wise count rates for Quadrant A Data is divided into 100 sec bins |
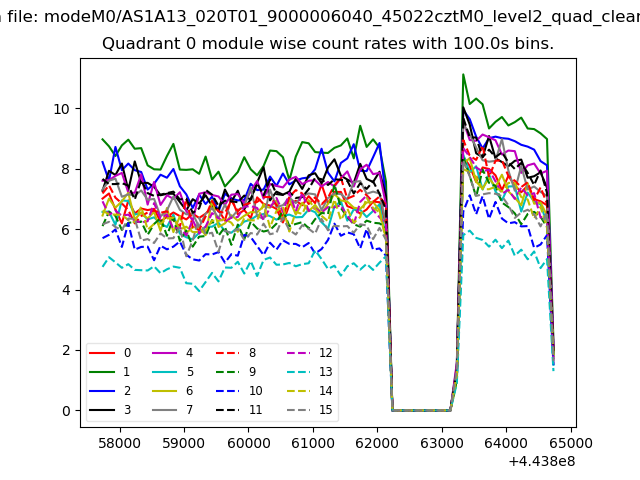 |
 |
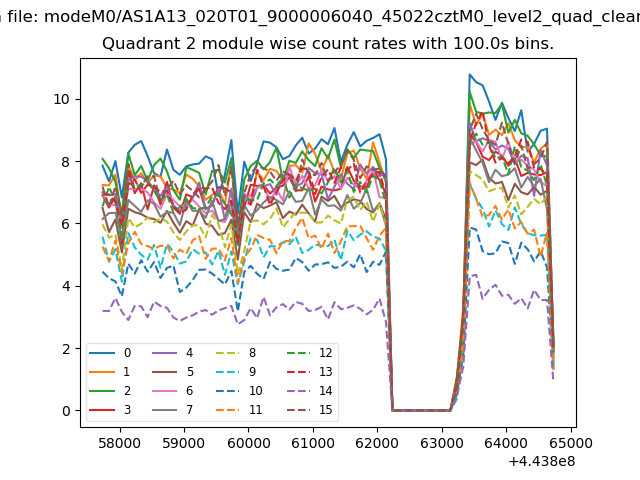
| Module-wise count rates for Quadrant B Data is divided into 100 sec bins |
 |
 |
| Module-wise count rates for Quadrant C Data is divided into 100 sec bins |
 |
 |
| Module-wise count rates for Quadrant D Data is divided into 100 sec bins |
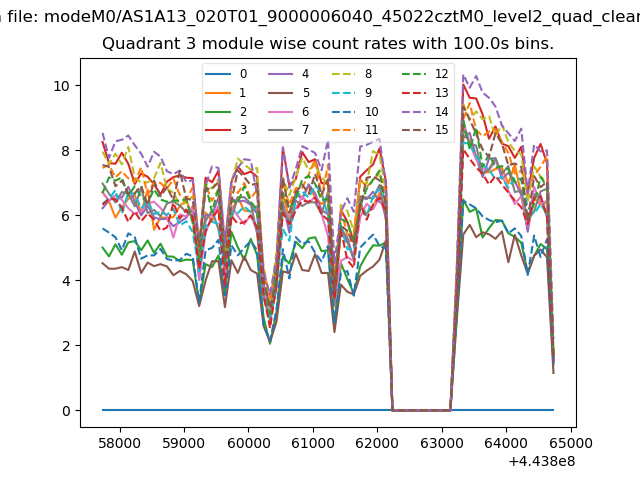 |
 |
| Parameter | Plot |
|---|---|
| CZT HV Monitor | 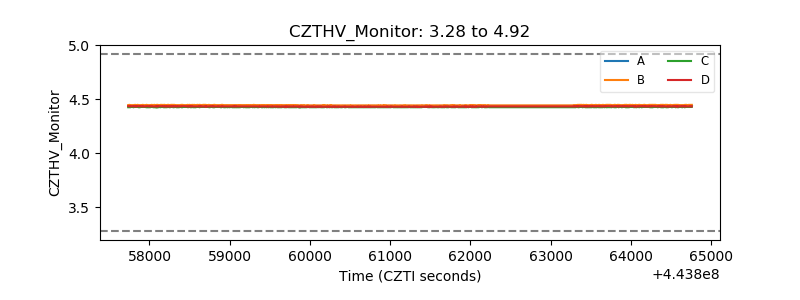 |
| D_VDD | 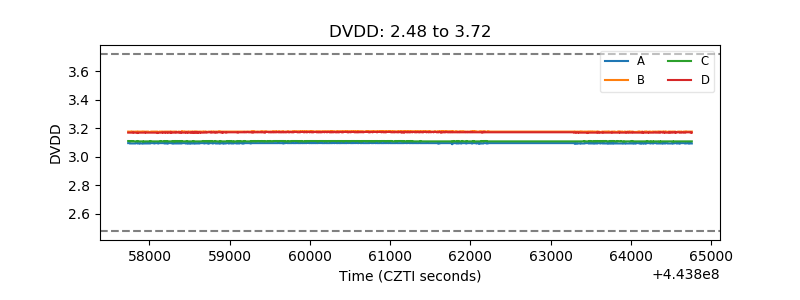 |
| Temperature 1 | 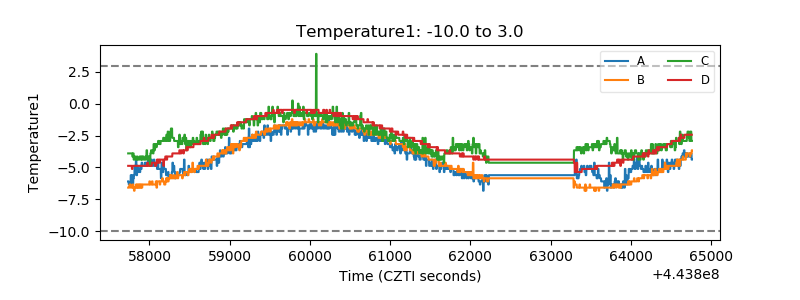 |
| Veto HV Monitor | 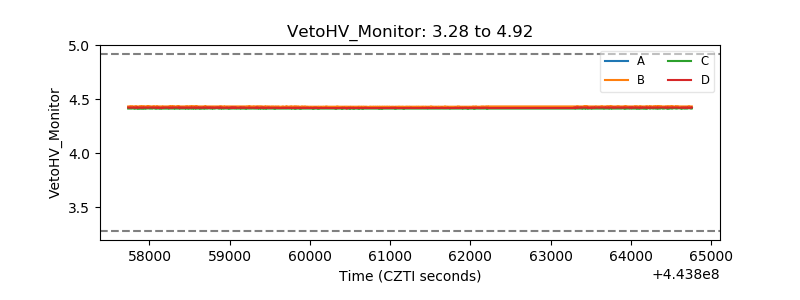 |
| Veto LLD | 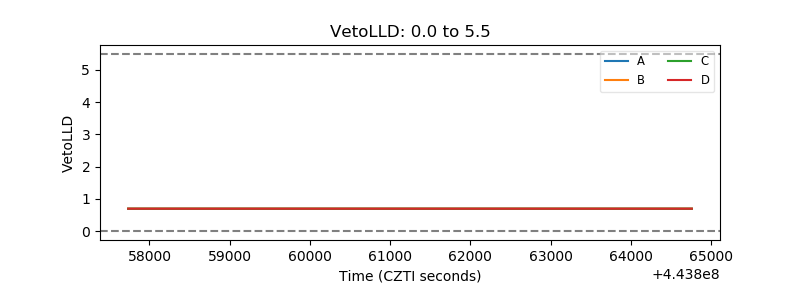 |
| Alpha Counter | 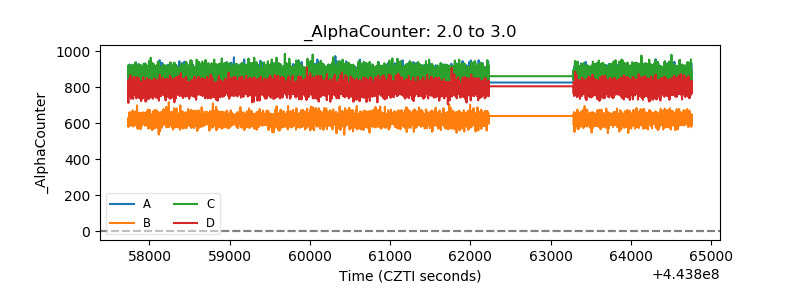 |
| _CPM_Rate | 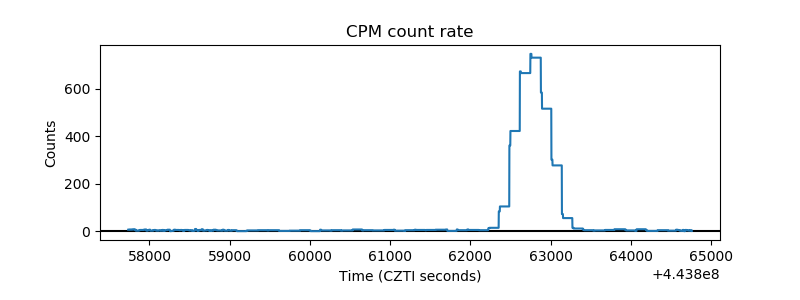 |
| CZT Counter | 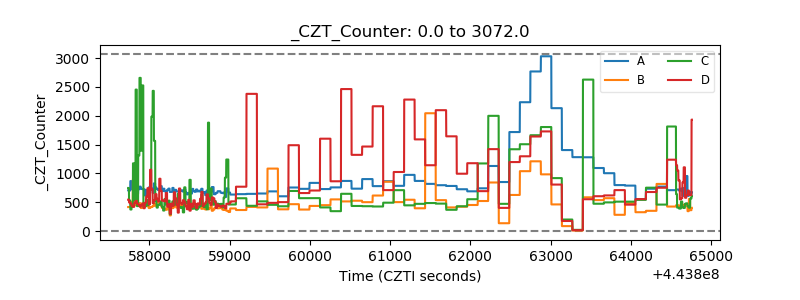 |
| +2.5 Volts monitor | 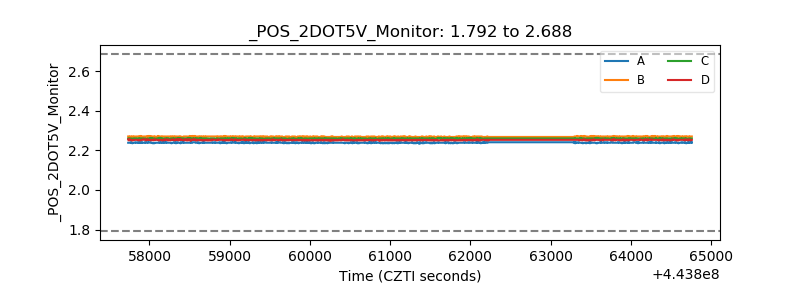 |
| +5 Volts monitor | 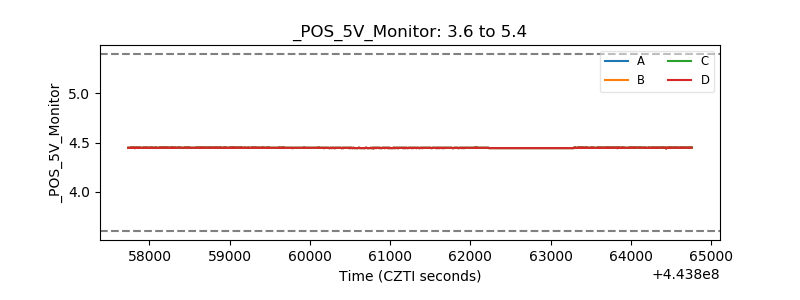 |
| _ROLL_ROT | 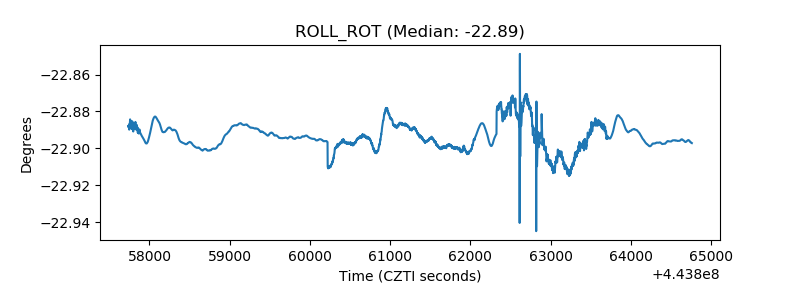 |
| _Roll_DEC | 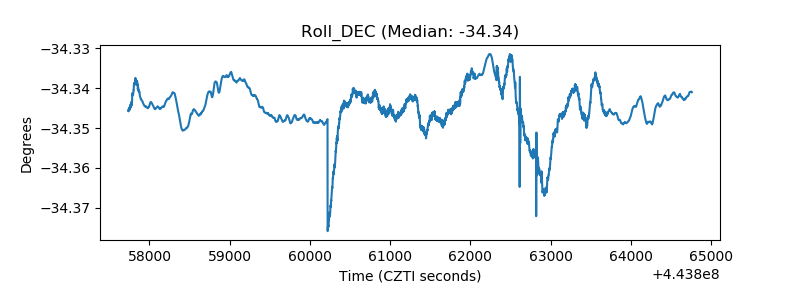 |
| _Roll_RA | 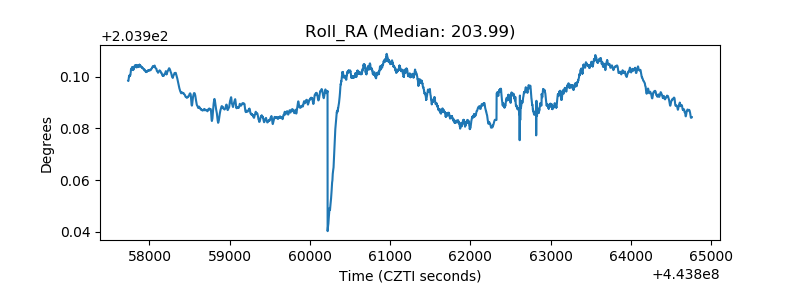 |
| Veto Counter | 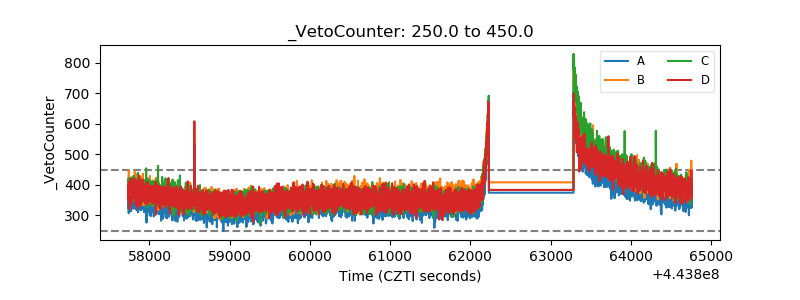 |