| Param | Original file | Final file |
|---|---|---|
| Filename | modeM0/AS1A13_020T01_9000006040_45023cztM0_level2.fits | modeM0/AS1A13_020T01_9000006040_45023cztM0_level2_quad_clean.evt |
| Size (bytes) | 504,299,520 | 99,679,680 |
| Size | 480.9 MB | 95.1 MB |
| Events in quadrant A | 4,846,180 | 679,003 |
| Events in quadrant B | 3,492,090 | 699,410 |
| Events in quadrant C | 3,085,967 | 680,053 |
| Events in quadrant D | 6,781,094 | 543,207 |
| Mode SS | |||
|---|---|---|---|
| Quadrant | BADHDUFLAG | Total packets | Discarded packets |
| A | 0 | 122 | 0 |
| B | 0 | 122 | 0 |
| C | 0 | 122 | 0 |
| D | 0 | 122 | 0 |
| Mode M9 | |||
|---|---|---|---|
| Quadrant | BADHDUFLAG | Total packets | Discarded packets |
| A | 0 | 11 | 0 |
| B | 0 | 11 | 0 |
| C | 0 | 11 | 0 |
| D | 0 | 11 | 0 |
| Mode M0 | |||
|---|---|---|---|
| Quadrant | BADHDUFLAG | Total packets | Discarded packets |
| A | 0 | 18606 | 1 |
| B | 0 | 14316 | 2 |
| C | 0 | 13229 | 1 |
| D | 0 | 24284 | 1 |
| Quadrant | Total seconds | Saturated seconds | Saturation percentage |
|---|---|---|---|
| A | 5960 | 125 | 2.097315% |
| B | 5960 | 176 | 2.953020% |
| C | 5960 | 112 | 1.879195% |
| D | 5960 | 1011 | 16.963087% |
Noise dominated data is calculated using 1-second bins in cleaned event files. If a bin has >2000 counts, and if more than 50% of those come from <1% of pixels, then it is considered to be noise-dominated and hence unusable.
| Quadrant | # 1 sec bins | Bins with >0 counts | Bins with >2000 counts | High rate bins dominated by noise | Noise dominated (total time) | Noise dominated (detector-on time) | Marked lightcurve |
|---|---|---|---|---|---|---|---|
| A | 7081 | 5961 | 4 | 4 | 0.06% | 0.07% | 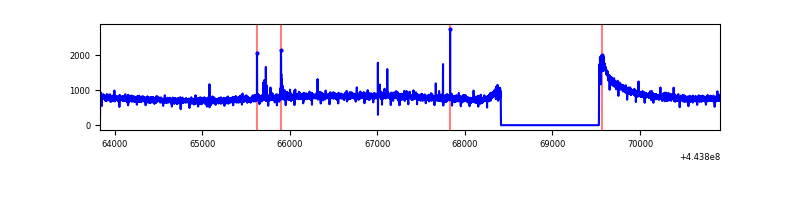 |
| B | 7081 | 5961 | 72 | 72 | 1.02% | 1.21% | 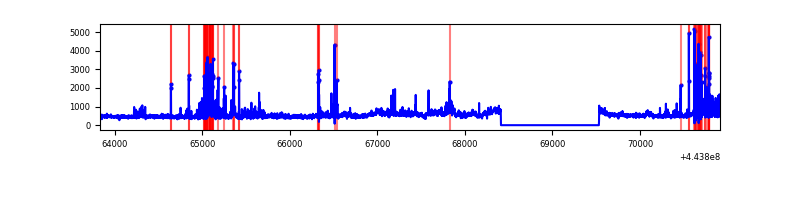 |
| C | 7081 | 5961 | 55 | 55 | 0.78% | 0.92% | 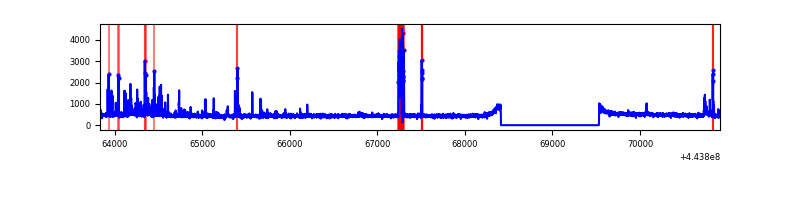 |
| D | 7081 | 5961 | 844 | 844 | 11.92% | 14.16% | 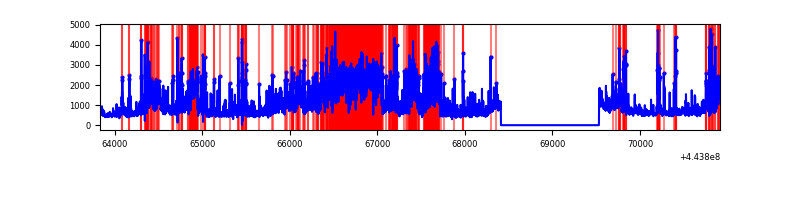 |
Top three noisy pixels from each quadrant. If the there are fewer than three noisy pixels in the level2.evt file, extra rows are filled as -1
| Pixel properties | Quadrant properties | ||||||
|---|---|---|---|---|---|---|---|
| Quadrant | DetID | PixID | Counts | Sigma | Mean | Median | Sigma |
| A | 10 | 83 | 2101443 | 14500.35 | 700 | 684 | 144.9 |
| A | 13 | 248 | 20230 | 134.91 | 700 | 684 | 144.9 |
| A | 0 | 243 | 19611 | 130.64 | 700 | 684 | 144.9 |
| B | 0 | 183 | 226513 | 1649.37 | 689 | 666 | 136.9 |
| B | 0 | 189 | 210254 | 1530.63 | 689 | 666 | 136.9 |
| B | 5 | 172 | 145396 | 1056.97 | 689 | 666 | 136.9 |
| C | 14 | 254 | 203741 | 1255.76 | 690 | 692 | 161.7 |
| C | 1 | 3 | 178621 | 1100.4 | 690 | 692 | 161.7 |
| C | 3 | 233 | 8717 | 49.63 | 690 | 692 | 161.7 |
| D | 5 | 222 | 1575840 | 9576.06 | 657 | 637 | 164.5 |
| D | 5 | 235 | 617047 | 3747.31 | 657 | 637 | 164.5 |
| D | 11 | 241 | 486351 | 2952.78 | 657 | 637 | 164.5 |
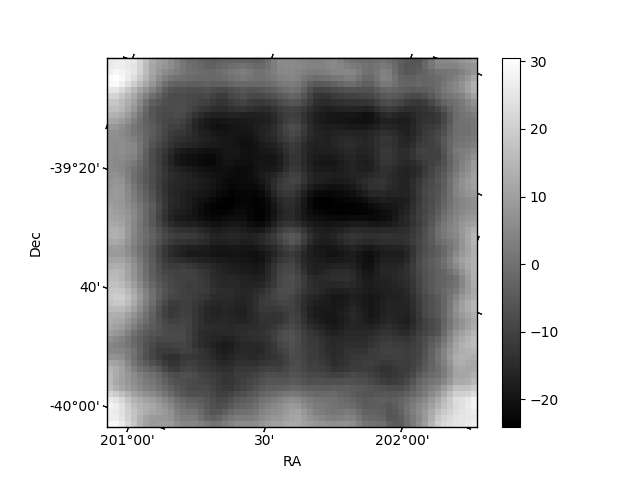
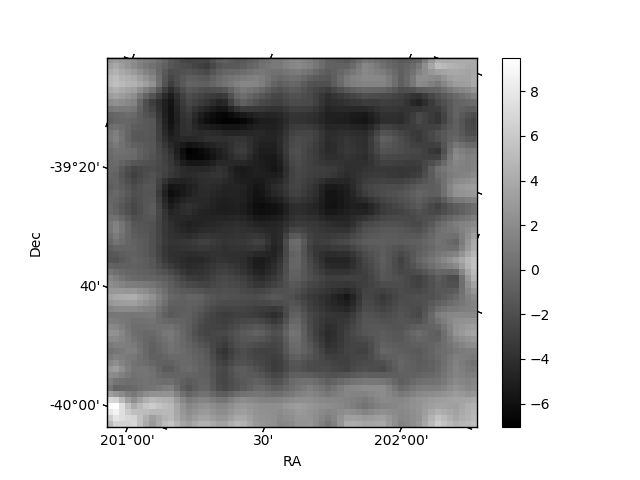
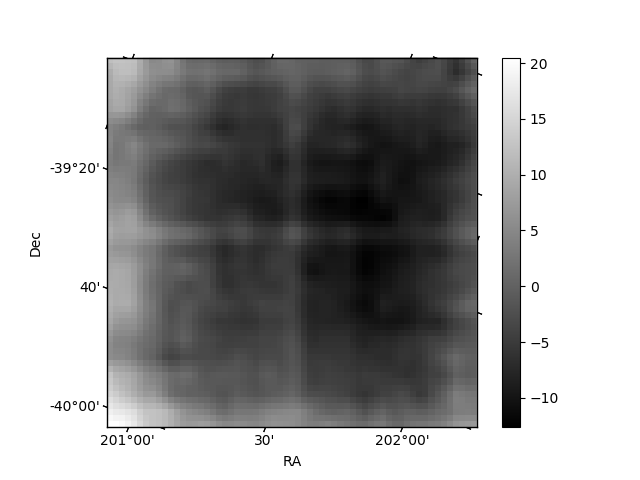
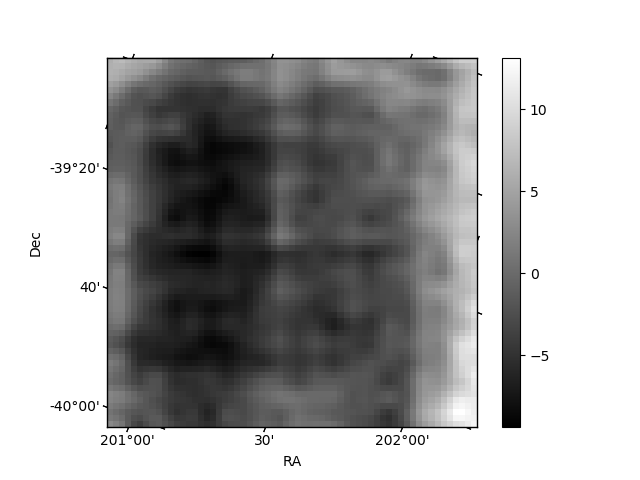
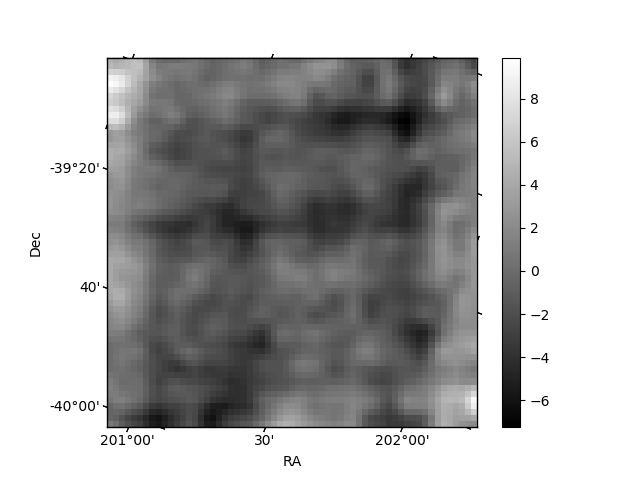
Histogram calculated using DETX and DETY for each event in the final _common_clean file
| Quadrant A | 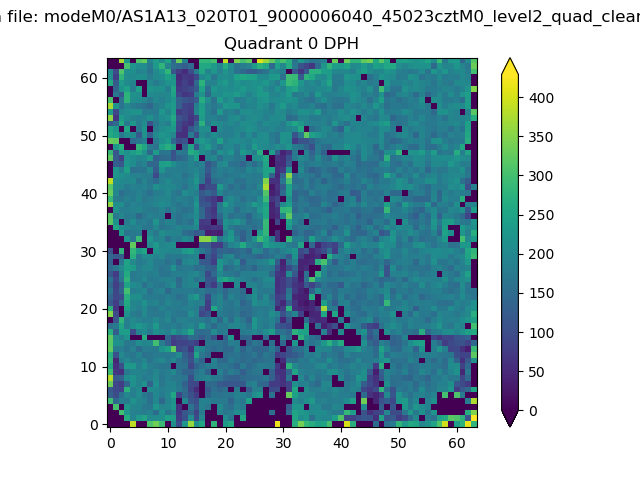 |
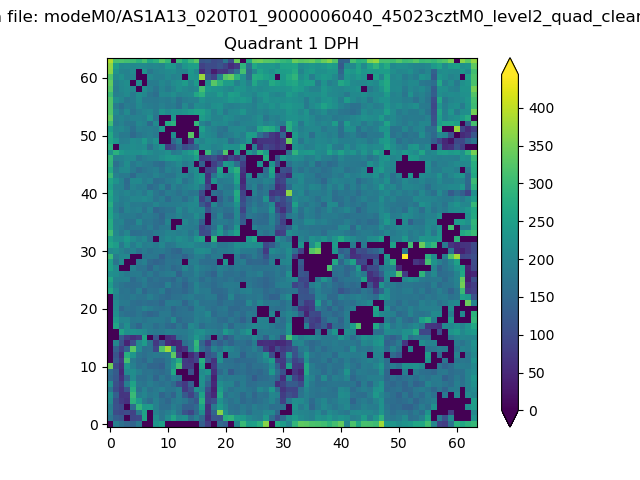 |
Quadrant B |
|---|---|---|---|
| Quadrant D |  |
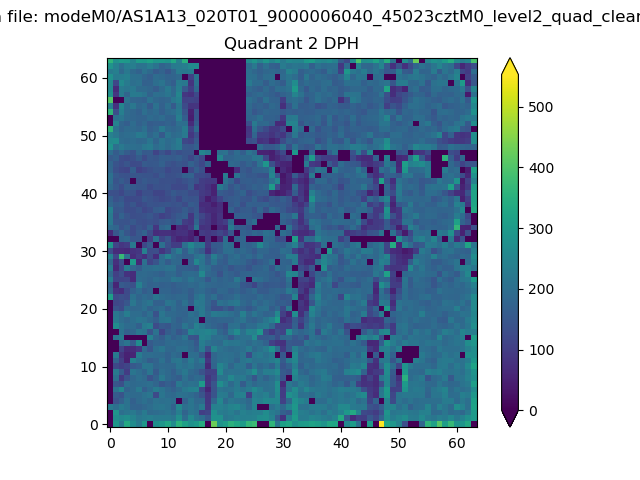 |
Quadrant C |
| Plot type | Count rate plots | Images |
|---|---|---|
| Comparison with Poisson distribution Blue bars denote a histogram of data divided into 1 sec bins. Red curve is a Poisson curve with rate = median count rate of data. |
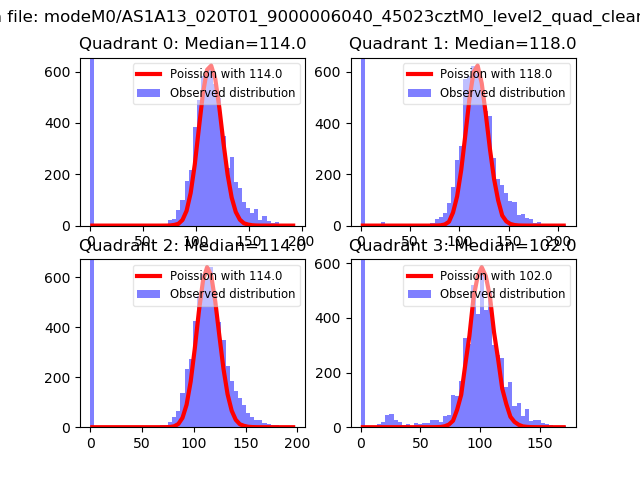 |
 |
| Quadrant-wise count rates Data is divided into 100 sec bins |
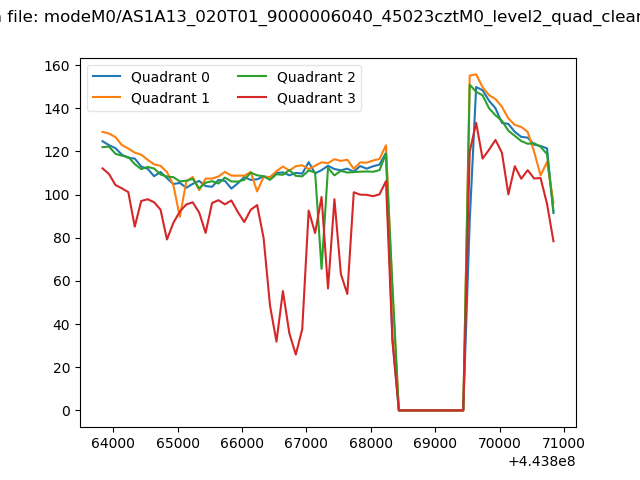 |
|
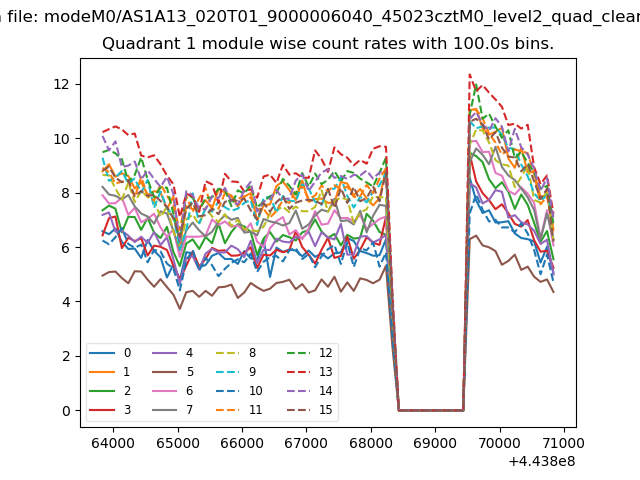
| Module-wise count rates for Quadrant A Data is divided into 100 sec bins |
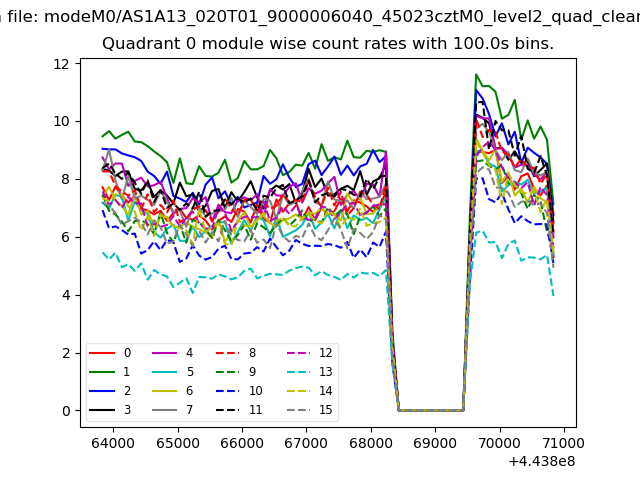 |
 |
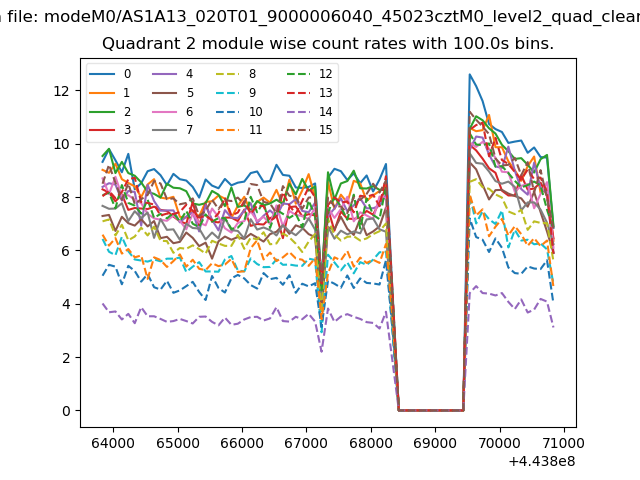
| Module-wise count rates for Quadrant B Data is divided into 100 sec bins |
 |
 |
| Module-wise count rates for Quadrant C Data is divided into 100 sec bins |
 |
 |
| Module-wise count rates for Quadrant D Data is divided into 100 sec bins |
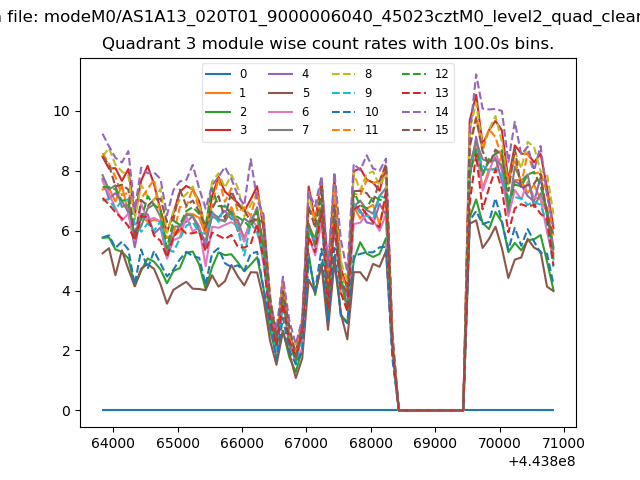 |
 |
| Parameter | Plot |
|---|---|
| CZT HV Monitor |  |
| D_VDD | 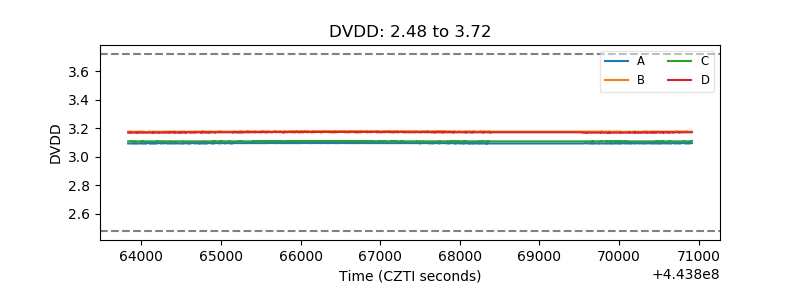 |
| Temperature 1 | 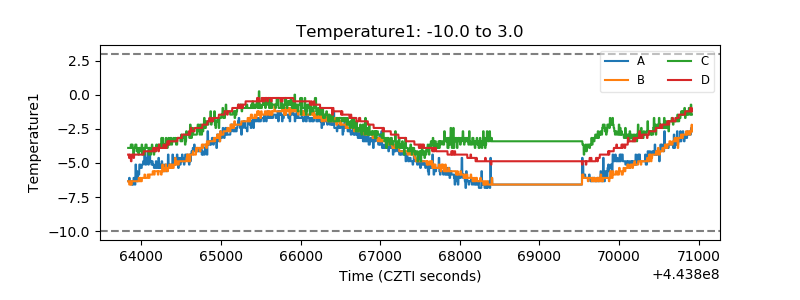 |
| Veto HV Monitor | 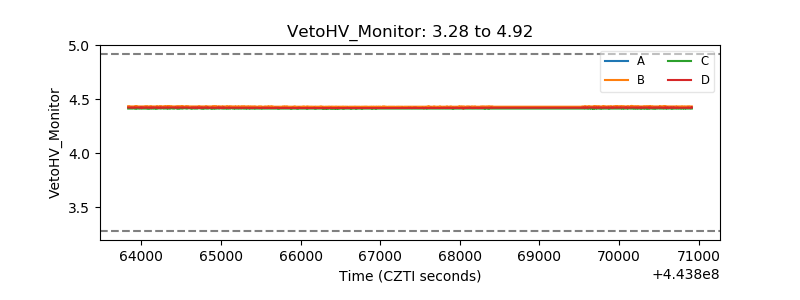 |
| Veto LLD | 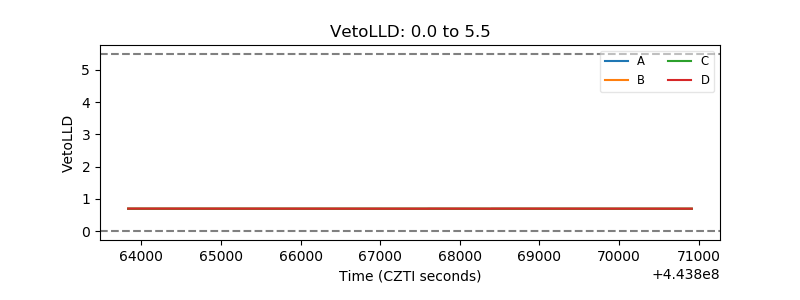 |
| Alpha Counter | 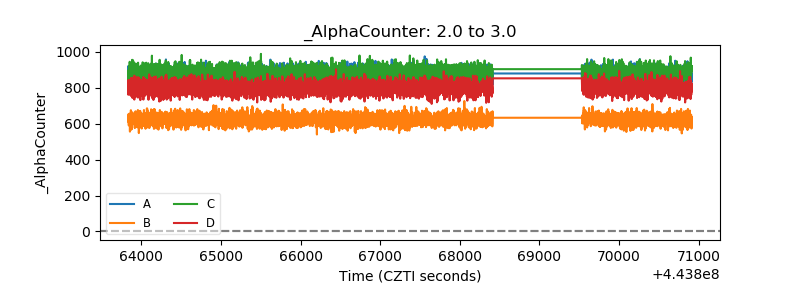 |
| _CPM_Rate | 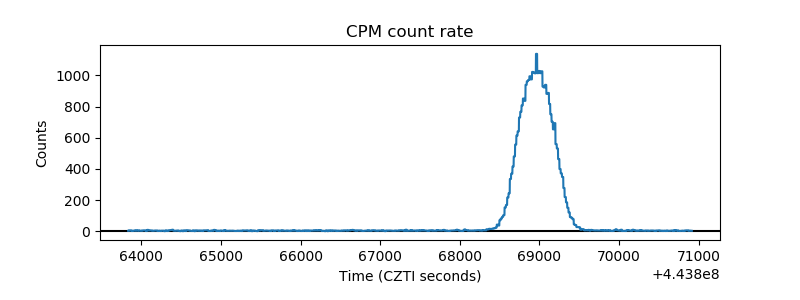 |
| CZT Counter | 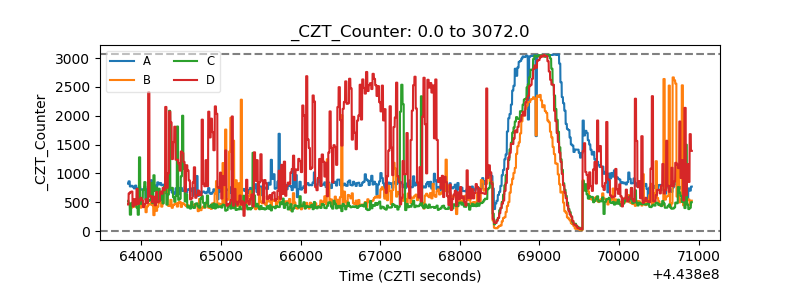 |
| +2.5 Volts monitor | 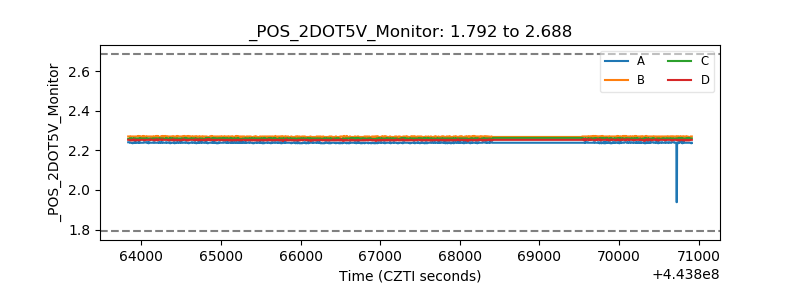 |
| +5 Volts monitor | 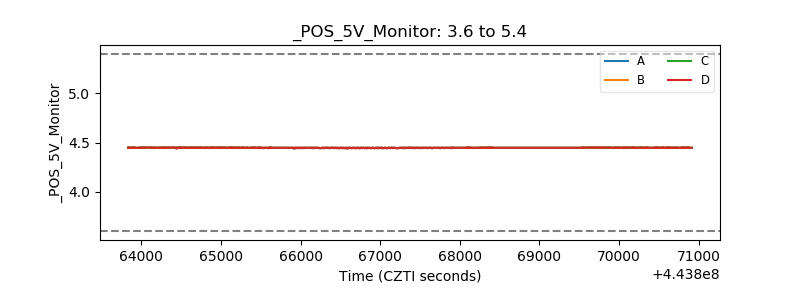 |
| _ROLL_ROT |  |
| _Roll_DEC | 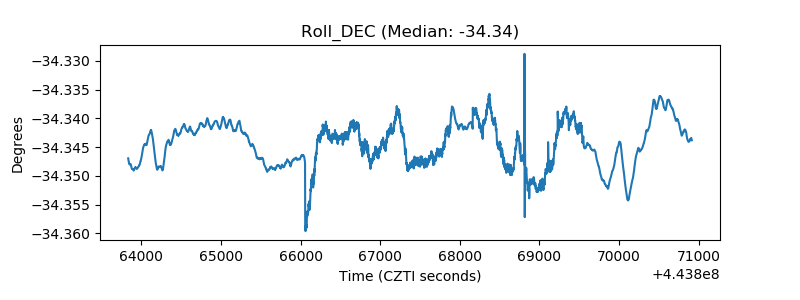 |
| _Roll_RA | 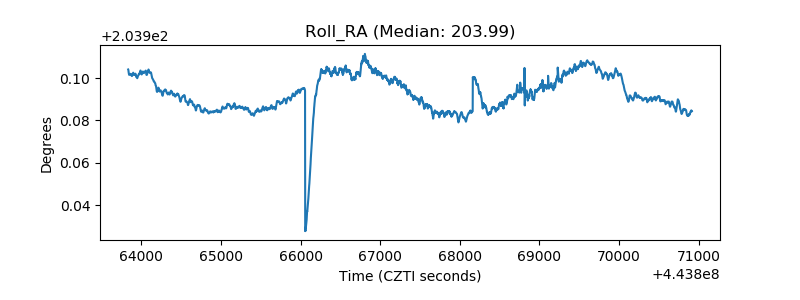 |
| Veto Counter | 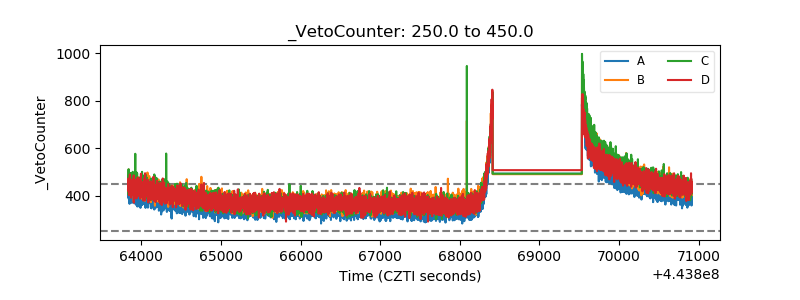 |