| Param | Original file | Final file |
|---|---|---|
| Filename | modeM0/AS1A13_020T01_9000006040_45024cztM0_level2.fits | modeM0/AS1A13_020T01_9000006040_45024cztM0_level2_quad_clean.evt |
| Size (bytes) | 533,255,040 | 102,182,400 |
| Size | 508.6 MB | 97.4 MB |
| Events in quadrant A | 5,079,420 | 712,705 |
| Events in quadrant B | 3,868,914 | 727,645 |
| Events in quadrant C | 3,029,569 | 708,214 |
| Events in quadrant D | 7,296,948 | 527,261 |
| Mode SS | |||
|---|---|---|---|
| Quadrant | BADHDUFLAG | Total packets | Discarded packets |
| A | 0 | 122 | 0 |
| B | 0 | 122 | 0 |
| C | 0 | 122 | 0 |
| D | 0 | 122 | 0 |
| Mode M9 | |||
|---|---|---|---|
| Quadrant | BADHDUFLAG | Total packets | Discarded packets |
| A | 0 | 12 | 0 |
| B | 0 | 12 | 0 |
| C | 0 | 12 | 0 |
| D | 0 | 12 | 0 |
| Mode M0 | |||
|---|---|---|---|
| Quadrant | BADHDUFLAG | Total packets | Discarded packets |
| A | 0 | 18938 | 1 |
| B | 0 | 15384 | 3 |
| C | 0 | 12920 | 1 |
| D | 0 | 25918 | 1 |
| Quadrant | Total seconds | Saturated seconds | Saturation percentage |
|---|---|---|---|
| A | 5988 | 175 | 2.922512% |
| B | 5987 | 218 | 3.641223% |
| C | 5988 | 131 | 2.187709% |
| D | 5988 | 1389 | 23.196393% |
Noise dominated data is calculated using 1-second bins in cleaned event files. If a bin has >2000 counts, and if more than 50% of those come from <1% of pixels, then it is considered to be noise-dominated and hence unusable.
| Quadrant | # 1 sec bins | Bins with >0 counts | Bins with >2000 counts | High rate bins dominated by noise | Noise dominated (total time) | Noise dominated (detector-on time) | Marked lightcurve |
|---|---|---|---|---|---|---|---|
| A | 7163 | 5989 | 10 | 10 | 0.14% | 0.17% | 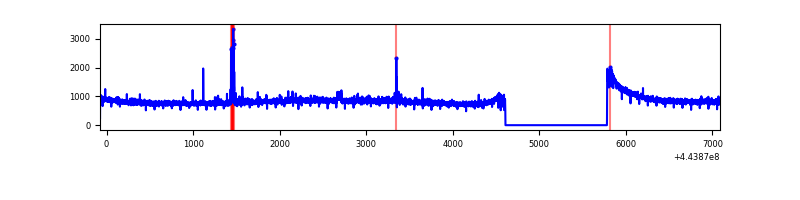 |
| B | 7162 | 5988 | 84 | 84 | 1.17% | 1.40% | 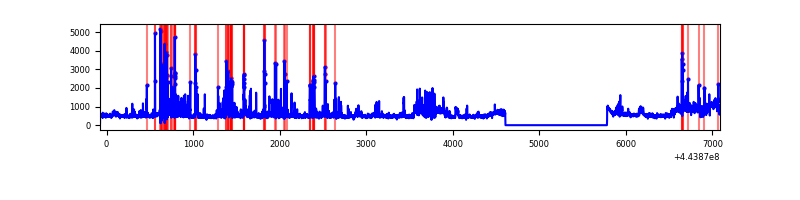 |
| C | 7163 | 5989 | 56 | 56 | 0.78% | 0.94% | 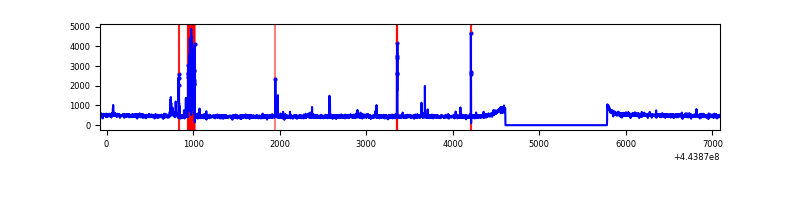 |
| D | 7163 | 5989 | 1221 | 1221 | 17.05% | 20.39% | 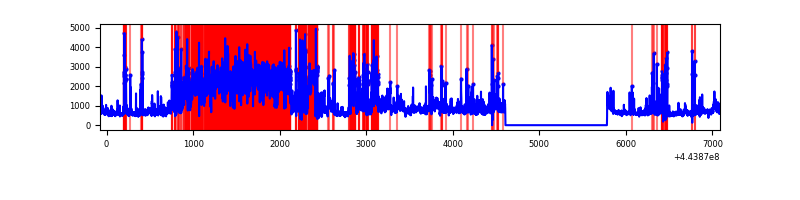 |
Top three noisy pixels from each quadrant. If the there are fewer than three noisy pixels in the level2.evt file, extra rows are filled as -1
| Pixel properties | Quadrant properties | ||||||
|---|---|---|---|---|---|---|---|
| Quadrant | DetID | PixID | Counts | Sigma | Mean | Median | Sigma |
| A | 10 | 83 | 2193996 | 14627.74 | 724 | 708 | 149.9 |
| A | 13 | 248 | 39648 | 259.7 | 724 | 708 | 149.9 |
| A | 0 | 243 | 27759 | 180.41 | 724 | 708 | 149.9 |
| B | 0 | 183 | 313566 | 2243.76 | 713 | 694 | 139.4 |
| B | 0 | 189 | 297525 | 2128.72 | 713 | 694 | 139.4 |
| B | 5 | 255 | 122271 | 871.89 | 713 | 694 | 139.4 |
| C | 1 | 3 | 233491 | 1396.92 | 712 | 718 | 166.6 |
| C | 12 | 2 | 14295 | 81.48 | 712 | 718 | 166.6 |
| C | 3 | 233 | 5818 | 30.61 | 712 | 718 | 166.6 |
| D | 12 | 233 | 2041826 | 12073.38 | 666 | 647 | 169.1 |
| D | 11 | 241 | 962570 | 5689.69 | 666 | 647 | 169.1 |
| D | 13 | 187 | 357845 | 2112.79 | 666 | 647 | 169.1 |
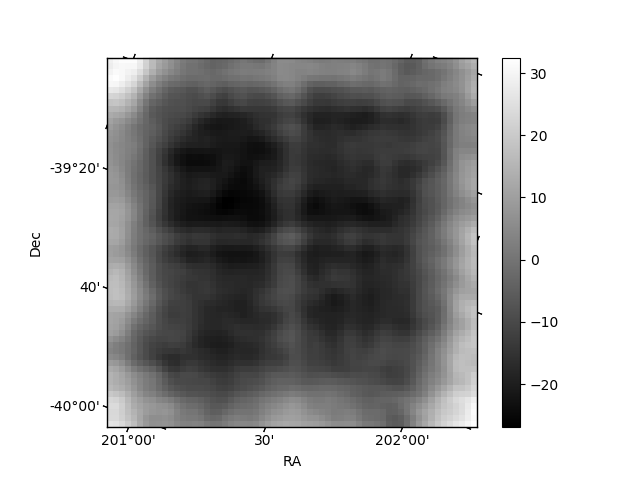
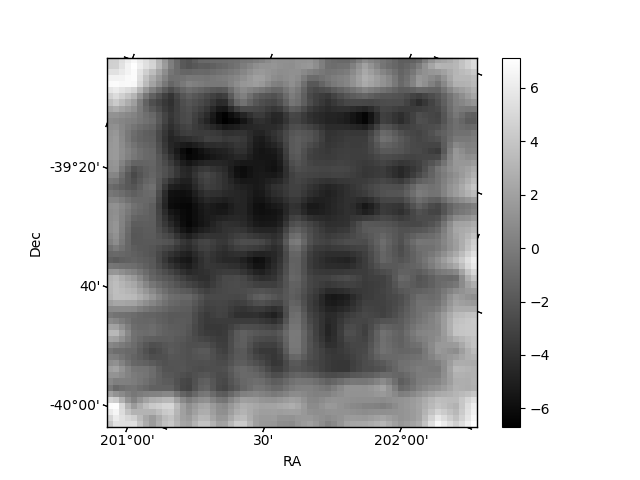
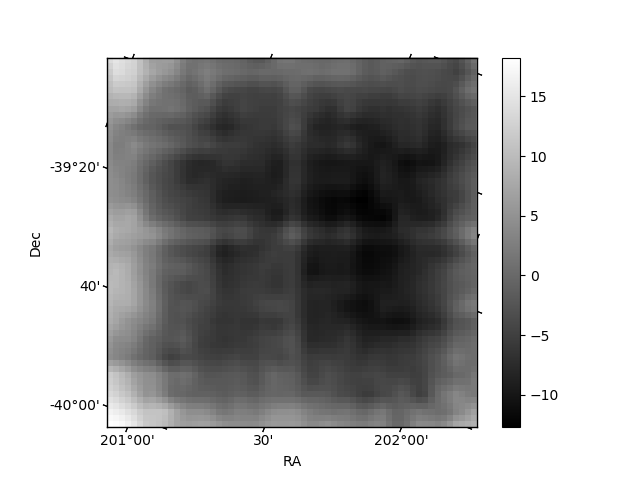
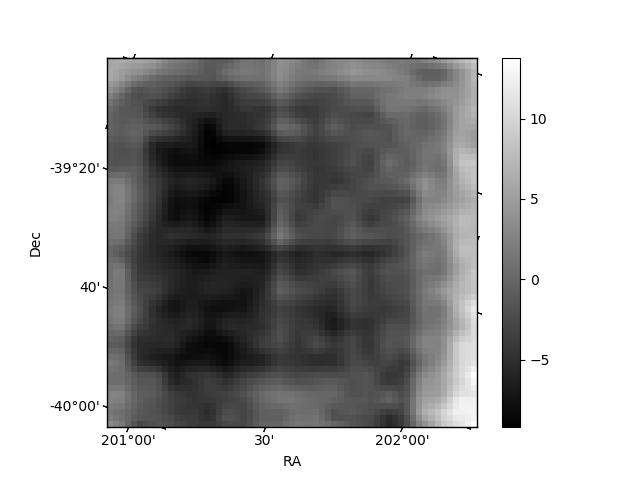
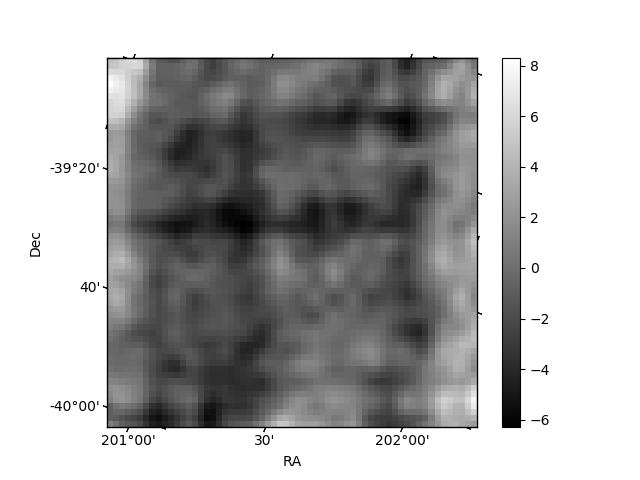
Histogram calculated using DETX and DETY for each event in the final _common_clean file
| Quadrant A | 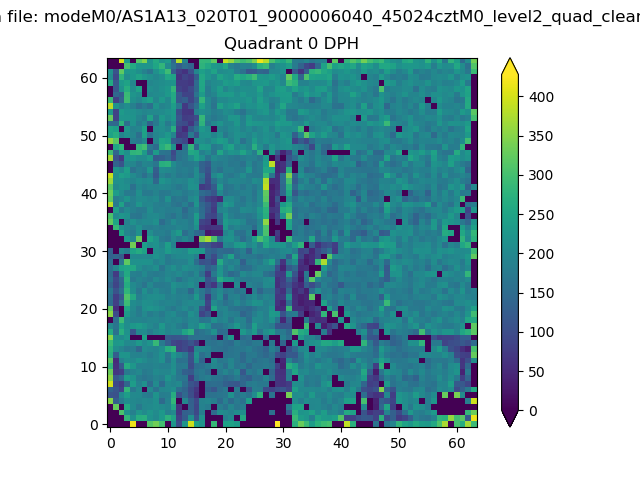 |
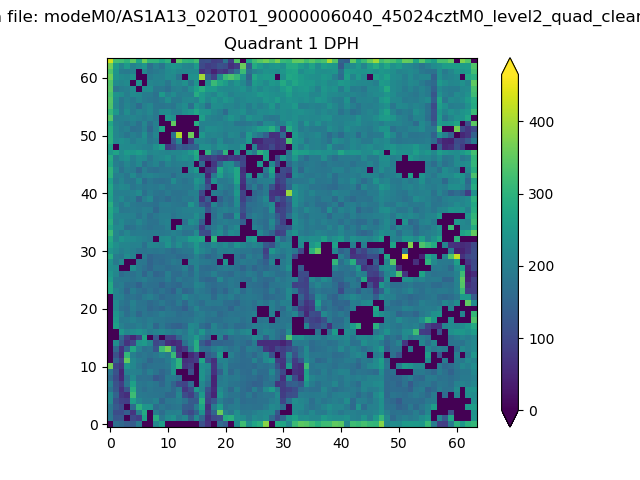 |
Quadrant B |
|---|---|---|---|
| Quadrant D | 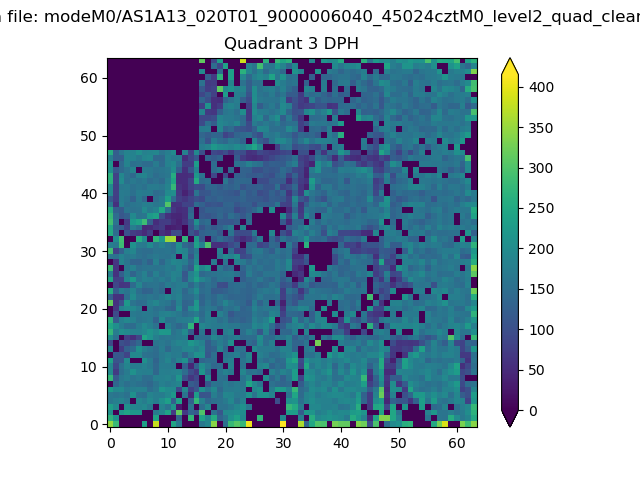 |
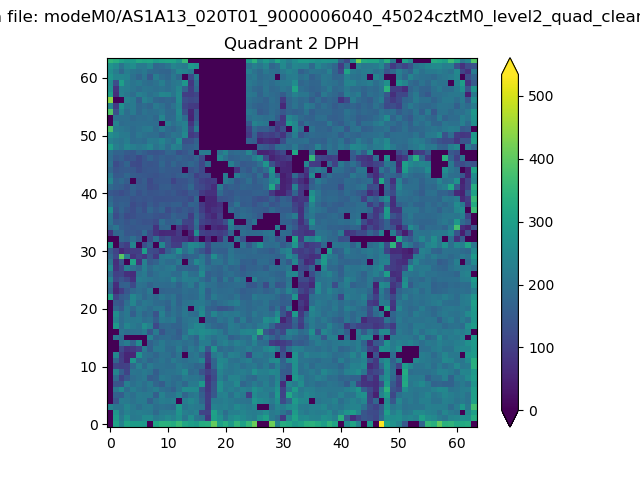 |
Quadrant C |
| Plot type | Count rate plots | Images |
|---|---|---|
| Comparison with Poisson distribution Blue bars denote a histogram of data divided into 1 sec bins. Red curve is a Poisson curve with rate = median count rate of data. |
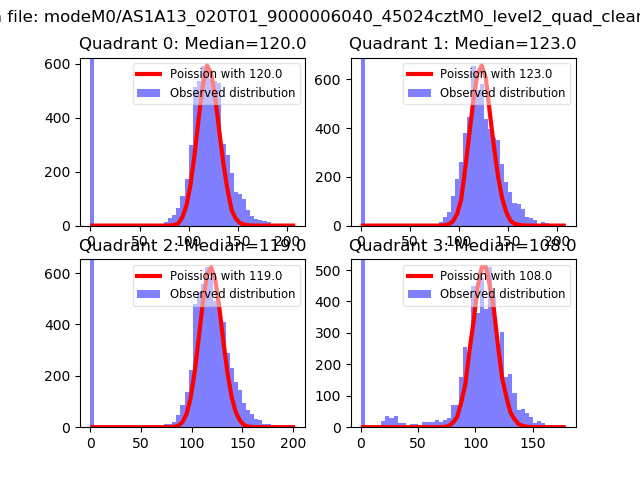 |
 |
| Quadrant-wise count rates Data is divided into 100 sec bins |
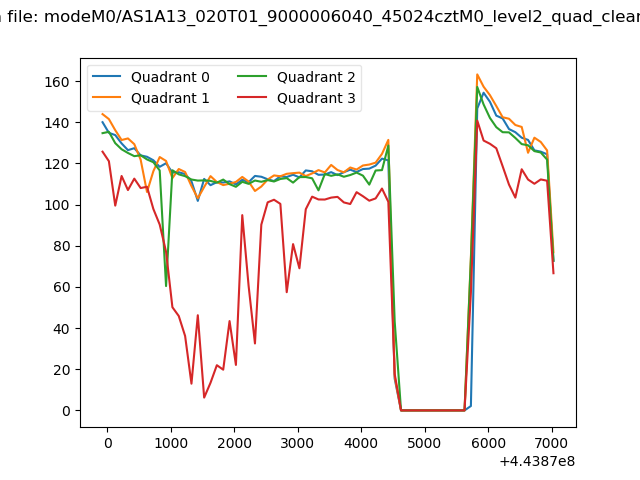 |
|
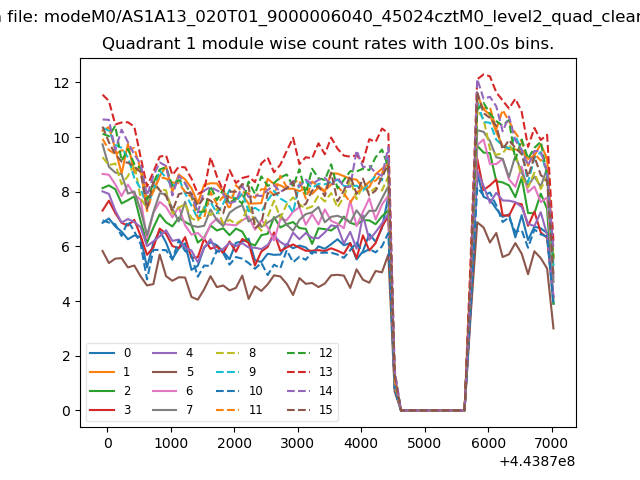
| Module-wise count rates for Quadrant A Data is divided into 100 sec bins |
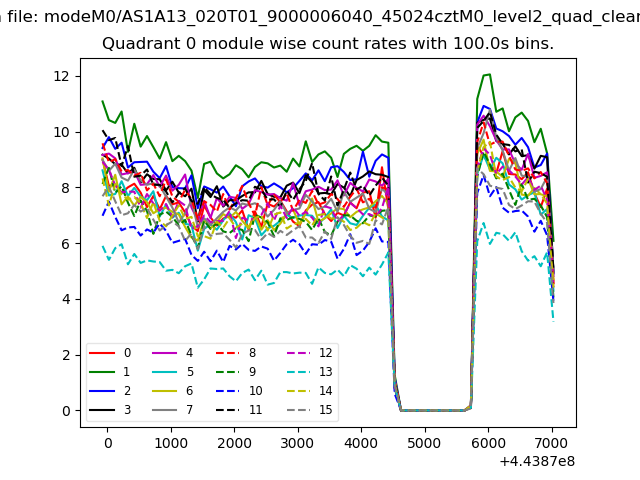 |
 |
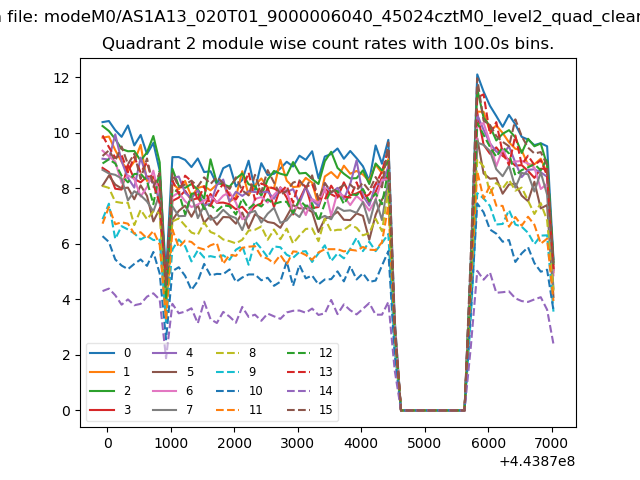
| Module-wise count rates for Quadrant B Data is divided into 100 sec bins |
 |
 |
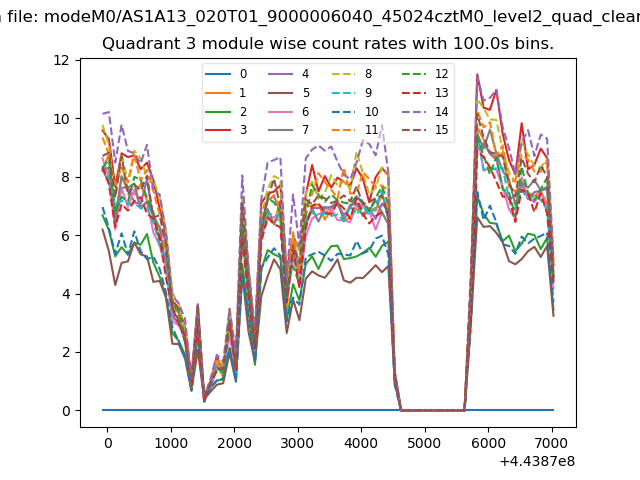
| Module-wise count rates for Quadrant C Data is divided into 100 sec bins |
 |
 |
| Module-wise count rates for Quadrant D Data is divided into 100 sec bins |
 |
 |
| Parameter | Plot |
|---|---|
| CZT HV Monitor | 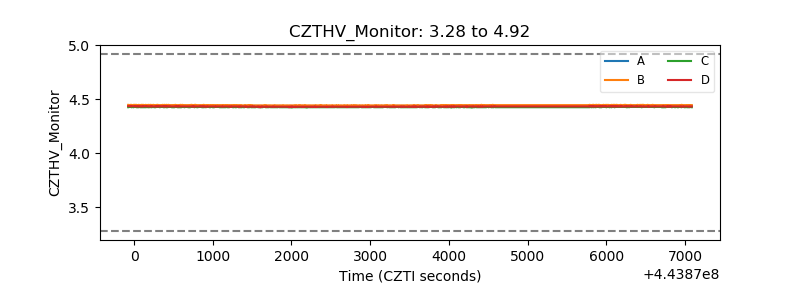 |
| D_VDD | 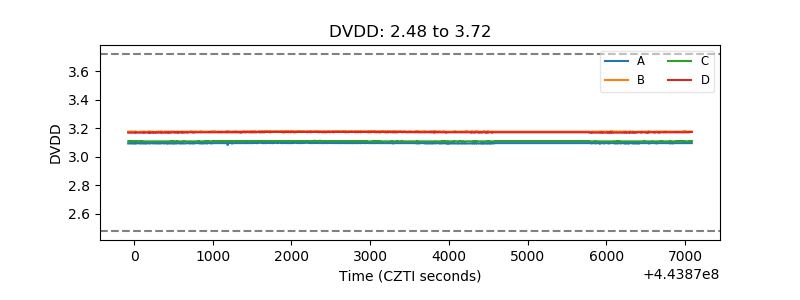 |
| Temperature 1 | 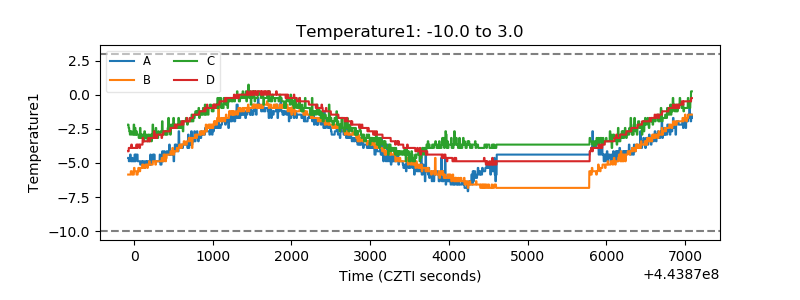 |
| Veto HV Monitor | 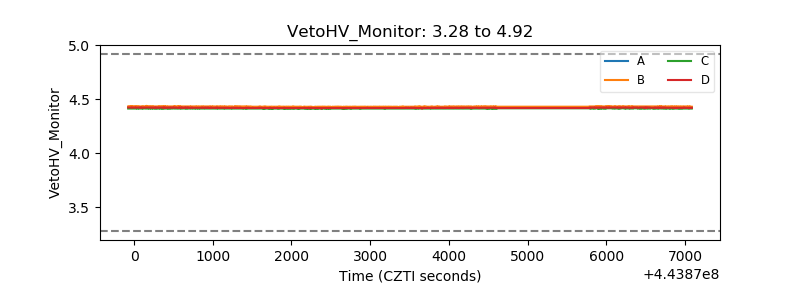 |
| Veto LLD | 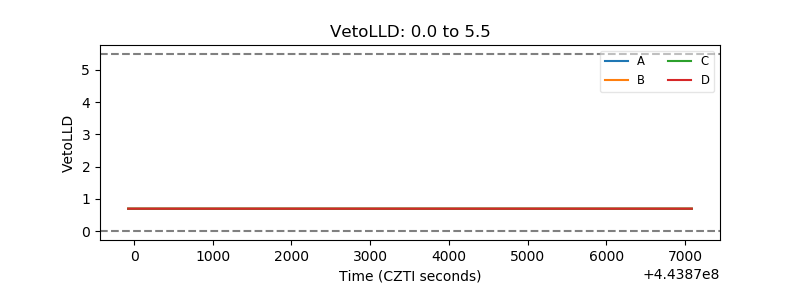 |
| Alpha Counter | 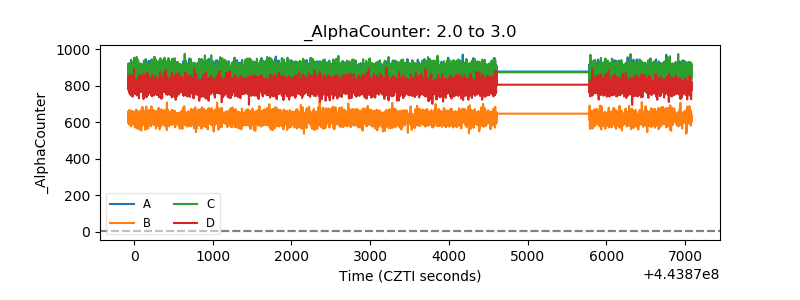 |
| _CPM_Rate | 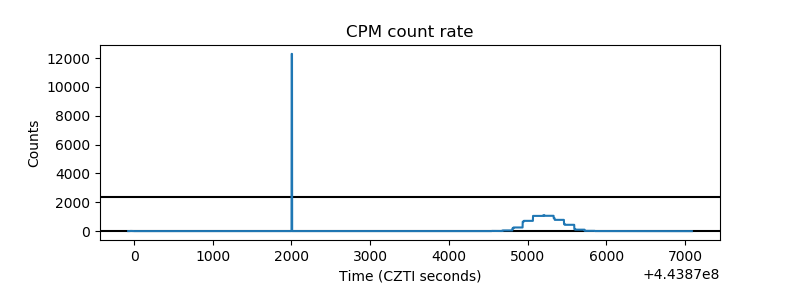 |
| CZT Counter | 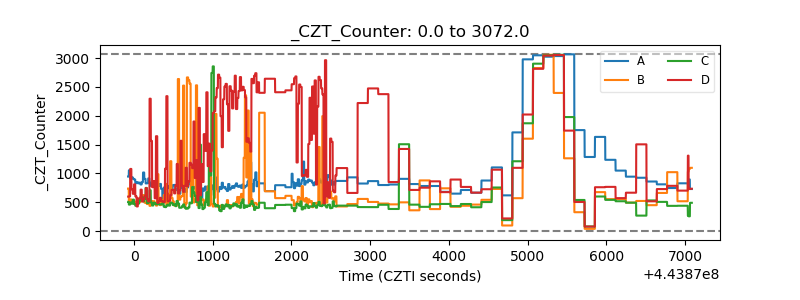 |
| +2.5 Volts monitor | 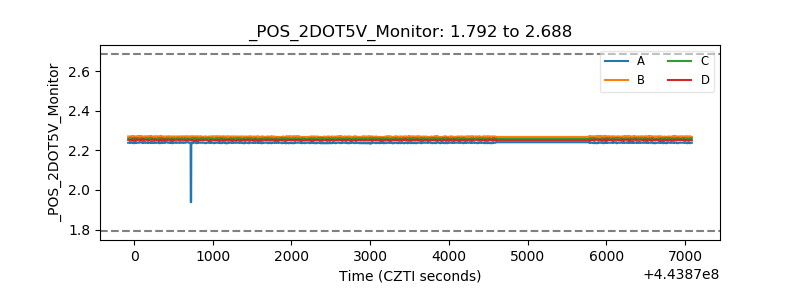 |
| +5 Volts monitor | 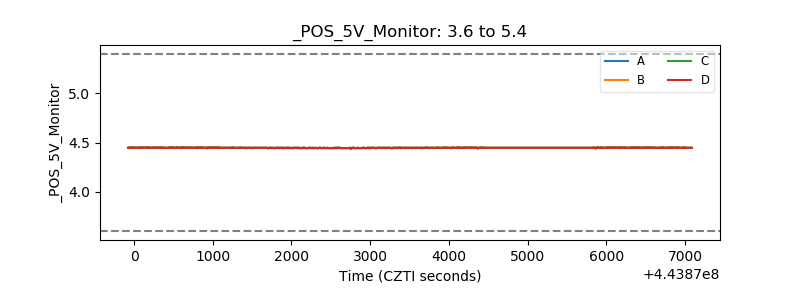 |
| _ROLL_ROT | 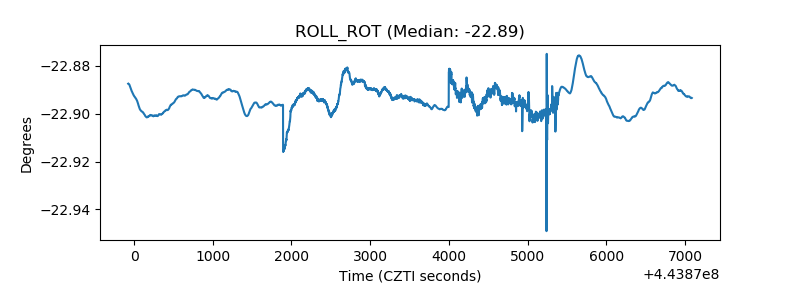 |
| _Roll_DEC | 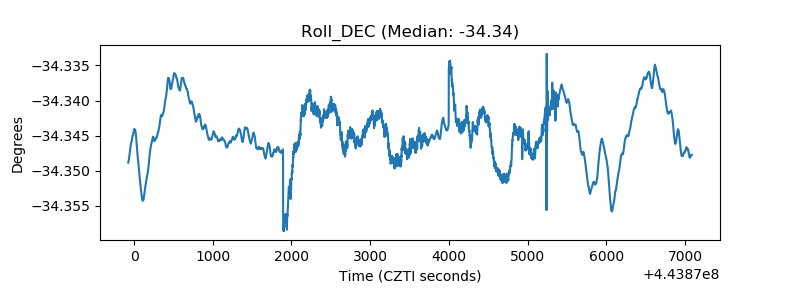 |
| _Roll_RA | 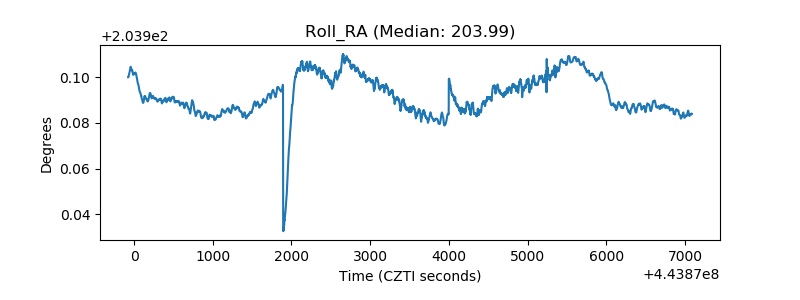 |
| Veto Counter | 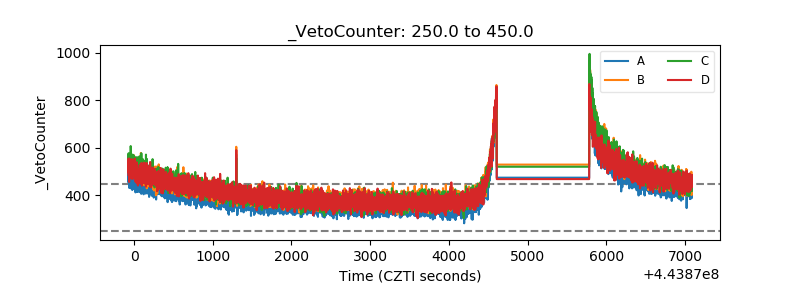 |