| Param | Original file | Final file |
|---|---|---|
| Filename | modeM0/AS1A13_020T01_9000006040_45025cztM0_level2.fits | modeM0/AS1A13_020T01_9000006040_45025cztM0_level2_quad_clean.evt |
| Size (bytes) | 519,436,800 | 114,114,240 |
| Size | 495.4 MB | 108.8 MB |
| Events in quadrant A | 5,482,107 | 770,228 |
| Events in quadrant B | 4,555,732 | 783,366 |
| Events in quadrant C | 3,049,782 | 773,604 |
| Events in quadrant D | 5,642,328 | 679,927 |
| Mode SS | |||
|---|---|---|---|
| Quadrant | BADHDUFLAG | Total packets | Discarded packets |
| A | 0 | 130 | 0 |
| B | 0 | 130 | 0 |
| C | 0 | 130 | 0 |
| D | 0 | 130 | 0 |
| Mode M9 | |||
|---|---|---|---|
| Quadrant | BADHDUFLAG | Total packets | Discarded packets |
| A | 0 | 12 | 0 |
| B | 0 | 12 | 0 |
| C | 0 | 12 | 0 |
| D | 0 | 12 | 0 |
| Mode M0 | |||
|---|---|---|---|
| Quadrant | BADHDUFLAG | Total packets | Discarded packets |
| A | 0 | 20257 | 1 |
| B | 0 | 17726 | 1 |
| C | 0 | 13246 | 2 |
| D | 0 | 21244 | 1 |
| Quadrant | Total seconds | Saturated seconds | Saturation percentage |
|---|---|---|---|
| A | 6427 | 174 | 2.707328% |
| B | 6428 | 271 | 4.215930% |
| C | 6427 | 55 | 0.855765% |
| D | 6427 | 399 | 6.208184% |
Noise dominated data is calculated using 1-second bins in cleaned event files. If a bin has >2000 counts, and if more than 50% of those come from <1% of pixels, then it is considered to be noise-dominated and hence unusable.
| Quadrant | # 1 sec bins | Bins with >0 counts | Bins with >2000 counts | High rate bins dominated by noise | Noise dominated (total time) | Noise dominated (detector-on time) | Marked lightcurve |
|---|---|---|---|---|---|---|---|
| A | 7622 | 6428 | 2 | 2 | 0.03% | 0.03% | 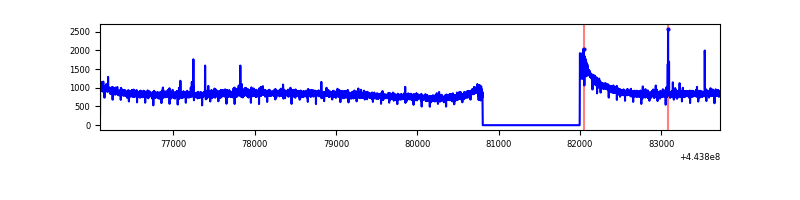 |
| B | 7623 | 6429 | 99 | 99 | 1.30% | 1.54% | 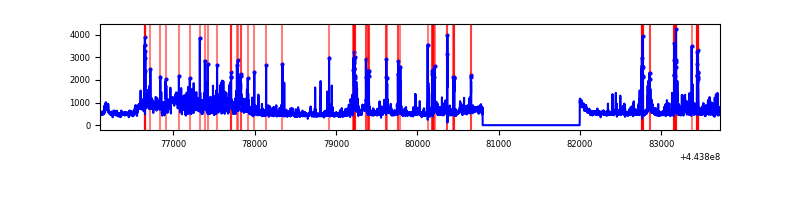 |
| C | 7622 | 6428 | 0 | 0 | 0.00% | 0.00% | 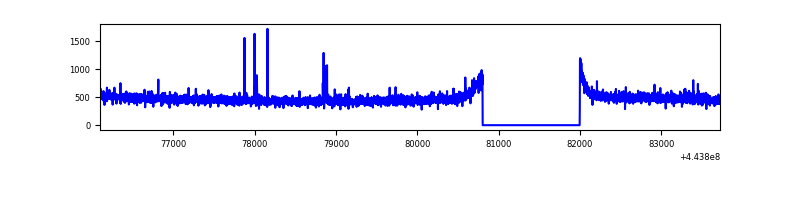 |
| D | 7622 | 6428 | 263 | 263 | 3.45% | 4.09% | 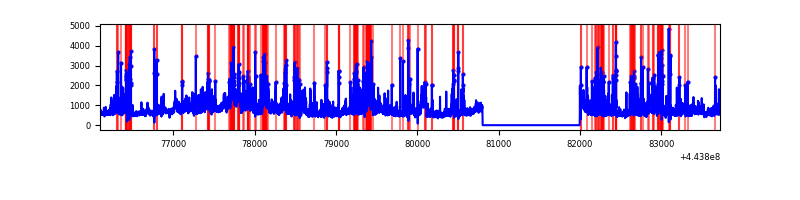 |
Top three noisy pixels from each quadrant. If the there are fewer than three noisy pixels in the level2.evt file, extra rows are filled as -1
| Pixel properties | Quadrant properties | ||||||
|---|---|---|---|---|---|---|---|
| Quadrant | DetID | PixID | Counts | Sigma | Mean | Median | Sigma |
| A | 10 | 83 | 2412005 | 14818.49 | 785 | 769 | 162.7 |
| A | 0 | 243 | 18796 | 110.79 | 785 | 769 | 162.7 |
| A | 13 | 248 | 12443 | 71.74 | 785 | 769 | 162.7 |
| B | 4 | 171 | 367980 | 2451.28 | 773 | 752 | 149.8 |
| B | 0 | 183 | 292201 | 1945.44 | 773 | 752 | 149.8 |
| B | 0 | 155 | 273831 | 1822.82 | 773 | 752 | 149.8 |
| C | 15 | 208 | 19184 | 101.93 | 772 | 777 | 180.6 |
| C | 3 | 233 | 7878 | 39.32 | 772 | 777 | 180.6 |
| C | 1 | 3 | 6687 | 32.73 | 772 | 777 | 180.6 |
| D | 11 | 241 | 862050 | 4506.97 | 761 | 739 | 191.1 |
| D | 5 | 235 | 436255 | 2278.92 | 761 | 739 | 191.1 |
| D | 13 | 29 | 259676 | 1354.94 | 761 | 739 | 191.1 |
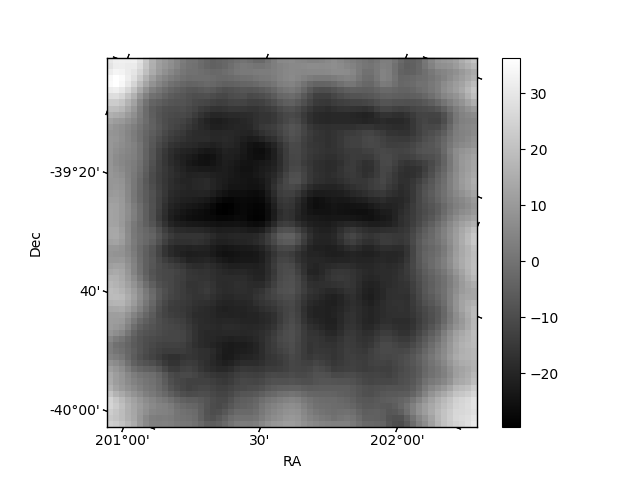
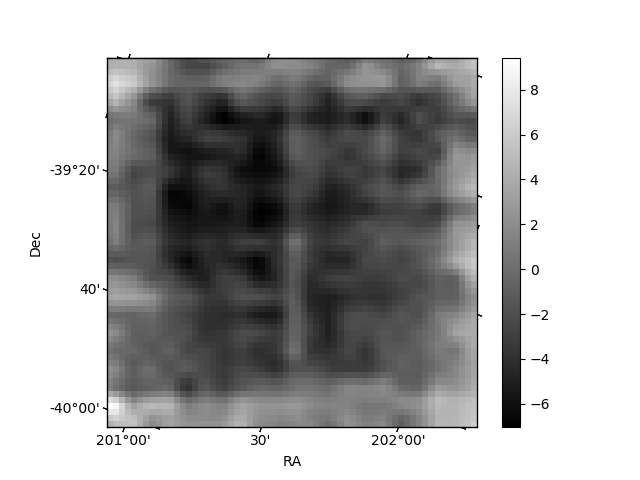
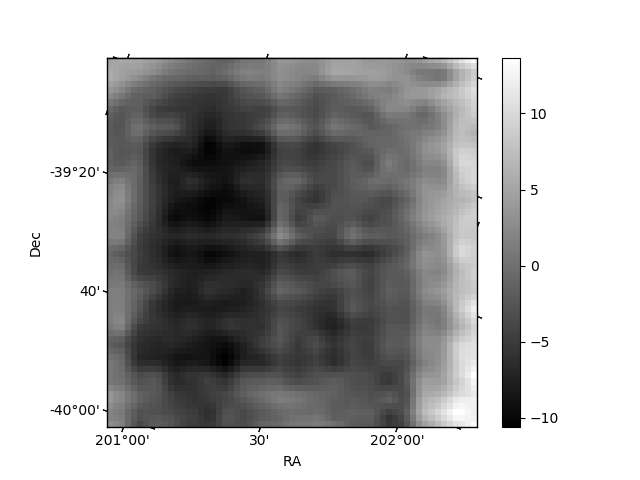
Histogram calculated using DETX and DETY for each event in the final _common_clean file
| Quadrant A | 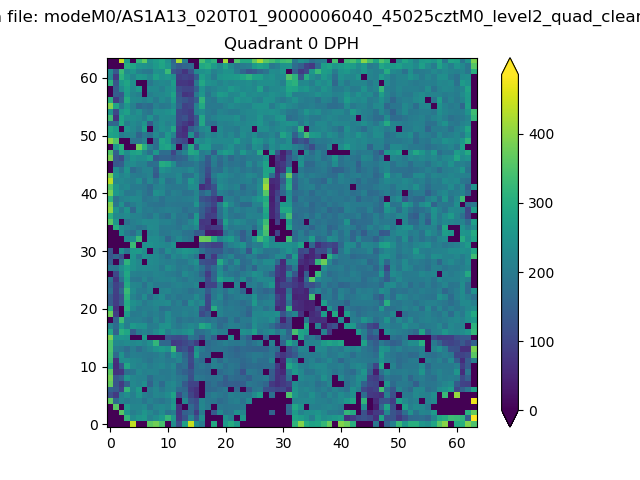 |
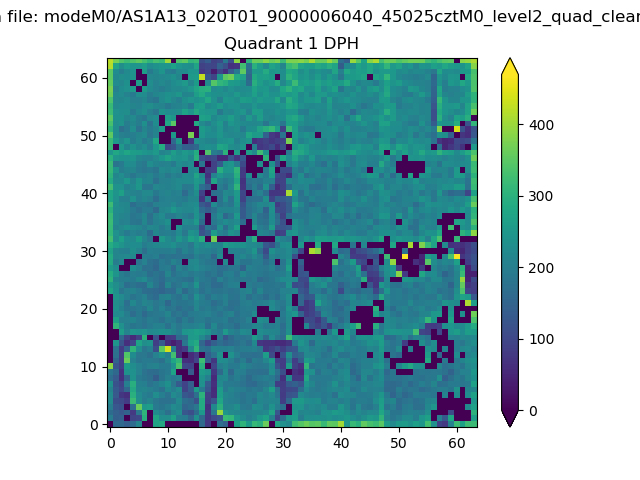 |
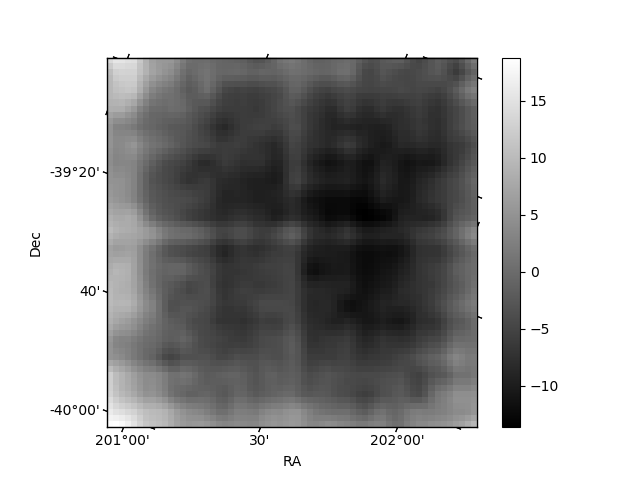
Quadrant B |
|---|---|---|---|
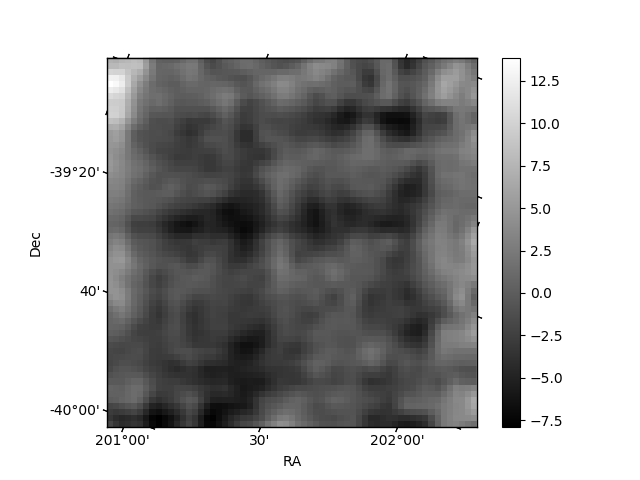
| Quadrant D | 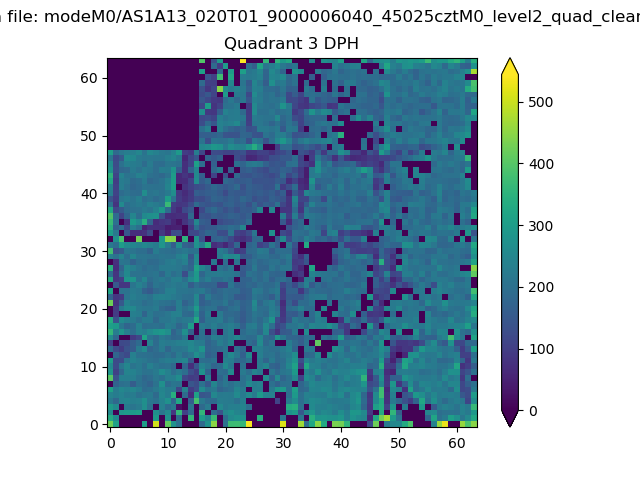 |
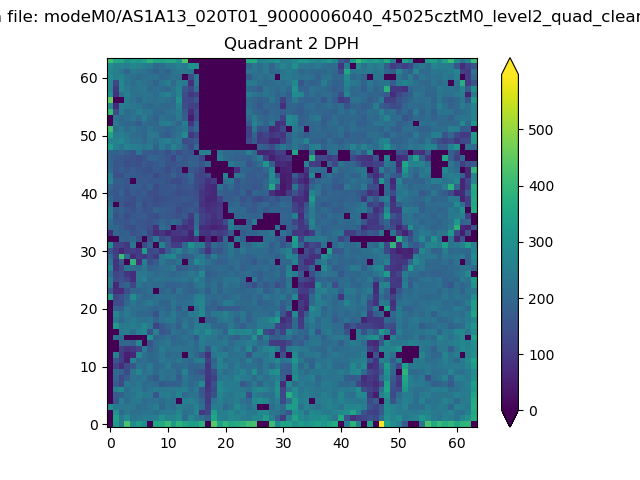 |
Quadrant C |
| Plot type | Count rate plots | Images |
|---|---|---|
| Comparison with Poisson distribution Blue bars denote a histogram of data divided into 1 sec bins. Red curve is a Poisson curve with rate = median count rate of data. |
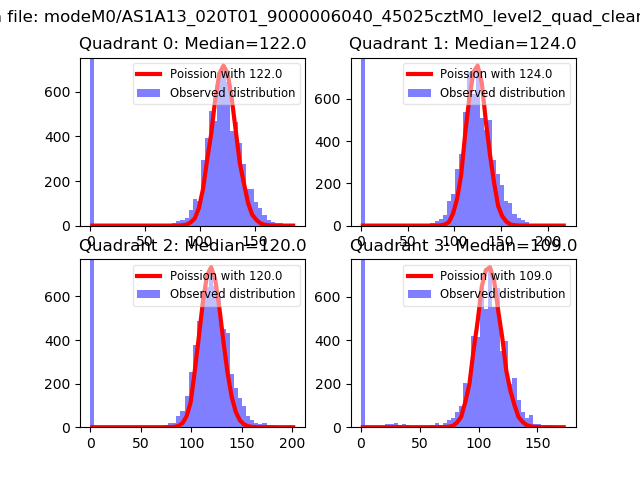 |
 |
| Quadrant-wise count rates Data is divided into 100 sec bins |
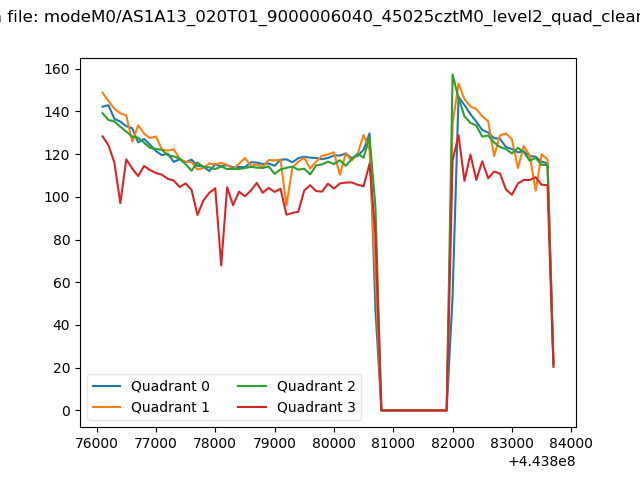 |
|
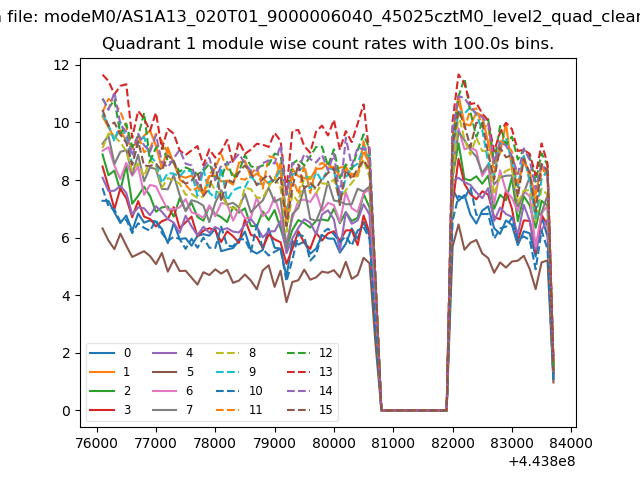
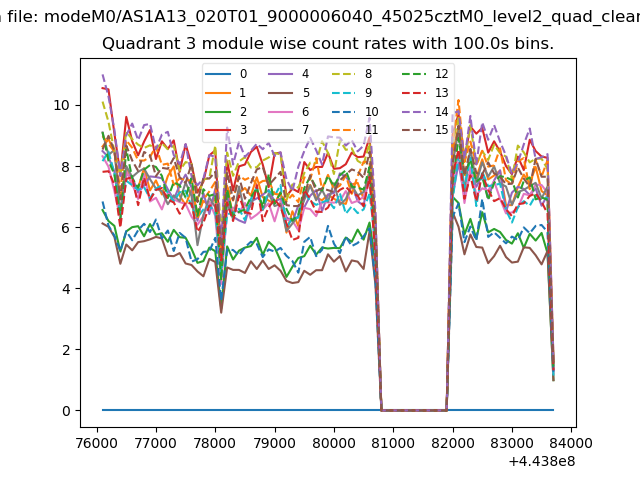
| Module-wise count rates for Quadrant A Data is divided into 100 sec bins |
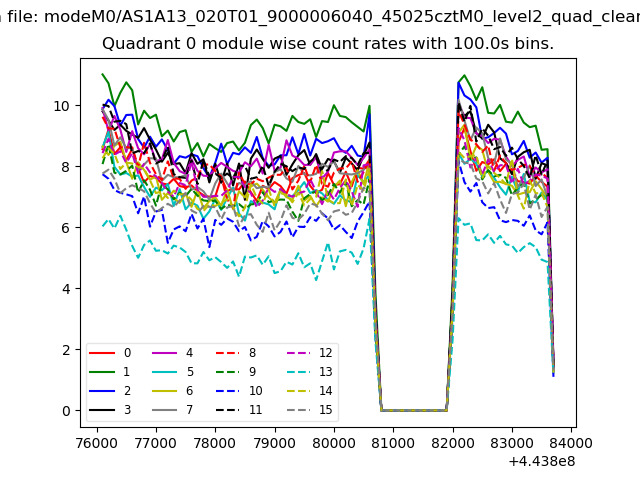 |
 |
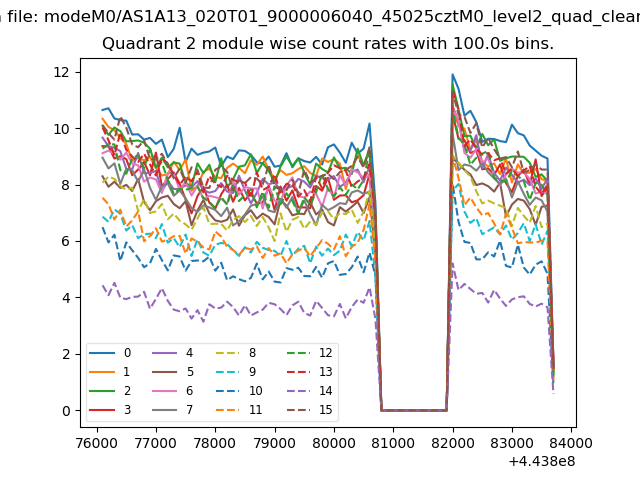
| Module-wise count rates for Quadrant B Data is divided into 100 sec bins |
 |
 |
| Module-wise count rates for Quadrant C Data is divided into 100 sec bins |
 |
 |
| Module-wise count rates for Quadrant D Data is divided into 100 sec bins |
 |
 |
| Parameter | Plot |
|---|---|
| CZT HV Monitor | 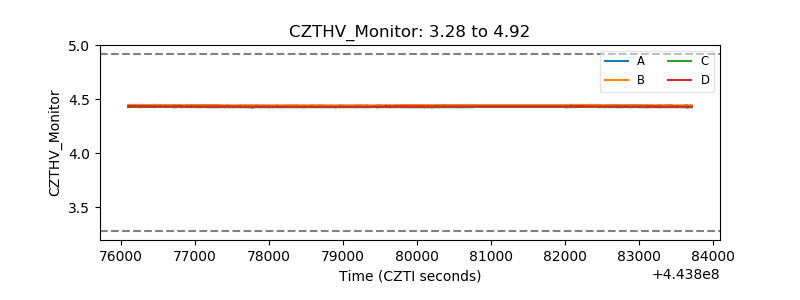 |
| D_VDD | 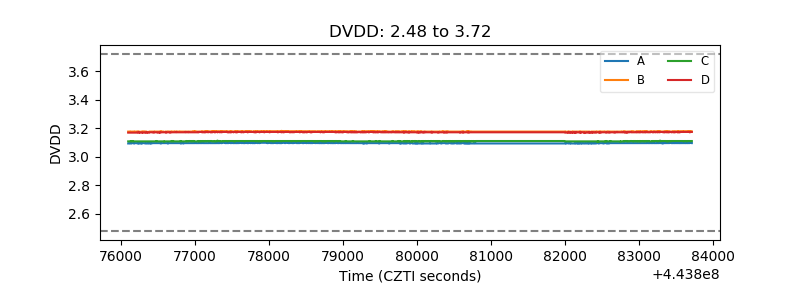 |
| Temperature 1 | 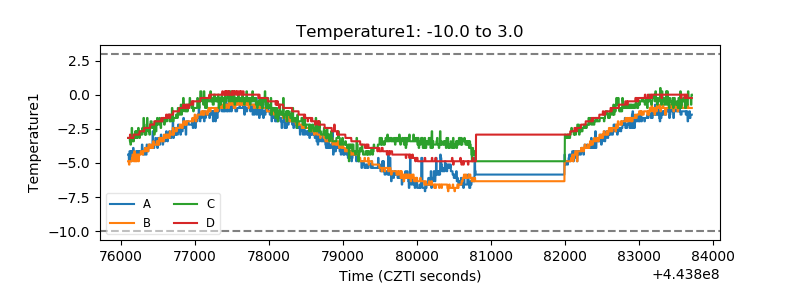 |
| Veto HV Monitor | 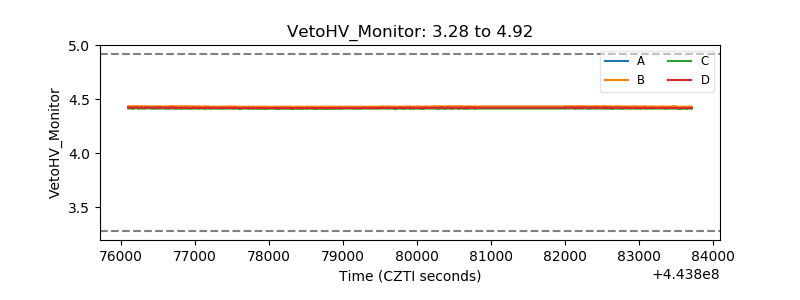 |
| Veto LLD | 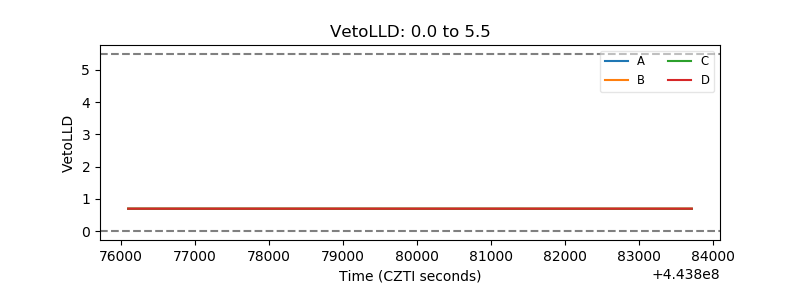 |
| Alpha Counter | 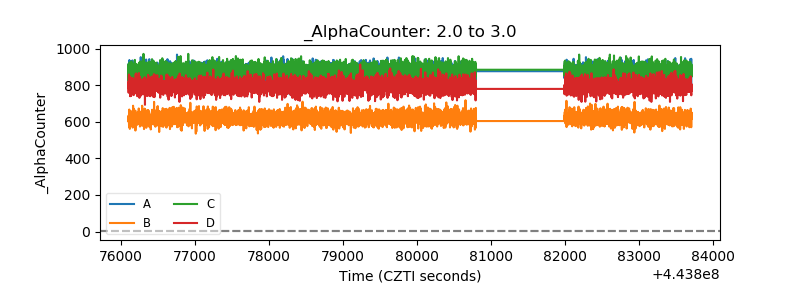 |
| _CPM_Rate | 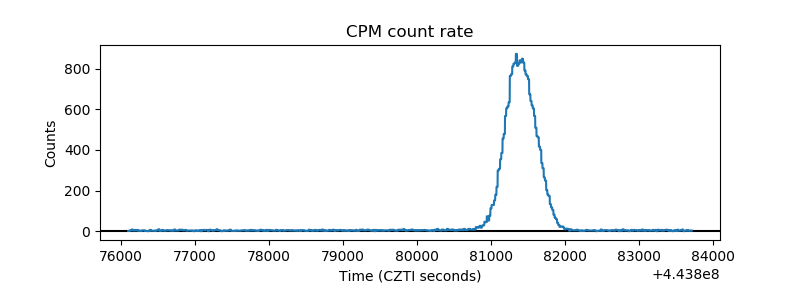 |
| CZT Counter | 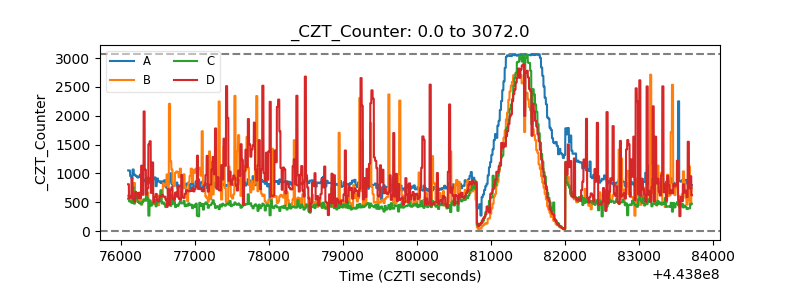 |
| +2.5 Volts monitor | 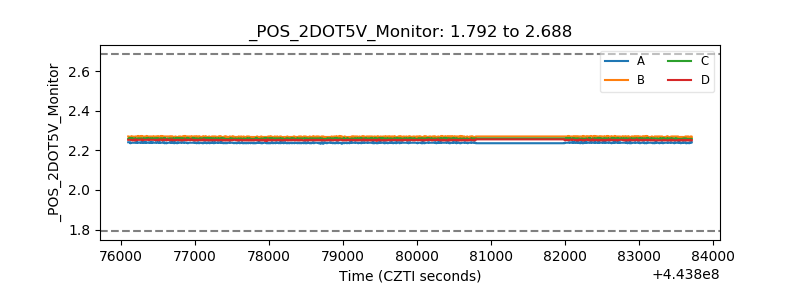 |
| +5 Volts monitor | 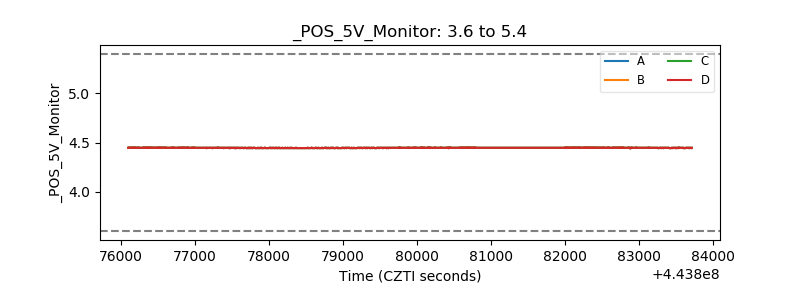 |
| _ROLL_ROT | 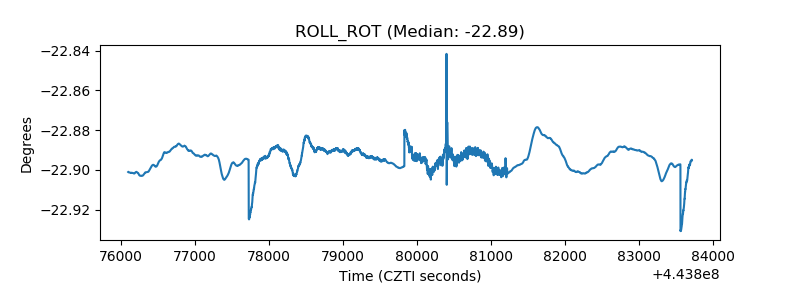 |
| _Roll_DEC | 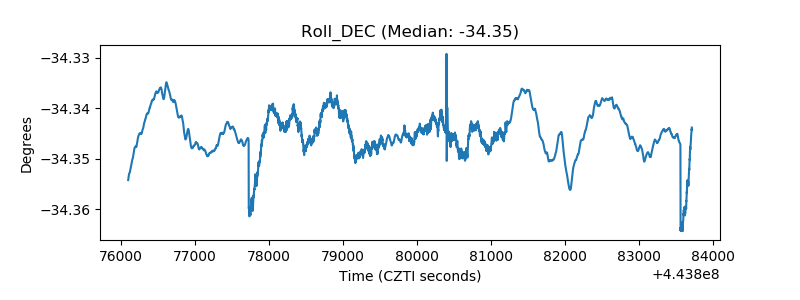 |
| _Roll_RA | 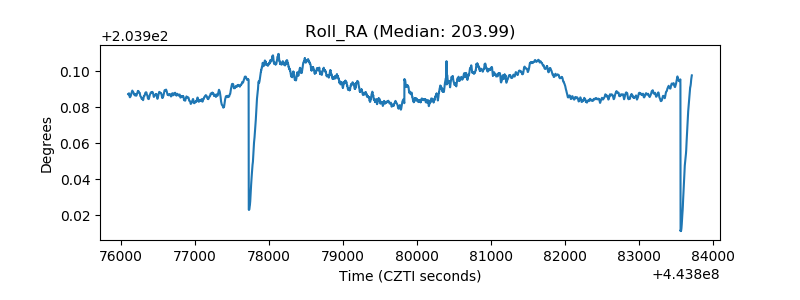 |
| Veto Counter | 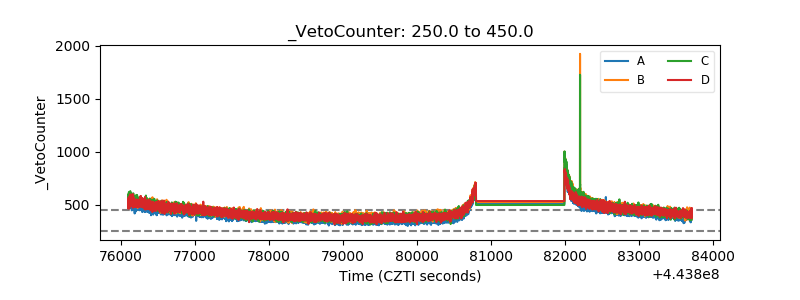 |