| Param | Original file | Final file |
|---|---|---|
| Filename | modeM0/AS1A13_020T01_9000006040_45026cztM0_level2.fits | modeM0/AS1A13_020T01_9000006040_45026cztM0_level2_quad_clean.evt |
| Size (bytes) | 524,442,240 | 117,743,040 |
| Size | 500.1 MB | 112.3 MB |
| Events in quadrant A | 5,916,176 | 783,852 |
| Events in quadrant B | 4,189,663 | 806,154 |
| Events in quadrant C | 3,260,321 | 800,534 |
| Events in quadrant D | 5,518,958 | 700,386 |
| Mode SS | |||
|---|---|---|---|
| Quadrant | BADHDUFLAG | Total packets | Discarded packets |
| A | 0 | 138 | 0 |
| B | 0 | 138 | 0 |
| C | 0 | 138 | 0 |
| D | 0 | 138 | 0 |
| Mode M9 | |||
|---|---|---|---|
| Quadrant | BADHDUFLAG | Total packets | Discarded packets |
| A | 0 | 14 | 0 |
| B | 0 | 15 | 0 |
| C | 0 | 15 | 0 |
| D | 0 | 15 | 0 |
| Mode M0 | |||
|---|---|---|---|
| Quadrant | BADHDUFLAG | Total packets | Discarded packets |
| A | 0 | 21965 | 2 |
| B | 0 | 16863 | 2 |
| C | 0 | 14258 | 2 |
| D | 0 | 21111 | 2 |
| Quadrant | Total seconds | Saturated seconds | Saturation percentage |
|---|---|---|---|
| A | 6808 | 307 | 4.509401% |
| B | 6808 | 335 | 4.920682% |
| C | 6808 | 94 | 1.380729% |
| D | 6807 | 419 | 6.155428% |
Noise dominated data is calculated using 1-second bins in cleaned event files. If a bin has >2000 counts, and if more than 50% of those come from <1% of pixels, then it is considered to be noise-dominated and hence unusable.
| Quadrant | # 1 sec bins | Bins with >0 counts | Bins with >2000 counts | High rate bins dominated by noise | Noise dominated (total time) | Noise dominated (detector-on time) | Marked lightcurve |
|---|---|---|---|---|---|---|---|
| A | 7903 | 6810 | 2 | 2 | 0.03% | 0.03% | 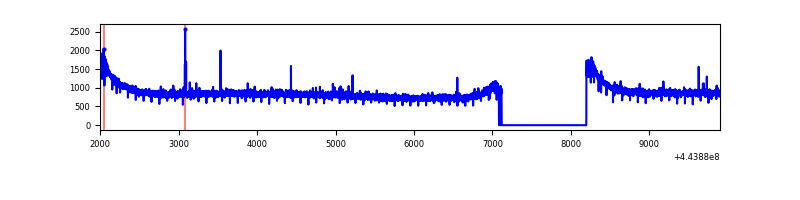 |
| B | 7903 | 6810 | 71 | 71 | 0.90% | 1.04% | 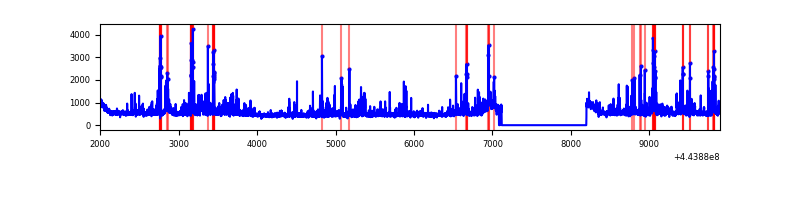 |
| C | 7903 | 6810 | 3 | 3 | 0.04% | 0.04% | 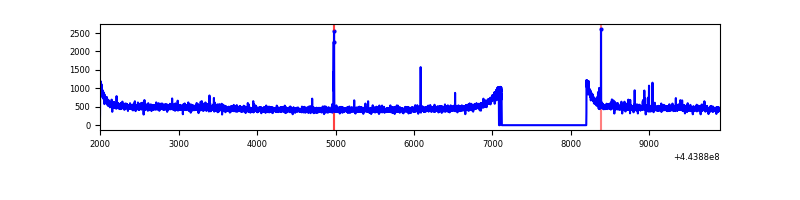 |
| D | 7902 | 6809 | 199 | 199 | 2.52% | 2.92% | 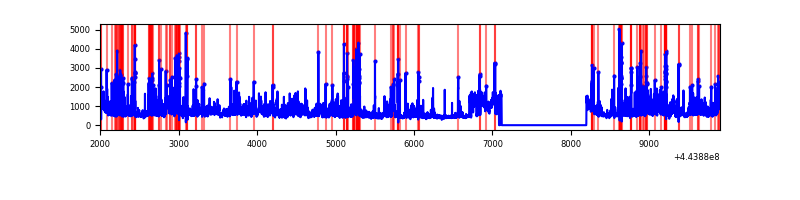 |
Top three noisy pixels from each quadrant. If the there are fewer than three noisy pixels in the level2.evt file, extra rows are filled as -1
| Pixel properties | Quadrant properties | ||||||
|---|---|---|---|---|---|---|---|
| Quadrant | DetID | PixID | Counts | Sigma | Mean | Median | Sigma |
| A | 10 | 83 | 2658912 | 15478.01 | 830 | 813 | 171.7 |
| A | 0 | 243 | 26021 | 146.79 | 830 | 813 | 171.7 |
| A | 15 | 174 | 10182 | 54.56 | 830 | 813 | 171.7 |
| B | 5 | 255 | 166116 | 1021.63 | 824 | 800 | 161.8 |
| B | 0 | 155 | 163059 | 1002.74 | 824 | 800 | 161.8 |
| B | 4 | 171 | 152353 | 936.58 | 824 | 800 | 161.8 |
| C | 1 | 3 | 26979 | 135.6 | 823 | 831 | 192.8 |
| C | 15 | 208 | 11048 | 52.98 | 823 | 831 | 192.8 |
| C | 3 | 233 | 9176 | 43.28 | 823 | 831 | 192.8 |
| D | 13 | 174 | 393178 | 1917.0 | 807 | 784 | 204.7 |
| D | 2 | 249 | 366424 | 1786.3 | 807 | 784 | 204.7 |
| D | 5 | 235 | 332966 | 1622.84 | 807 | 784 | 204.7 |
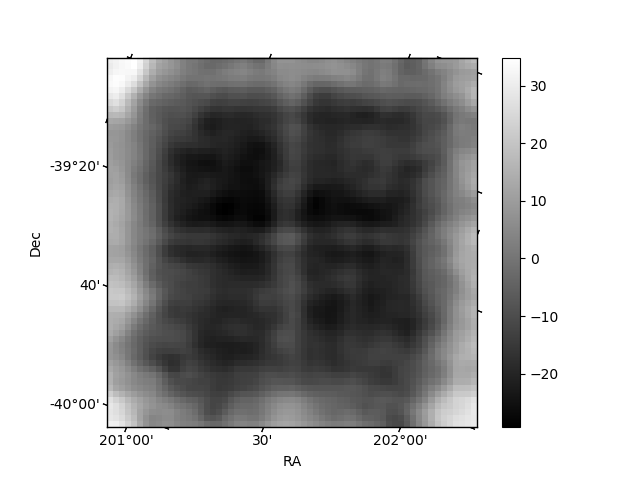
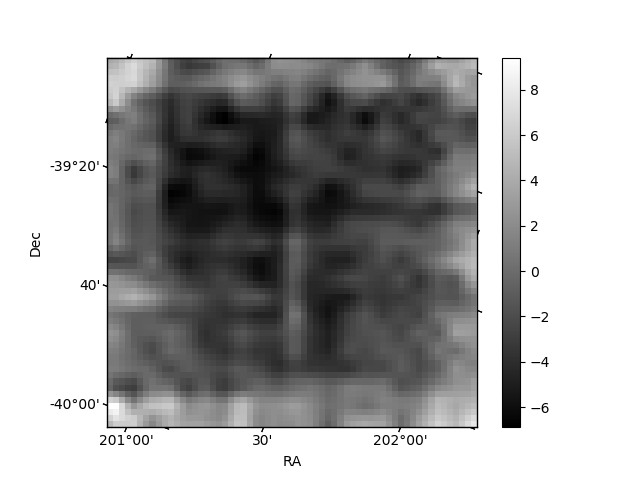
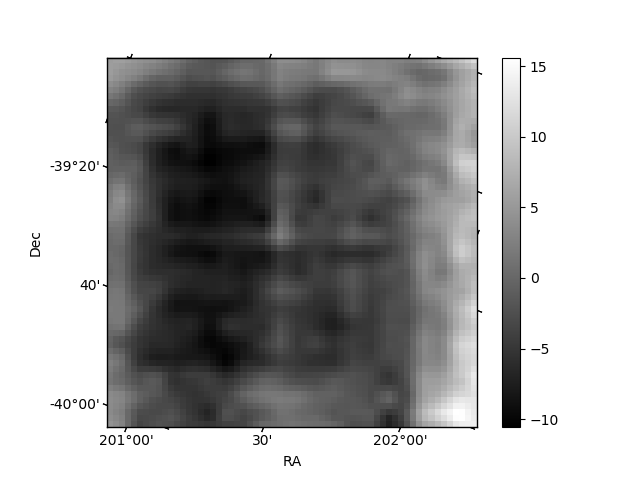
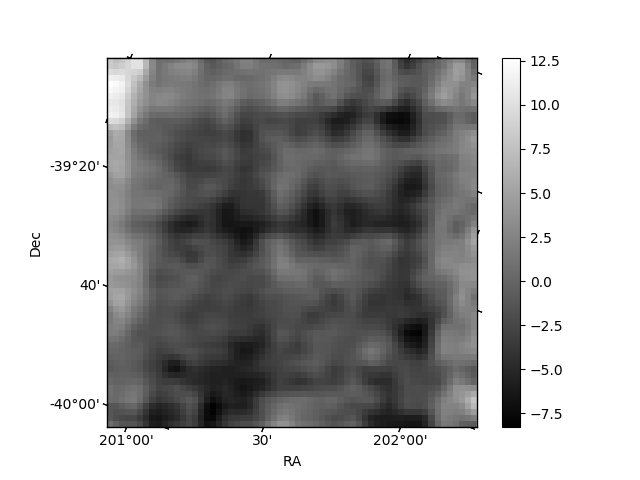
Histogram calculated using DETX and DETY for each event in the final _common_clean file
| Quadrant A | 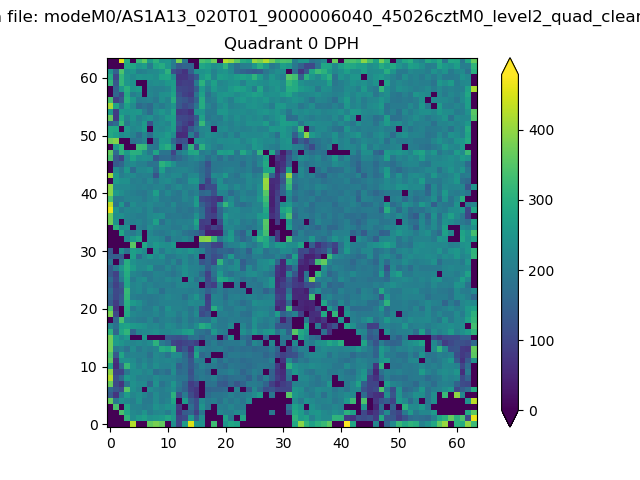 |
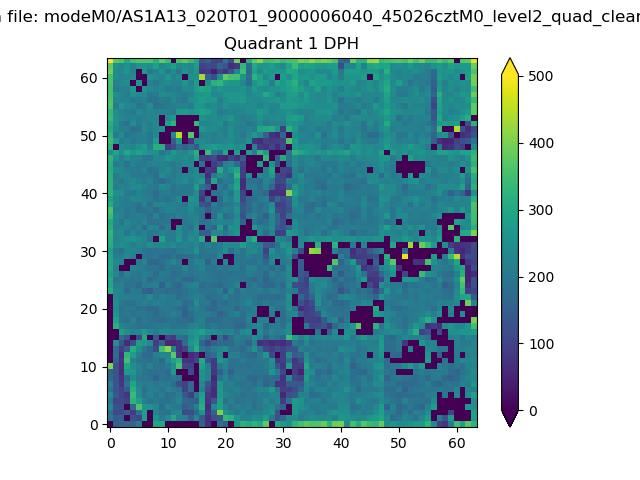 |
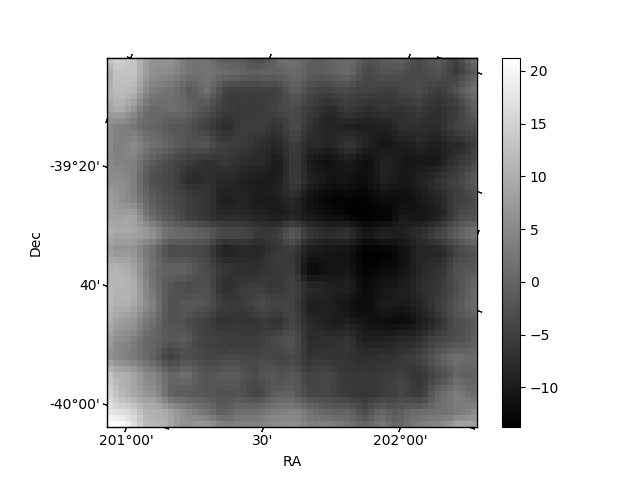
Quadrant B |
|---|---|---|---|
| Quadrant D | 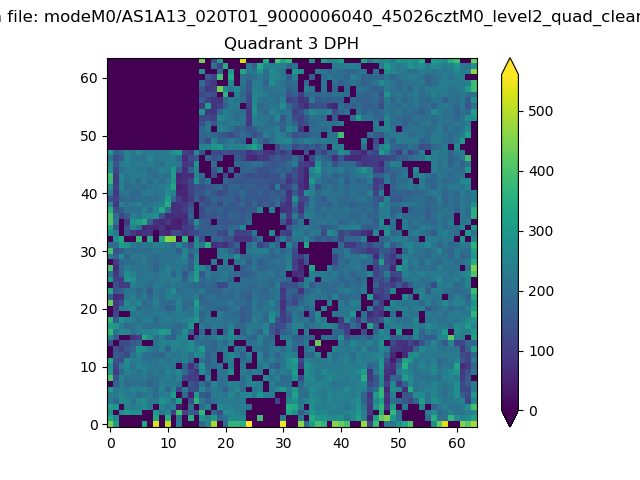 |
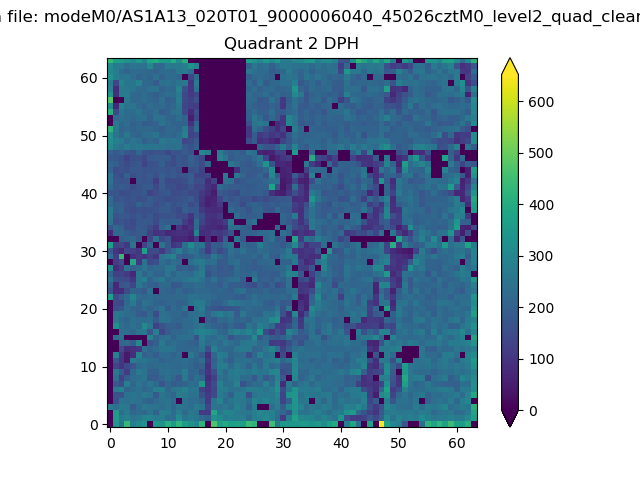 |
Quadrant C |
| Plot type | Count rate plots | Images |
|---|---|---|
| Comparison with Poisson distribution Blue bars denote a histogram of data divided into 1 sec bins. Red curve is a Poisson curve with rate = median count rate of data. |
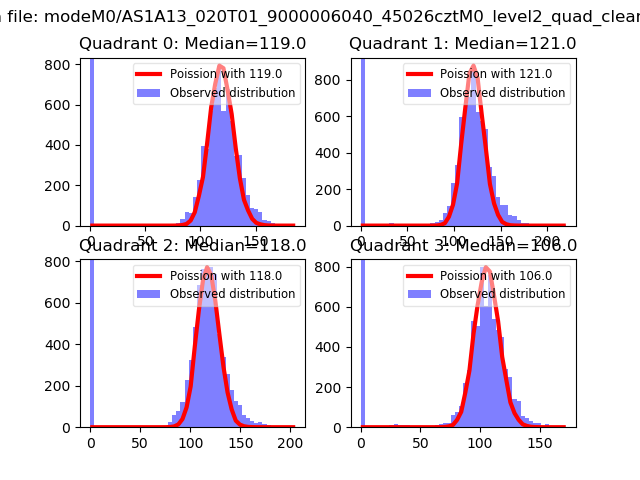 |
 |
| Quadrant-wise count rates Data is divided into 100 sec bins |
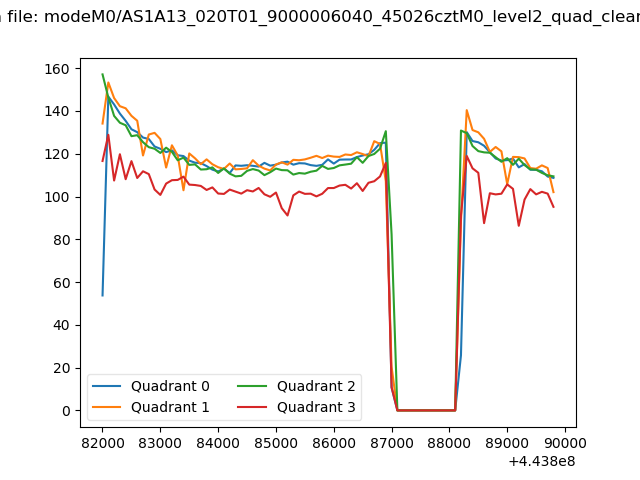 |
|
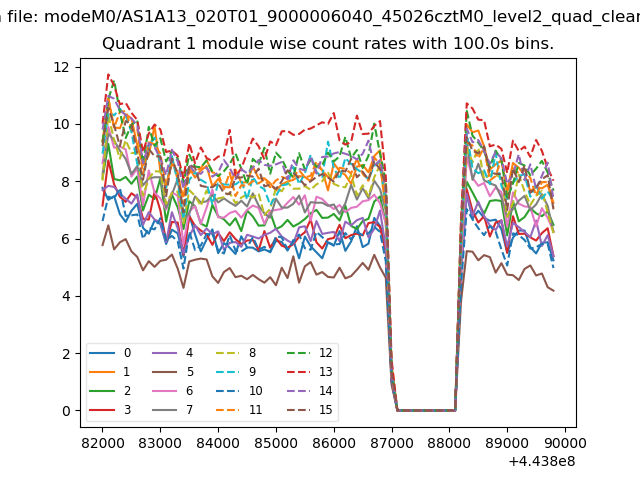
| Module-wise count rates for Quadrant A Data is divided into 100 sec bins |
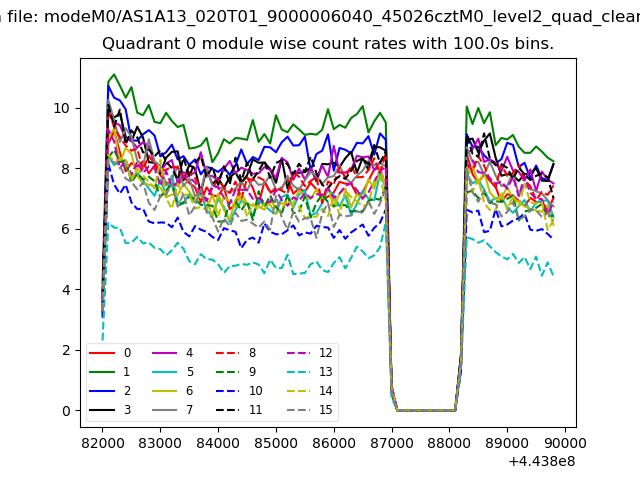 |
 |
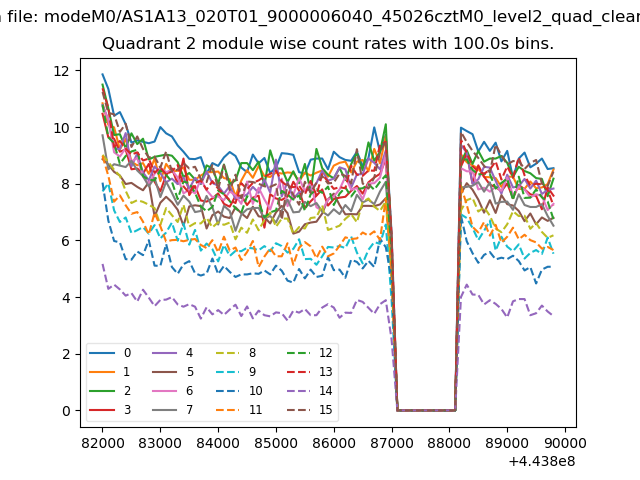
| Module-wise count rates for Quadrant B Data is divided into 100 sec bins |
 |
 |
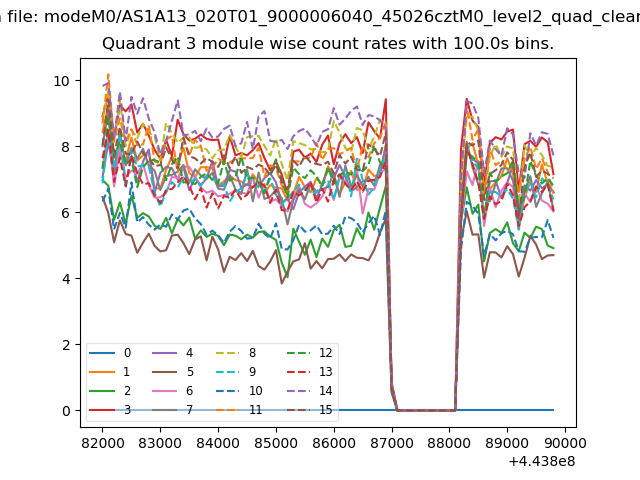
| Module-wise count rates for Quadrant C Data is divided into 100 sec bins |
 |
 |
| Module-wise count rates for Quadrant D Data is divided into 100 sec bins |
 |
 |
| Parameter | Plot |
|---|---|
| CZT HV Monitor | 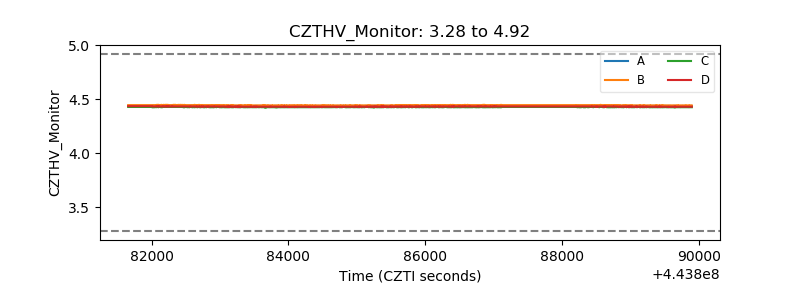 |
| D_VDD | 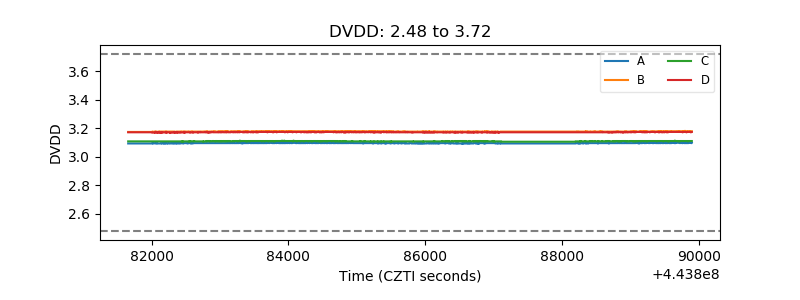 |
| Temperature 1 | 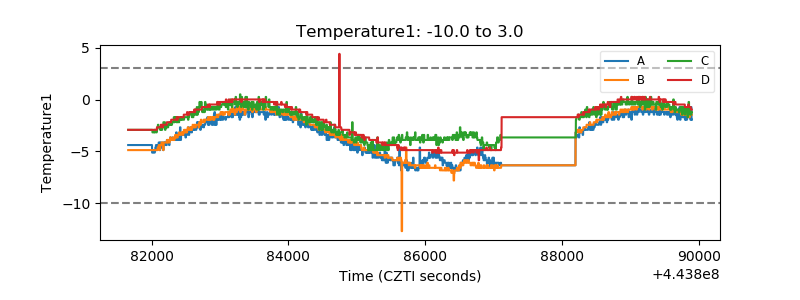 |
| Veto HV Monitor | 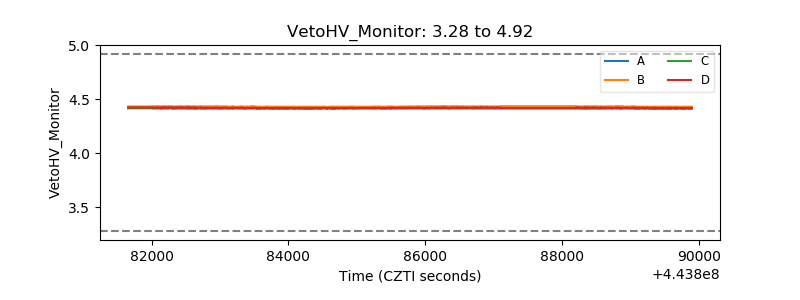 |
| Veto LLD | 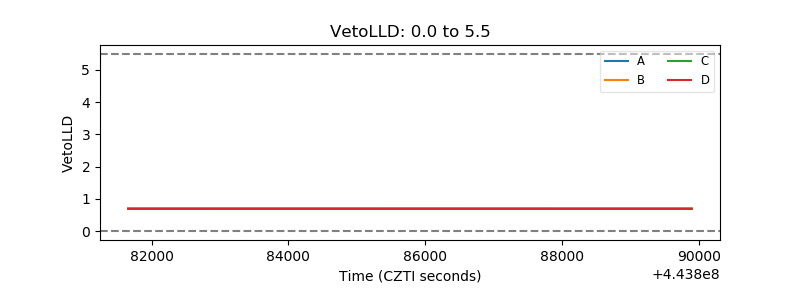 |
| Alpha Counter | 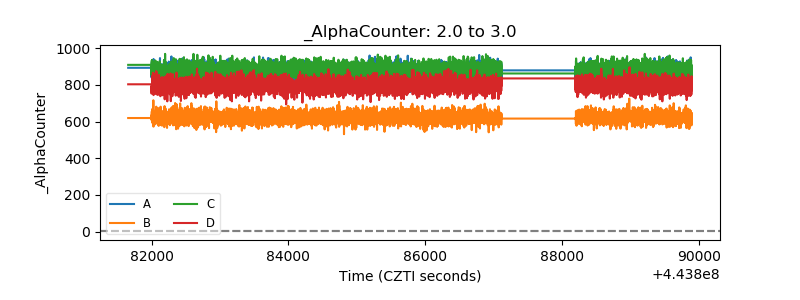 |
| _CPM_Rate | 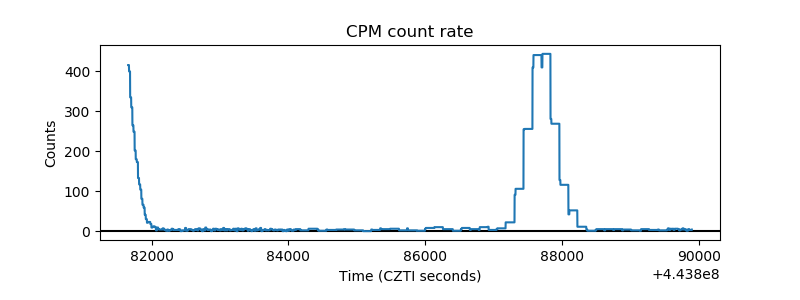 |
| CZT Counter | 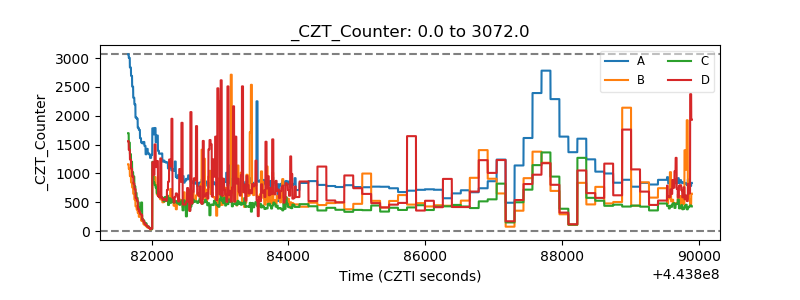 |
| +2.5 Volts monitor | 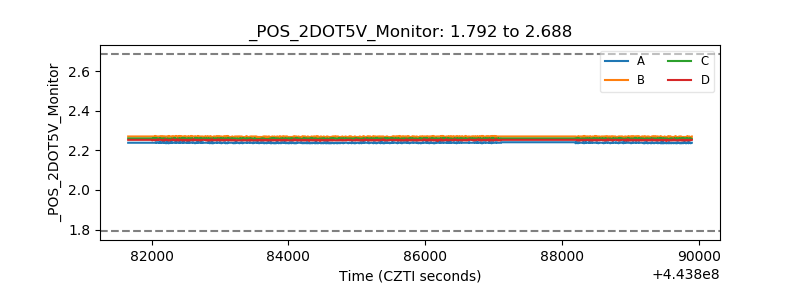 |
| +5 Volts monitor | 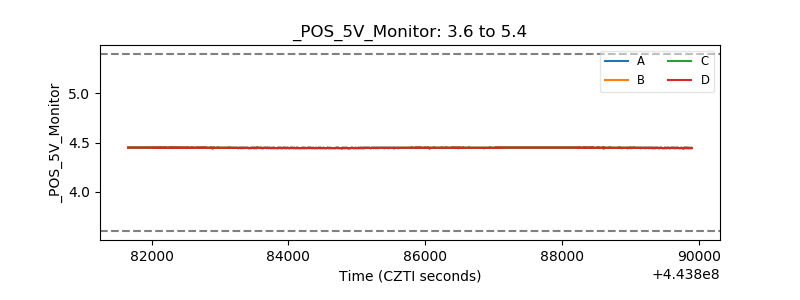 |
| _ROLL_ROT | 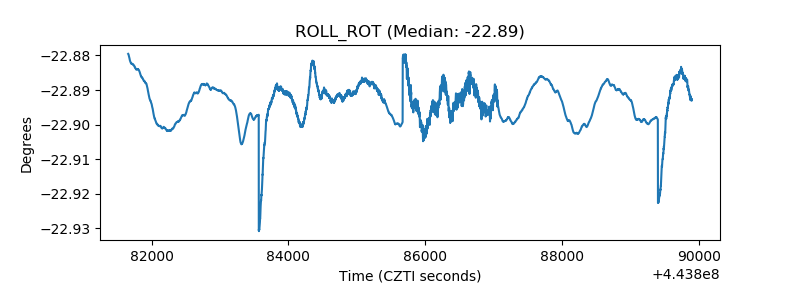 |
| _Roll_DEC | 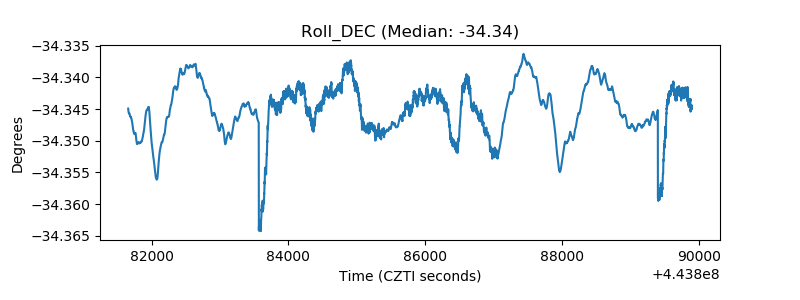 |
| _Roll_RA | 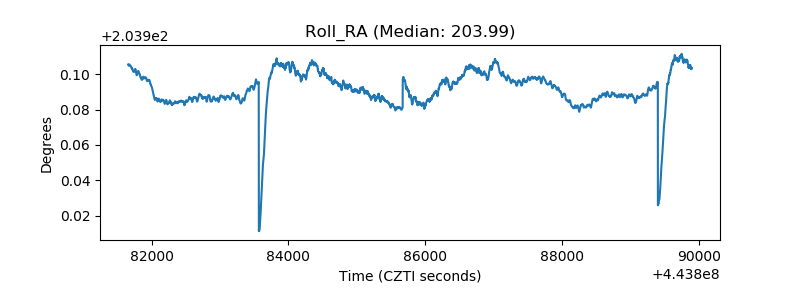 |
| Veto Counter | 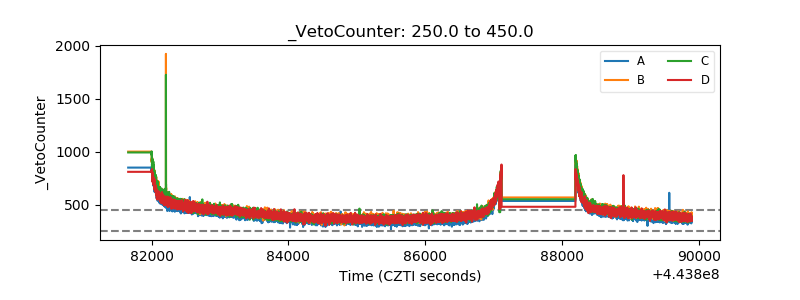 |