| Param | Original file | Final file |
|---|---|---|
| Filename | modeM0/AS1A13_020T01_9000006040_45027cztM0_level2.fits | modeM0/AS1A13_020T01_9000006040_45027cztM0_level2_quad_clean.evt |
| Size (bytes) | 576,480,960 | 114,477,120 |
| Size | 549.8 MB | 109.2 MB |
| Events in quadrant A | 6,008,126 | 764,144 |
| Events in quadrant B | 4,231,838 | 789,541 |
| Events in quadrant C | 3,269,064 | 779,953 |
| Events in quadrant D | 7,290,427 | 647,429 |
| Mode SS | |||
|---|---|---|---|
| Quadrant | BADHDUFLAG | Total packets | Discarded packets |
| A | 0 | 140 | 0 |
| B | 0 | 140 | 0 |
| C | 0 | 140 | 0 |
| D | 0 | 140 | 0 |
| Mode M9 | |||
|---|---|---|---|
| Quadrant | BADHDUFLAG | Total packets | Discarded packets |
| A | 0 | 10 | 0 |
| B | 0 | 10 | 0 |
| C | 0 | 10 | 0 |
| D | 0 | 10 | 0 |
| Mode M0 | |||
|---|---|---|---|
| Quadrant | BADHDUFLAG | Total packets | Discarded packets |
| A | 0 | 22593 | 2 |
| B | 0 | 17183 | 2 |
| C | 0 | 14618 | 3 |
| D | 0 | 26487 | 2 |
| Quadrant | Total seconds | Saturated seconds | Saturation percentage |
|---|---|---|---|
| A | 6971 | 278 | 3.987950% |
| B | 6972 | 289 | 4.145152% |
| C | 6971 | 84 | 1.204992% |
| D | 6971 | 865 | 12.408550% |
Noise dominated data is calculated using 1-second bins in cleaned event files. If a bin has >2000 counts, and if more than 50% of those come from <1% of pixels, then it is considered to be noise-dominated and hence unusable.
| Quadrant | # 1 sec bins | Bins with >0 counts | Bins with >2000 counts | High rate bins dominated by noise | Noise dominated (total time) | Noise dominated (detector-on time) | Marked lightcurve |
|---|---|---|---|---|---|---|---|
| A | 7931 | 6972 | 4 | 4 | 0.05% | 0.06% | 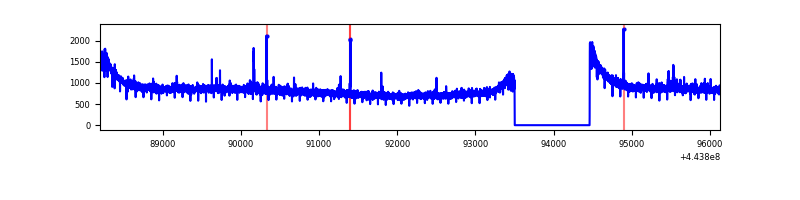 |
| B | 7932 | 6973 | 70 | 70 | 0.88% | 1.00% | 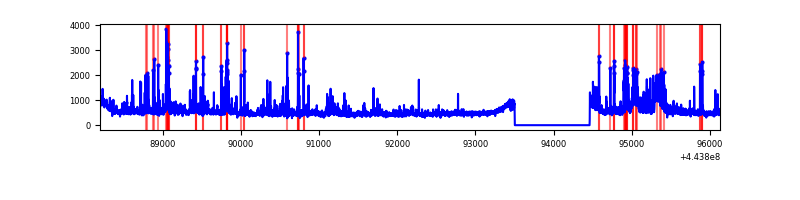 |
| C | 7931 | 6972 | 5 | 5 | 0.06% | 0.07% | 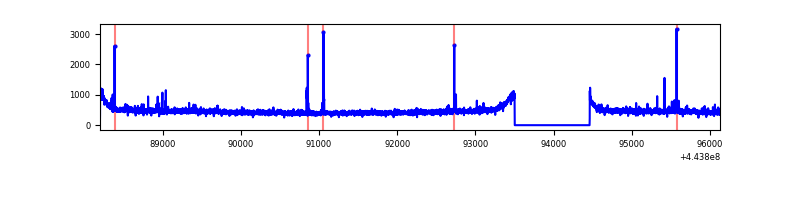 |
| D | 7931 | 6972 | 562 | 562 | 7.09% | 8.06% | 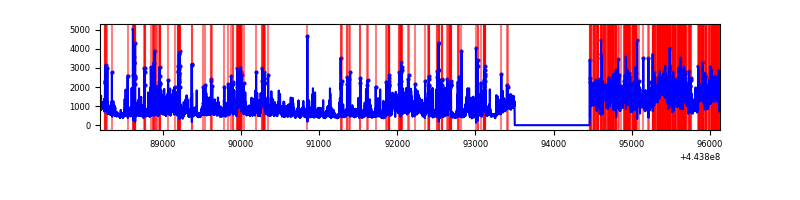 |
Top three noisy pixels from each quadrant. If the there are fewer than three noisy pixels in the level2.evt file, extra rows are filled as -1
| Pixel properties | Quadrant properties | ||||||
|---|---|---|---|---|---|---|---|
| Quadrant | DetID | PixID | Counts | Sigma | Mean | Median | Sigma |
| A | 10 | 83 | 2747289 | 16020.13 | 824 | 806 | 171.4 |
| A | 0 | 243 | 36756 | 209.69 | 824 | 806 | 171.4 |
| A | 13 | 248 | 22132 | 124.39 | 824 | 806 | 171.4 |
| B | 4 | 171 | 332554 | 2058.06 | 821 | 796 | 161.2 |
| B | 5 | 255 | 179551 | 1108.91 | 821 | 796 | 161.2 |
| B | 0 | 155 | 136150 | 839.67 | 821 | 796 | 161.2 |
| C | 15 | 208 | 32281 | 164.3 | 815 | 820 | 191.5 |
| C | 1 | 3 | 26106 | 132.05 | 815 | 820 | 191.5 |
| C | 2 | 14 | 19302 | 96.52 | 815 | 820 | 191.5 |
| D | 13 | 174 | 1301532 | 6568.24 | 790 | 768 | 198.0 |
| D | 1 | 52 | 1288761 | 6503.75 | 790 | 768 | 198.0 |
| D | 13 | 249 | 266116 | 1339.88 | 790 | 768 | 198.0 |
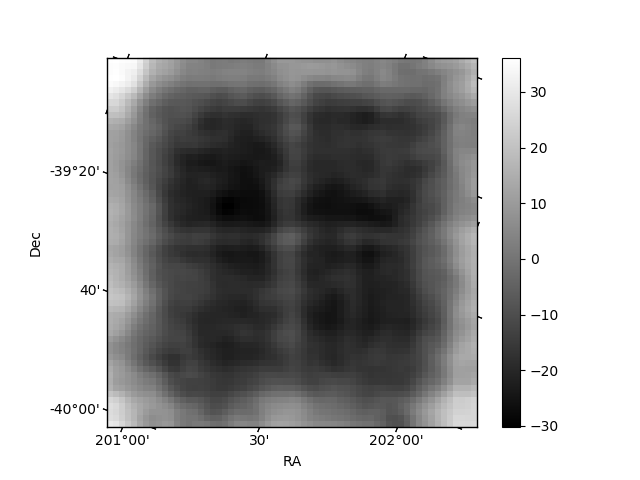
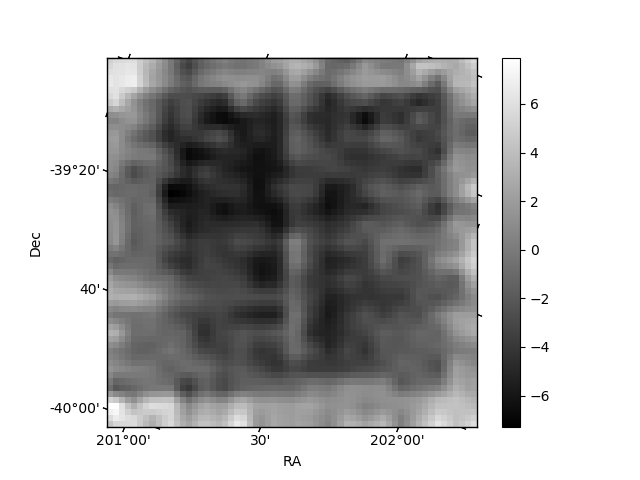
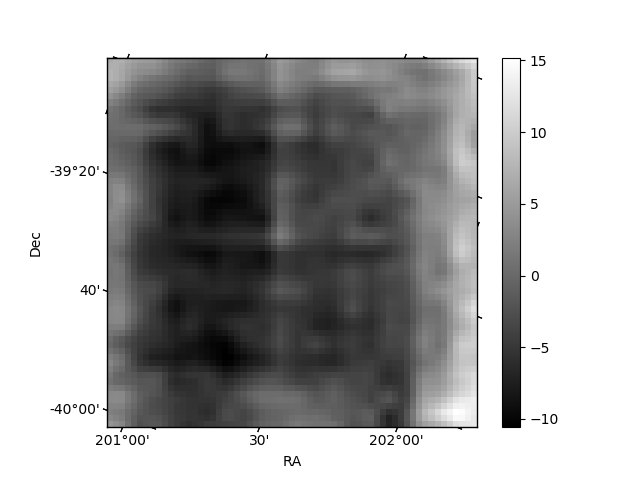
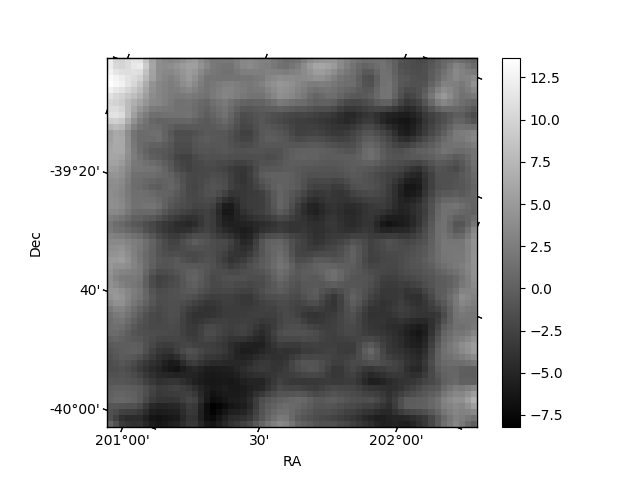
Histogram calculated using DETX and DETY for each event in the final _common_clean file
| Quadrant A | 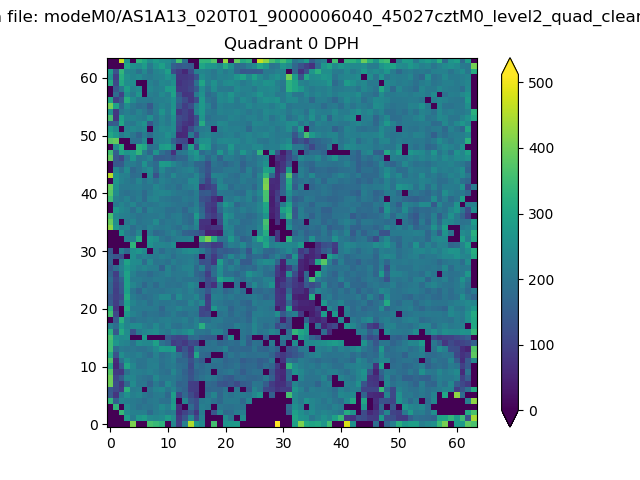 |
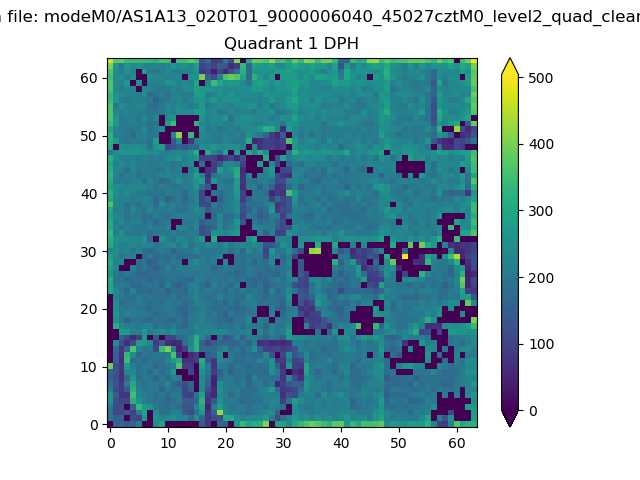 |
Quadrant B |
|---|---|---|---|
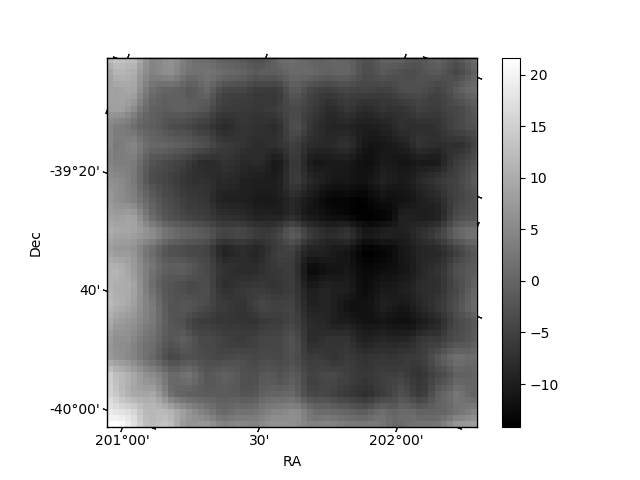
| Quadrant D | 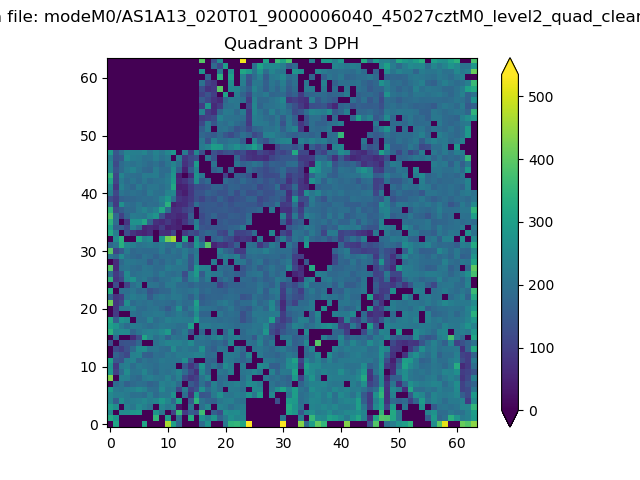 |
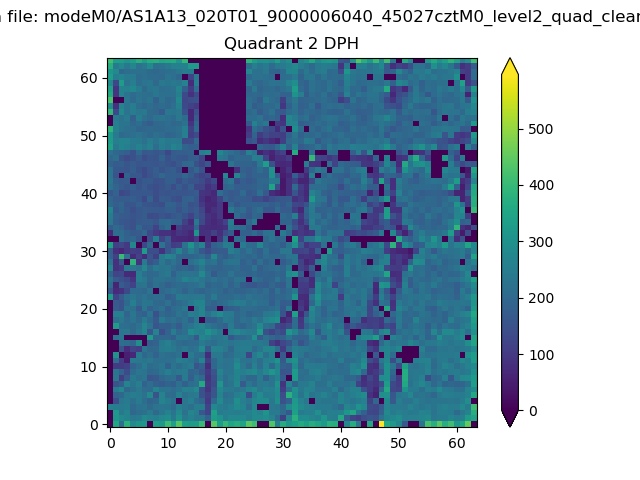 |
Quadrant C |
| Plot type | Count rate plots | Images |
|---|---|---|
| Comparison with Poisson distribution Blue bars denote a histogram of data divided into 1 sec bins. Red curve is a Poisson curve with rate = median count rate of data. |
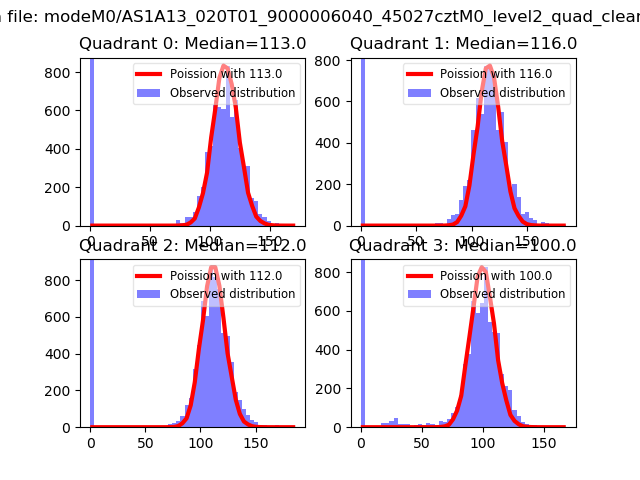 |
 |
| Quadrant-wise count rates Data is divided into 100 sec bins |
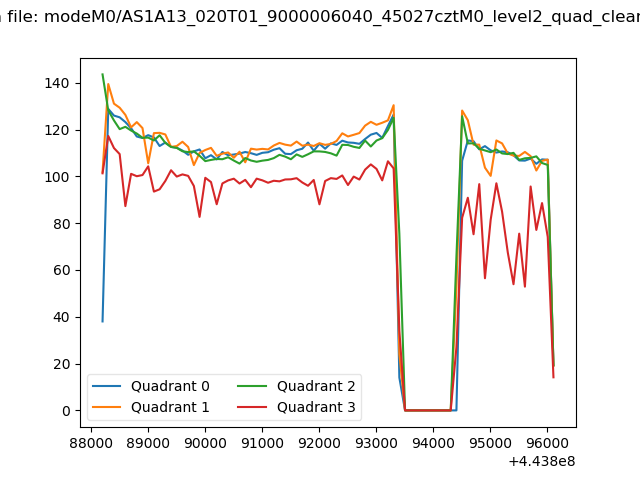 |
|
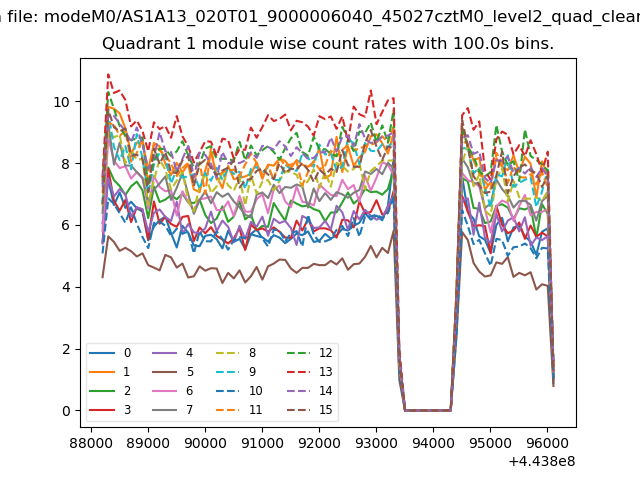
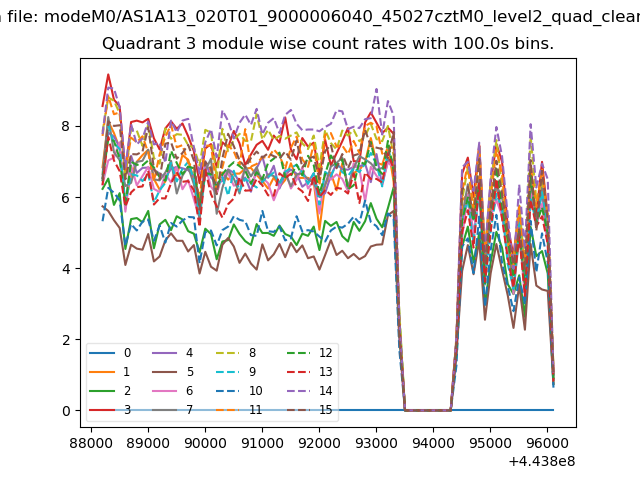
| Module-wise count rates for Quadrant A Data is divided into 100 sec bins |
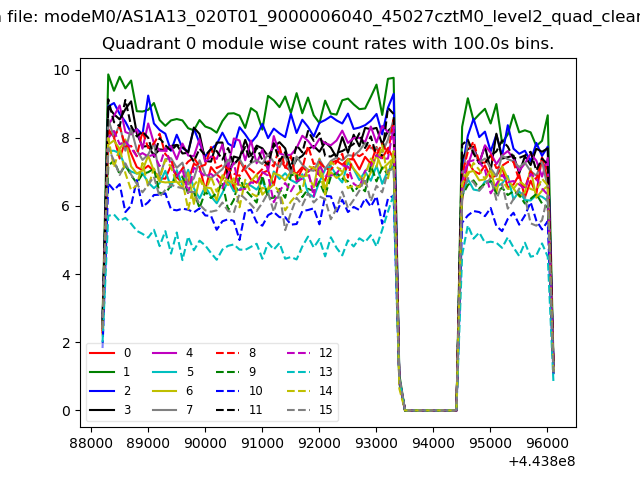 |
 |
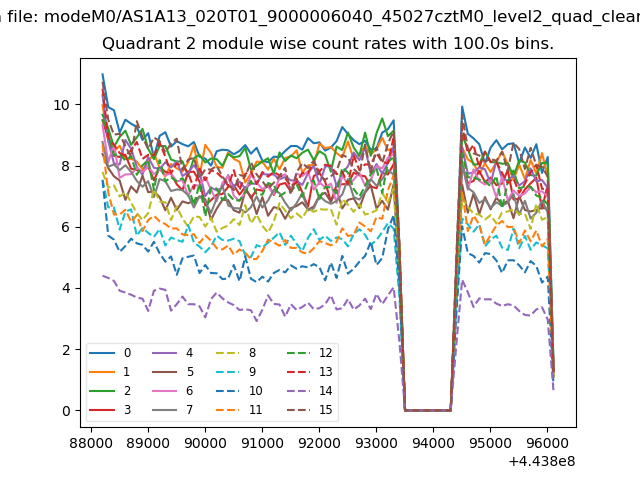
| Module-wise count rates for Quadrant B Data is divided into 100 sec bins |
 |
 |
| Module-wise count rates for Quadrant C Data is divided into 100 sec bins |
 |
 |
| Module-wise count rates for Quadrant D Data is divided into 100 sec bins |
 |
 |
| Parameter | Plot |
|---|---|
| CZT HV Monitor | 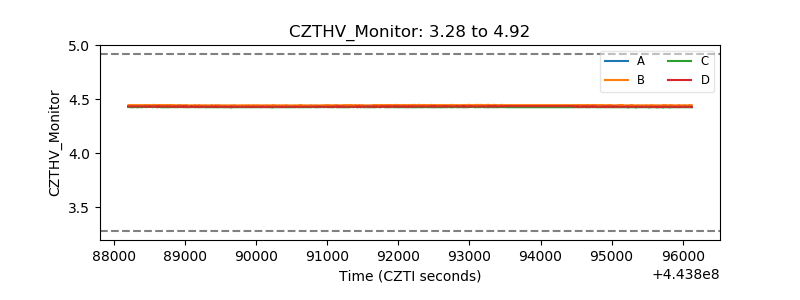 |
| D_VDD | 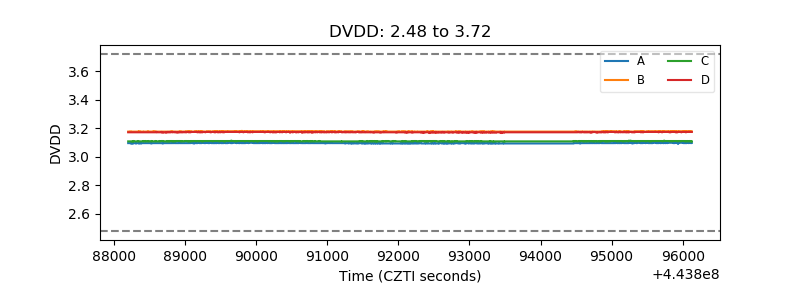 |
| Temperature 1 | 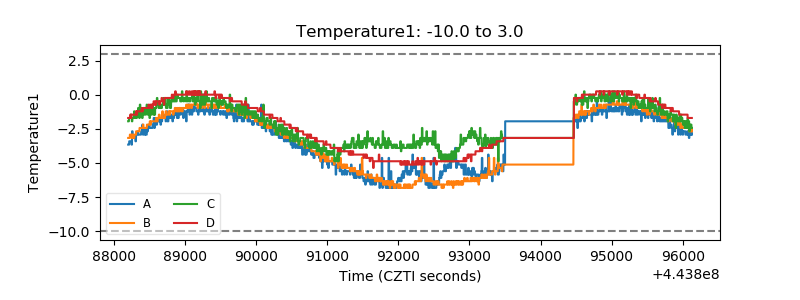 |
| Veto HV Monitor | 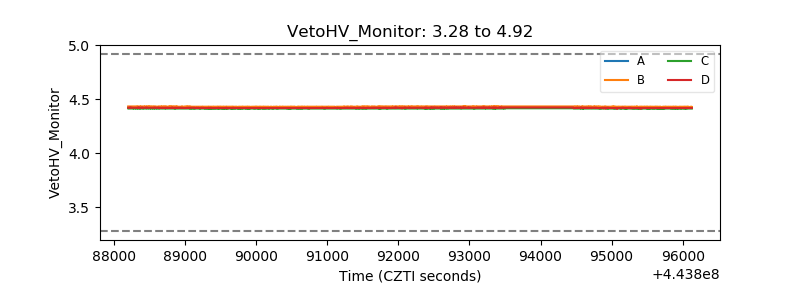 |
| Veto LLD | 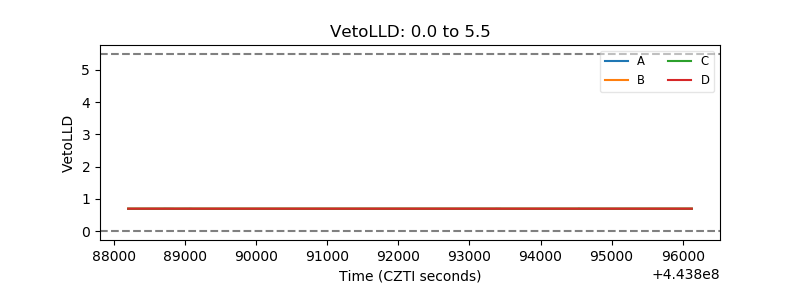 |
| Alpha Counter | 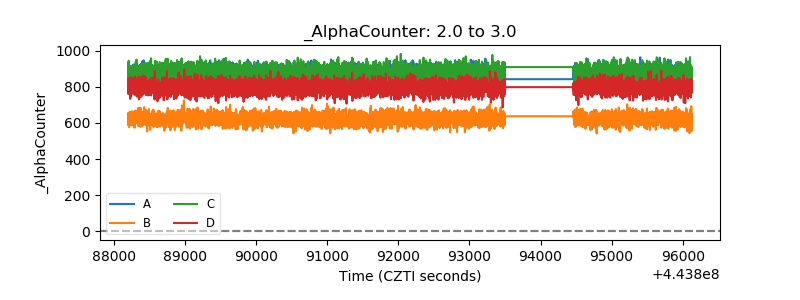 |
| _CPM_Rate | 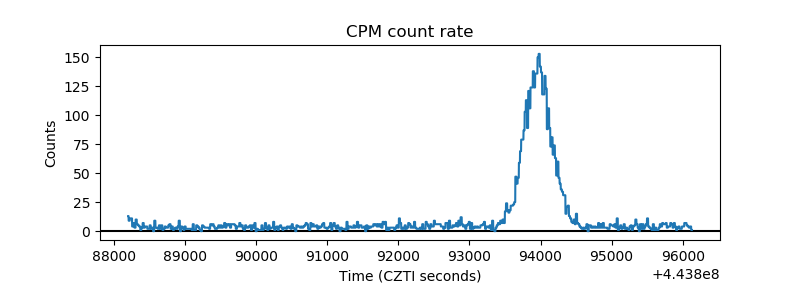 |
| CZT Counter | 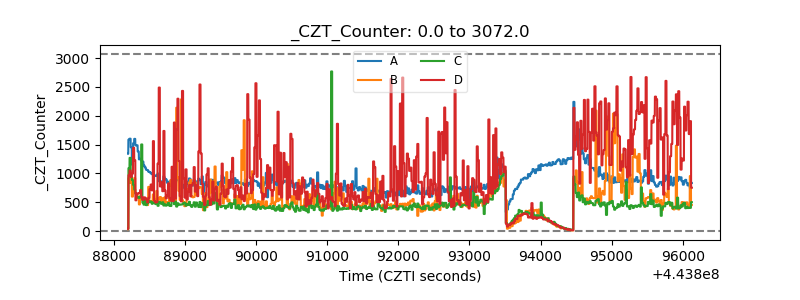 |
| +2.5 Volts monitor | 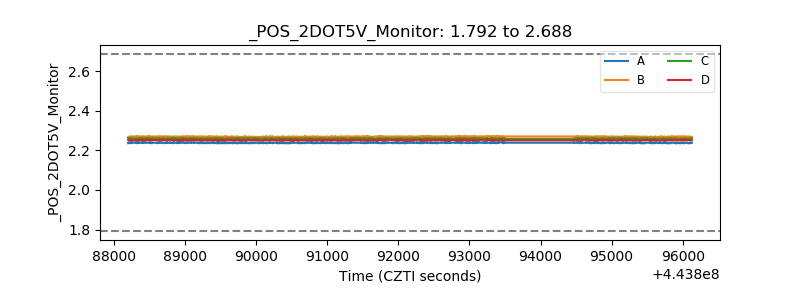 |
| +5 Volts monitor | 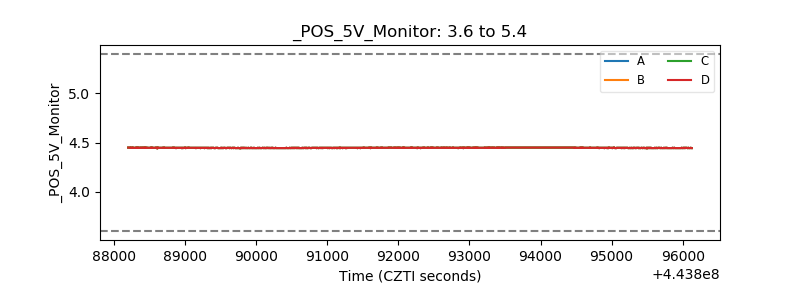 |
| _ROLL_ROT | 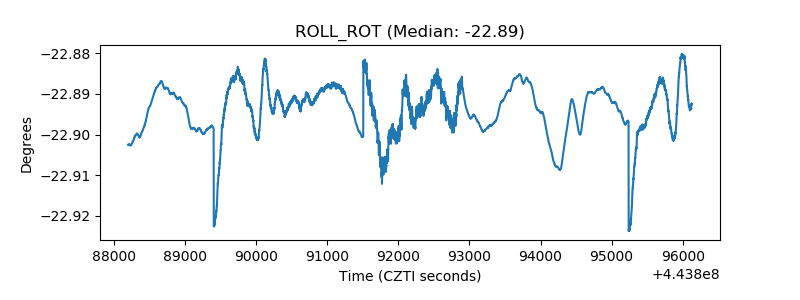 |
| _Roll_DEC | 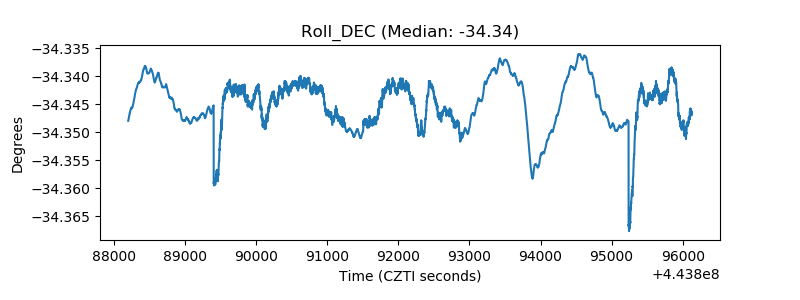 |
| _Roll_RA | 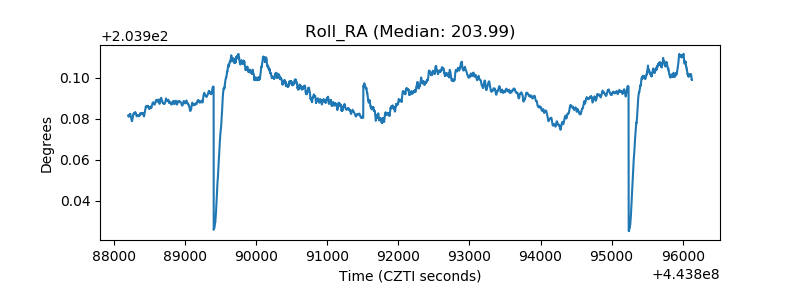 |
| Veto Counter | 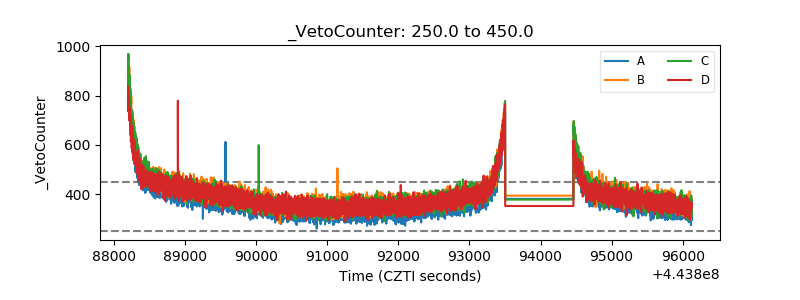 |