| Param | Original file | Final file |
|---|---|---|
| Filename | modeM0/AS1A13_020T01_9000006040_45028cztM0_level2.fits | modeM0/AS1A13_020T01_9000006040_45028cztM0_level2_quad_clean.evt |
| Size (bytes) | 617,938,560 | 98,193,600 |
| Size | 589.3 MB | 93.6 MB |
| Events in quadrant A | 5,297,923 | 681,944 |
| Events in quadrant B | 4,071,288 | 694,780 |
| Events in quadrant C | 3,186,156 | 691,458 |
| Events in quadrant D | 9,817,079 | 453,763 |
| Mode SS | |||
|---|---|---|---|
| Quadrant | BADHDUFLAG | Total packets | Discarded packets |
| A | 0 | 132 | 0 |
| B | 0 | 132 | 0 |
| C | 0 | 132 | 0 |
| D | 0 | 132 | 0 |
| Mode M9 | |||
|---|---|---|---|
| Quadrant | BADHDUFLAG | Total packets | Discarded packets |
| A | 0 | 6 | 0 |
| B | 0 | 6 | 0 |
| C | 0 | 6 | 0 |
| D | 0 | 6 | 0 |
| Mode M0 | |||
|---|---|---|---|
| Quadrant | BADHDUFLAG | Total packets | Discarded packets |
| A | 0 | 20471 | 1 |
| B | 0 | 16563 | 1 |
| C | 0 | 14218 | 1 |
| D | 0 | 33713 | 1 |
| Quadrant | Total seconds | Saturated seconds | Saturation percentage |
|---|---|---|---|
| A | 6468 | 248 | 3.834261% |
| B | 6468 | 320 | 4.947434% |
| C | 6468 | 134 | 2.071738% |
| D | 6468 | 2148 | 33.209647% |
Noise dominated data is calculated using 1-second bins in cleaned event files. If a bin has >2000 counts, and if more than 50% of those come from <1% of pixels, then it is considered to be noise-dominated and hence unusable.
| Quadrant | # 1 sec bins | Bins with >0 counts | Bins with >2000 counts | High rate bins dominated by noise | Noise dominated (total time) | Noise dominated (detector-on time) | Marked lightcurve |
|---|---|---|---|---|---|---|---|
| A | 6988 | 6470 | 3 | 3 | 0.04% | 0.05% | 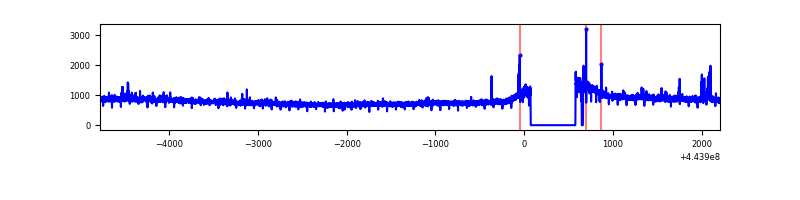 |
| B | 6988 | 6470 | 111 | 111 | 1.59% | 1.72% | 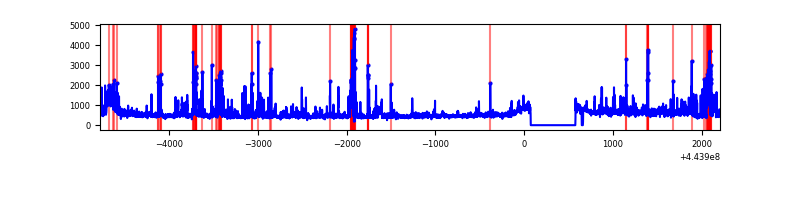 |
| C | 6988 | 6470 | 44 | 44 | 0.63% | 0.68% | 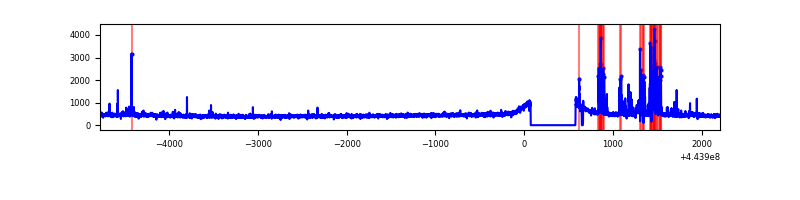 |
| D | 6988 | 6470 | 1805 | 1805 | 25.83% | 27.90% | 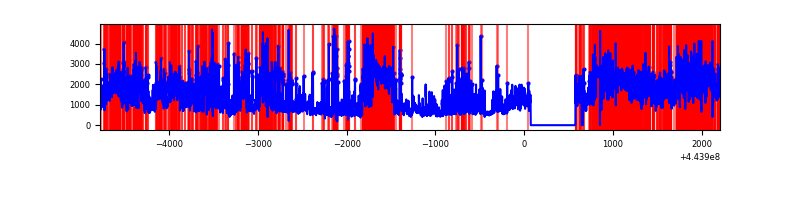 |
Top three noisy pixels from each quadrant. If the there are fewer than three noisy pixels in the level2.evt file, extra rows are filled as -1
| Pixel properties | Quadrant properties | ||||||
|---|---|---|---|---|---|---|---|
| Quadrant | DetID | PixID | Counts | Sigma | Mean | Median | Sigma |
| A | 10 | 83 | 2356179 | 15325.51 | 739 | 723 | 153.7 |
| A | 0 | 243 | 42921 | 274.56 | 739 | 723 | 153.7 |
| A | 13 | 248 | 28540 | 180.99 | 739 | 723 | 153.7 |
| B | 5 | 255 | 341604 | 2333.67 | 736 | 714 | 146.1 |
| B | 4 | 171 | 281730 | 1923.78 | 736 | 714 | 146.1 |
| B | 0 | 189 | 217124 | 1481.5 | 736 | 714 | 146.1 |
| C | 14 | 254 | 215793 | 1250.53 | 727 | 730 | 172.0 |
| C | 12 | 2 | 73284 | 421.88 | 727 | 730 | 172.0 |
| C | 15 | 208 | 28635 | 162.26 | 727 | 730 | 172.0 |
| D | 13 | 174 | 2389847 | 14502.68 | 642 | 621 | 164.7 |
| D | 1 | 52 | 1517968 | 9210.35 | 642 | 621 | 164.7 |
| D | 13 | 187 | 961212 | 5830.82 | 642 | 621 | 164.7 |
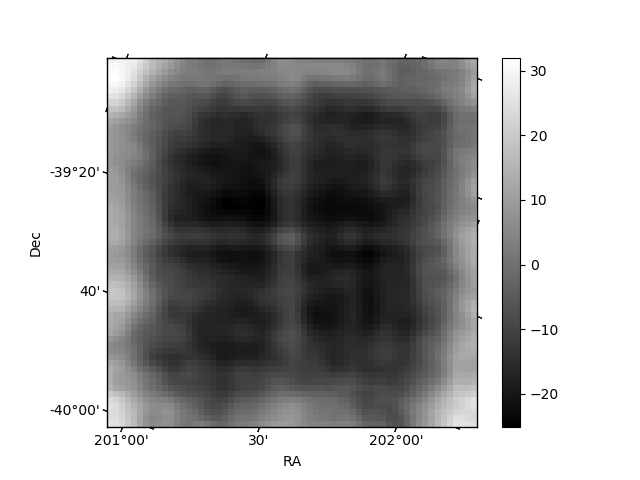
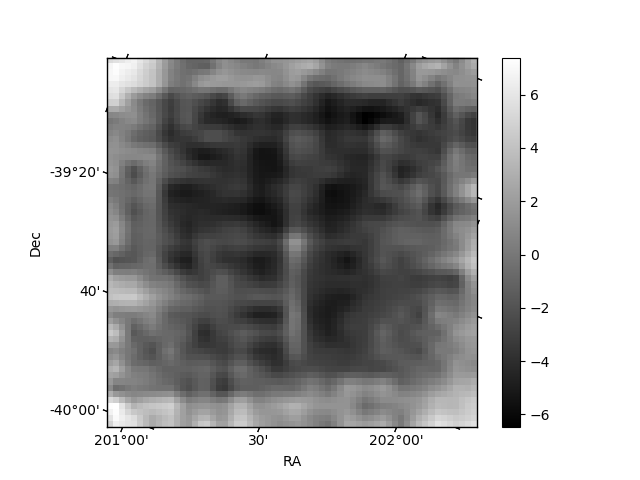
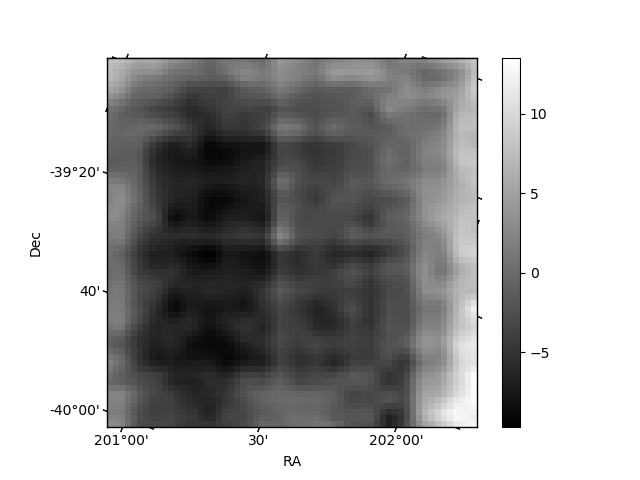
Histogram calculated using DETX and DETY for each event in the final _common_clean file
| Quadrant A | 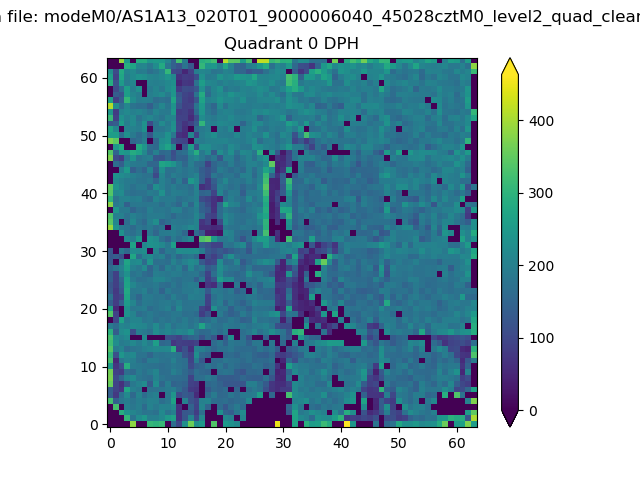 |
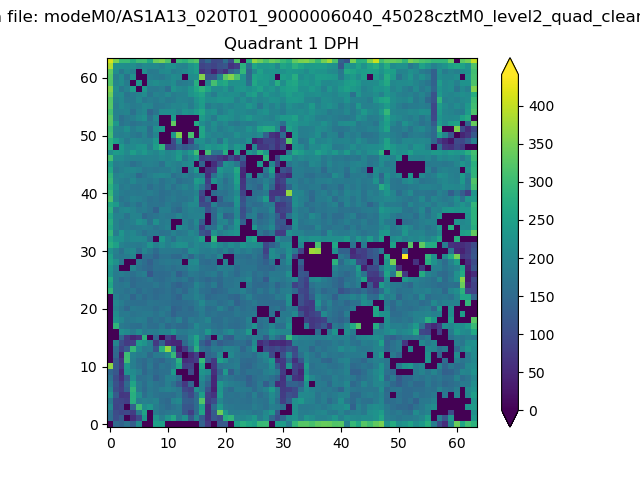 |
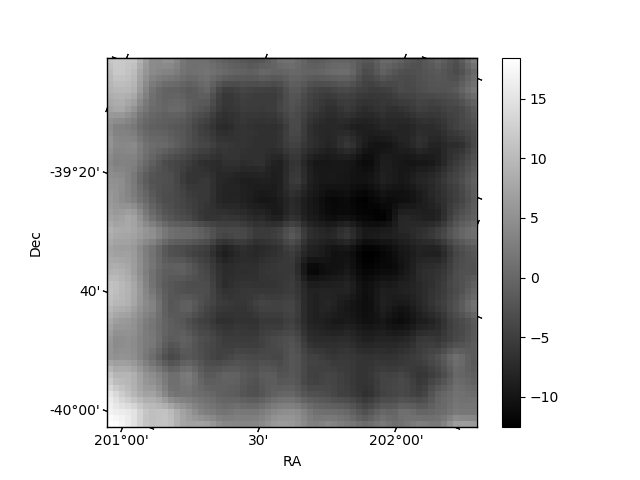
Quadrant B |
|---|---|---|---|
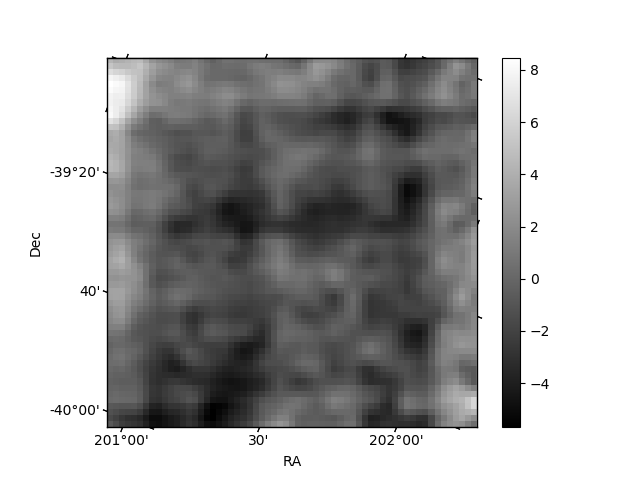
| Quadrant D | 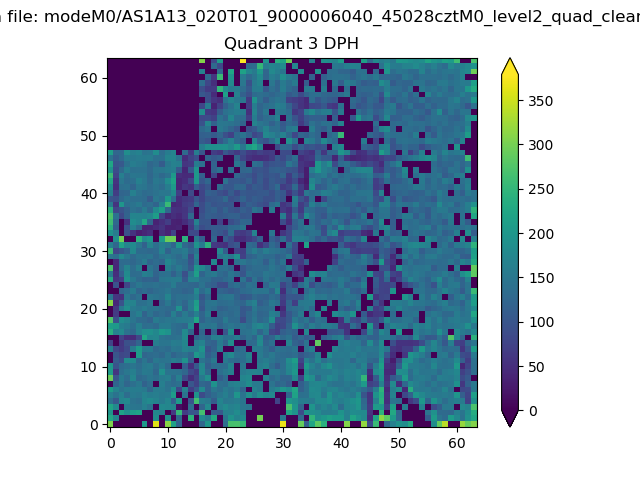 |
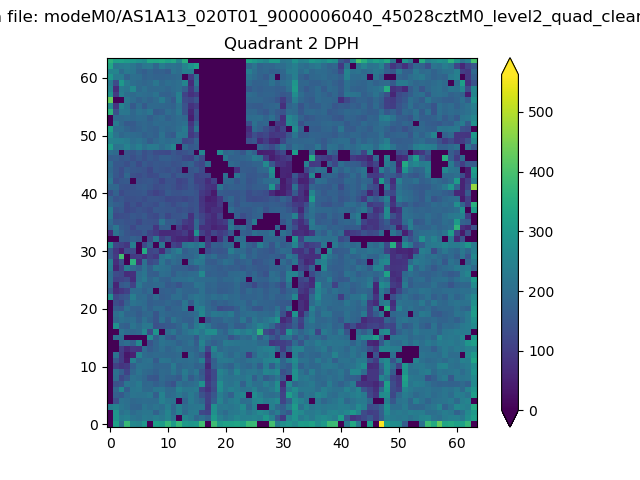 |
Quadrant C |
| Plot type | Count rate plots | Images |
|---|---|---|
| Comparison with Poisson distribution Blue bars denote a histogram of data divided into 1 sec bins. Red curve is a Poisson curve with rate = median count rate of data. |
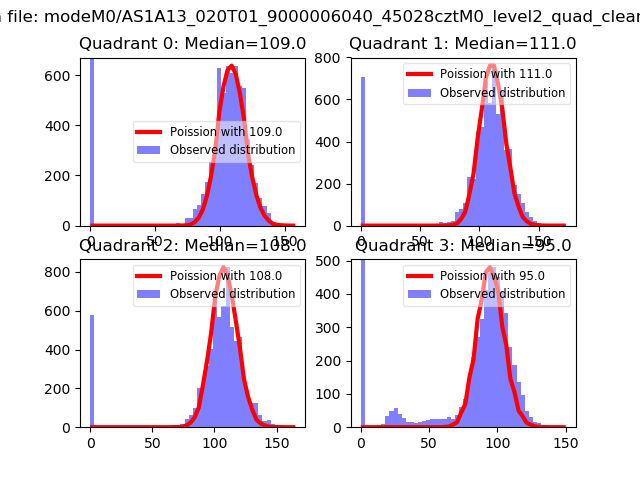 |
 |
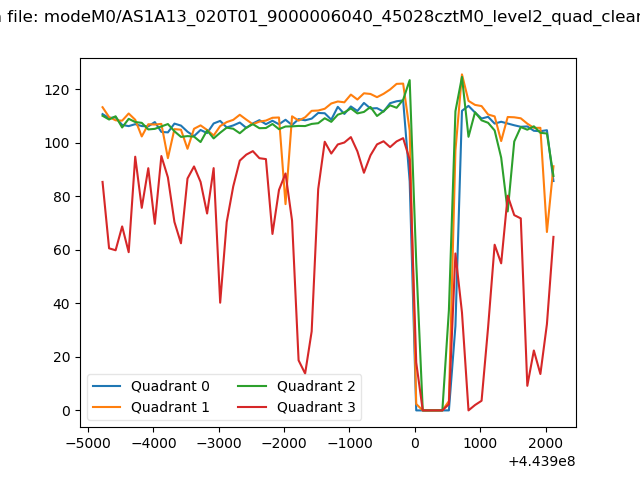
| Quadrant-wise count rates Data is divided into 100 sec bins |
 |
|
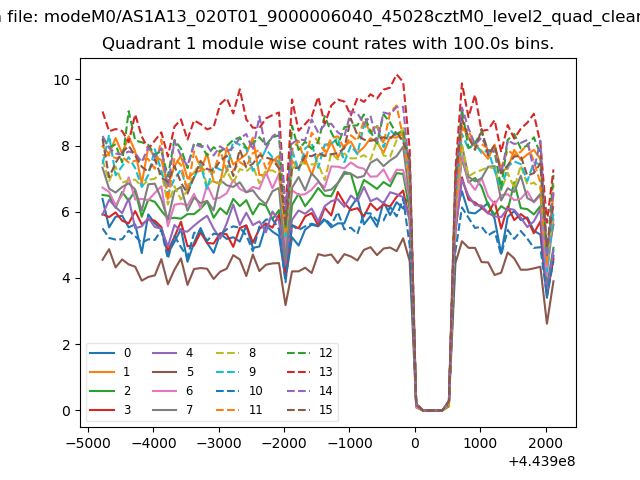
| Module-wise count rates for Quadrant A Data is divided into 100 sec bins |
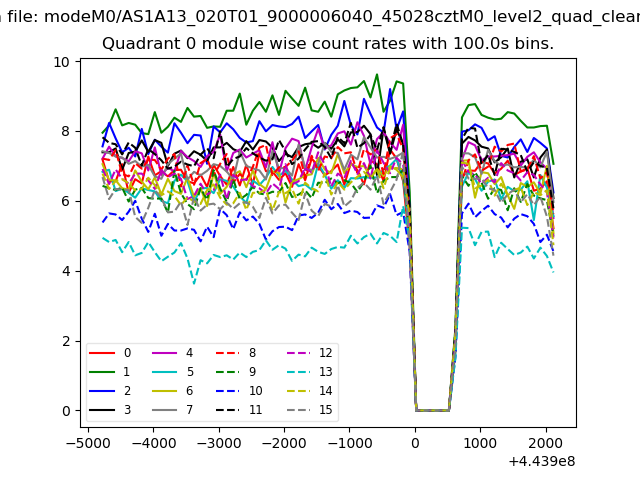 |
 |
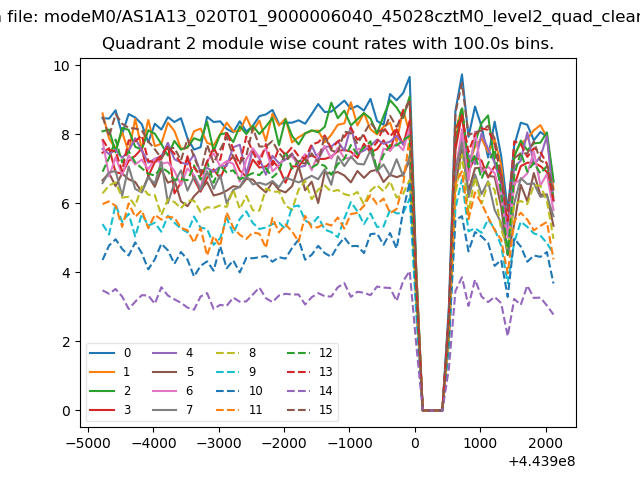
| Module-wise count rates for Quadrant B Data is divided into 100 sec bins |
 |
 |
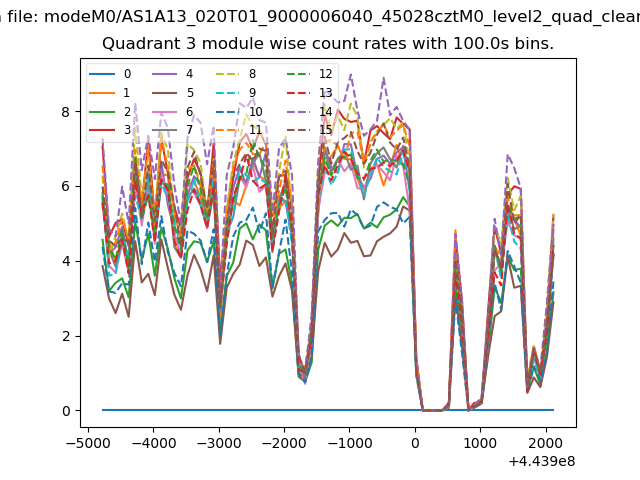
| Module-wise count rates for Quadrant C Data is divided into 100 sec bins |
 |
 |
| Module-wise count rates for Quadrant D Data is divided into 100 sec bins |
 |
 |
| Parameter | Plot |
|---|---|
| CZT HV Monitor | 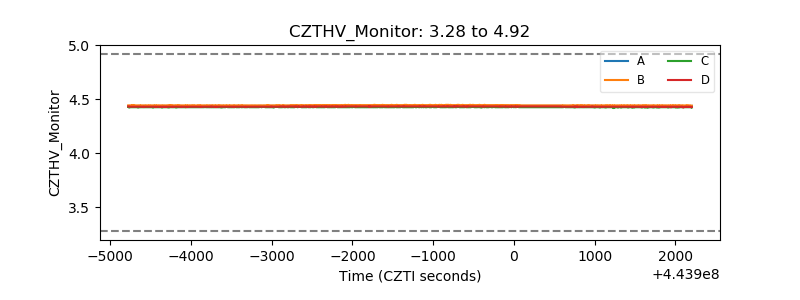 |
| D_VDD | 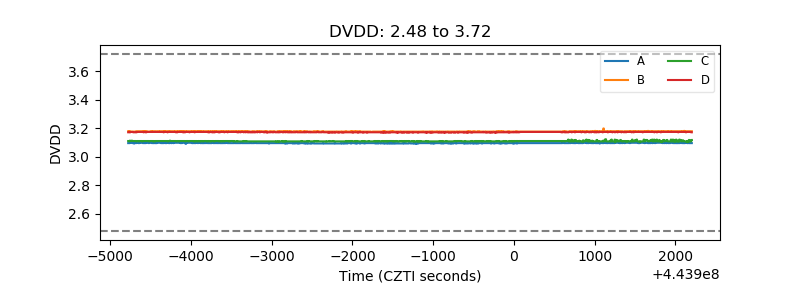 |
| Temperature 1 | 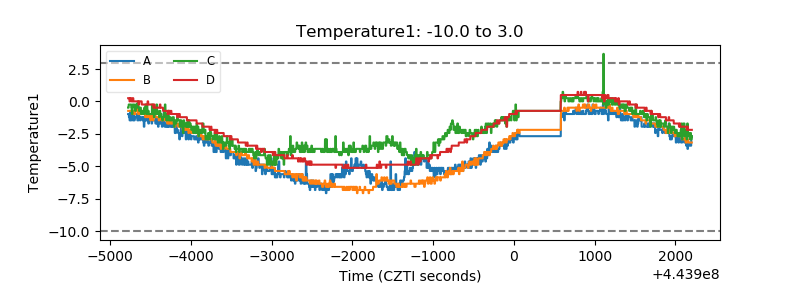 |
| Veto HV Monitor | 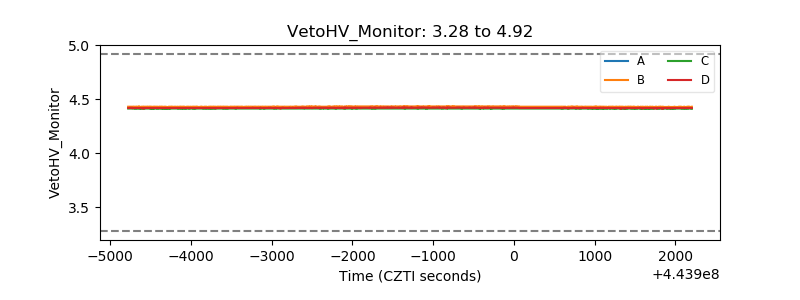 |
| Veto LLD | 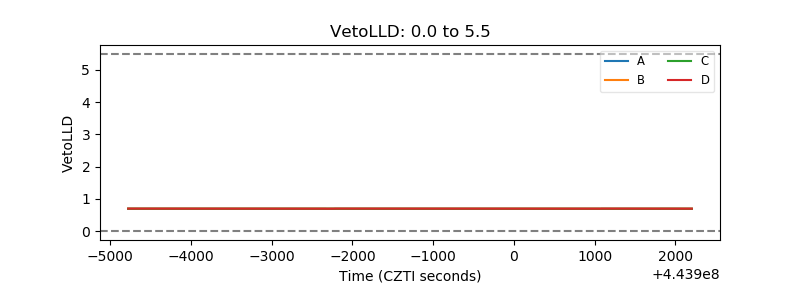 |
| Alpha Counter | 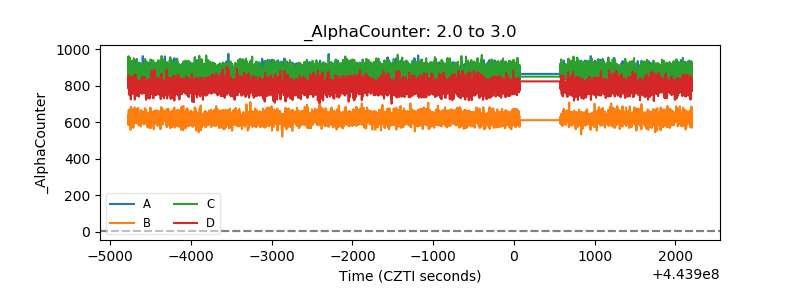 |
| _CPM_Rate | 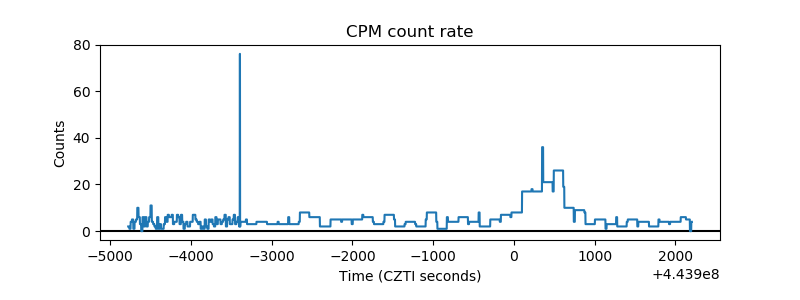 |
| CZT Counter |  |
| +2.5 Volts monitor | 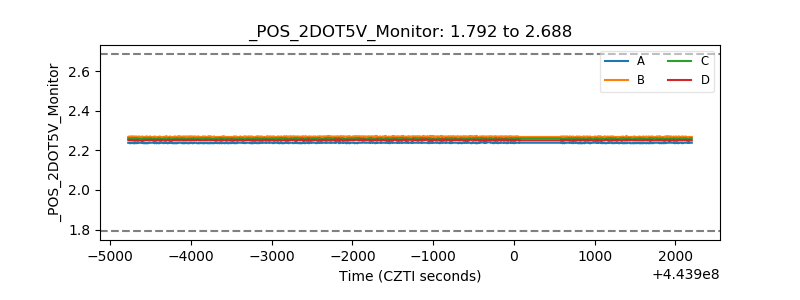 |
| +5 Volts monitor | 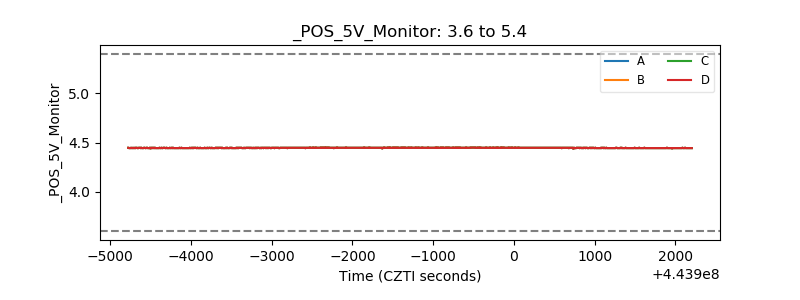 |
| _ROLL_ROT | 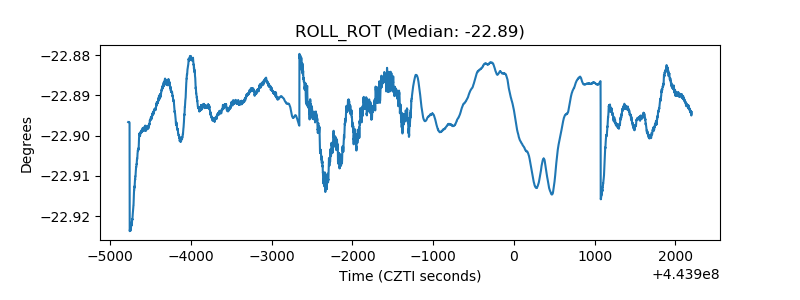 |
| _Roll_DEC | 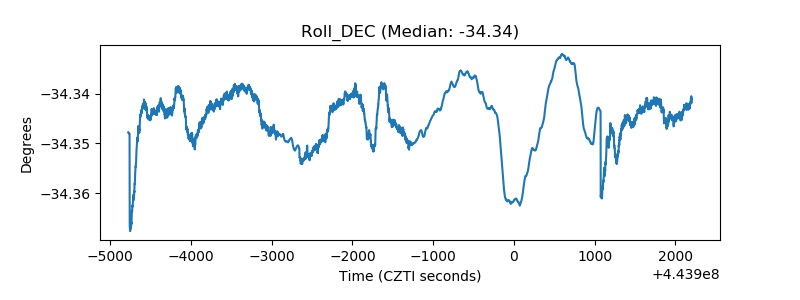 |
| _Roll_RA | 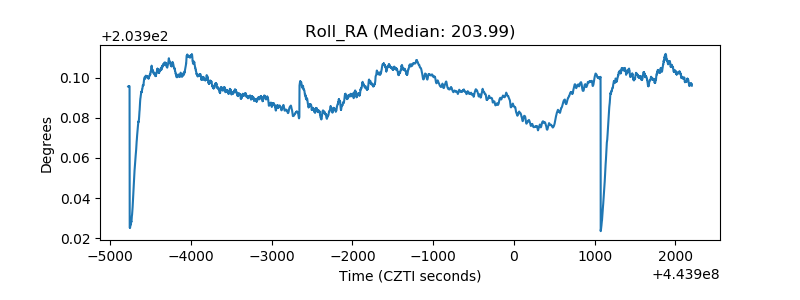 |
| Veto Counter | 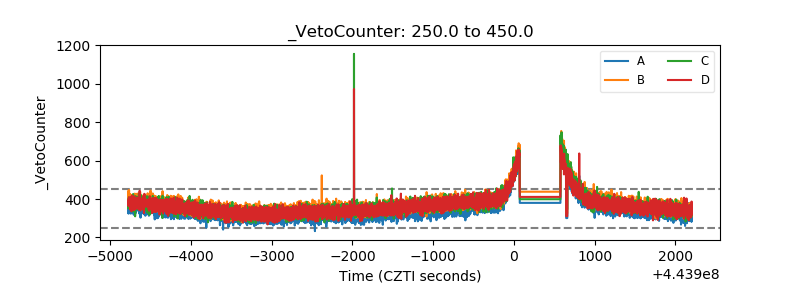 |