| Param | Original file | Final file |
|---|---|---|
| Filename | modeM0/AS1A13_020T01_9000006040_45029cztM0_level2.fits | modeM0/AS1A13_020T01_9000006040_45029cztM0_level2_quad_clean.evt |
| Size (bytes) | 630,524,160 | 110,134,080 |
| Size | 601.3 MB | 105.0 MB |
| Events in quadrant A | 5,779,941 | 755,979 |
| Events in quadrant B | 4,460,844 | 764,697 |
| Events in quadrant C | 3,407,430 | 752,307 |
| Events in quadrant D | 9,142,361 | 567,762 |
| Mode SS | |||
|---|---|---|---|
| Quadrant | BADHDUFLAG | Total packets | Discarded packets |
| A | 0 | 140 | 0 |
| B | 0 | 140 | 0 |
| C | 0 | 140 | 0 |
| D | 0 | 142 | 0 |
| Mode M0 | |||
|---|---|---|---|
| Quadrant | BADHDUFLAG | Total packets | Discarded packets |
| A | 0 | 22365 | 0 |
| B | 0 | 18172 | 0 |
| C | 0 | 15404 | 0 |
| D | 0 | 32115 | 0 |
| Quadrant | Total seconds | Saturated seconds | Saturation percentage |
|---|---|---|---|
| A | 7092 | 208 | 2.932882% |
| B | 7091 | 343 | 4.837117% |
| C | 7091 | 116 | 1.635876% |
| D | 7091 | 1582 | 22.309970% |
Noise dominated data is calculated using 1-second bins in cleaned event files. If a bin has >2000 counts, and if more than 50% of those come from <1% of pixels, then it is considered to be noise-dominated and hence unusable.
| Quadrant | # 1 sec bins | Bins with >0 counts | Bins with >2000 counts | High rate bins dominated by noise | Noise dominated (total time) | Noise dominated (detector-on time) | Marked lightcurve |
|---|---|---|---|---|---|---|---|
| A | 7092 | 7092 | 14 | 14 | 0.20% | 0.20% | 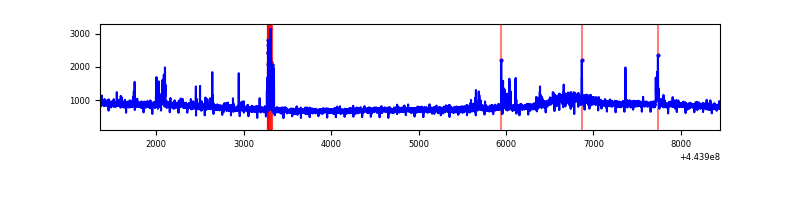 |
| B | 7091 | 7091 | 115 | 115 | 1.62% | 1.62% | 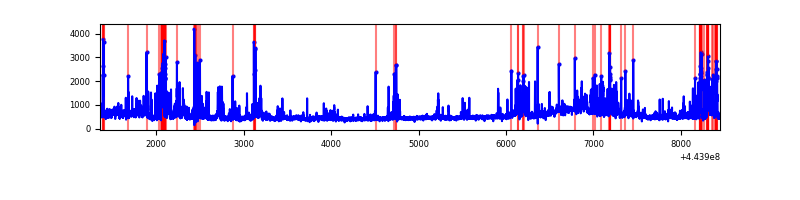 |
| C | 7091 | 7091 | 58 | 58 | 0.82% | 0.82% | 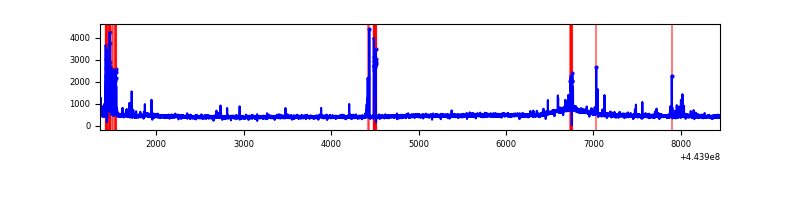 |
| D | 7091 | 7091 | 1256 | 1256 | 17.71% | 17.71% | 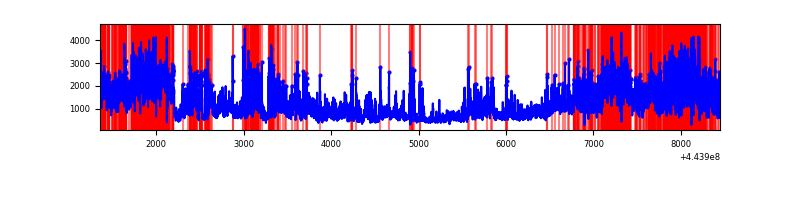 |
Top three noisy pixels from each quadrant. If the there are fewer than three noisy pixels in the level2.evt file, extra rows are filled as -1
| Pixel properties | Quadrant properties | ||||||
|---|---|---|---|---|---|---|---|
| Quadrant | DetID | PixID | Counts | Sigma | Mean | Median | Sigma |
| A | 10 | 83 | 2461887 | 14375.42 | 810 | 792 | 171.2 |
| A | 13 | 248 | 101730 | 589.59 | 810 | 792 | 171.2 |
| A | 0 | 243 | 56450 | 325.1 | 810 | 792 | 171.2 |
| B | 5 | 255 | 314248 | 1995.98 | 803 | 778 | 157.1 |
| B | 4 | 171 | 240002 | 1523.23 | 803 | 778 | 157.1 |
| B | 0 | 189 | 139564 | 883.7 | 803 | 778 | 157.1 |
| C | 14 | 254 | 142605 | 761.88 | 788 | 794 | 186.1 |
| C | 1 | 3 | 136638 | 729.82 | 788 | 794 | 186.1 |
| C | 12 | 2 | 21881 | 113.29 | 788 | 794 | 186.1 |
| D | 13 | 174 | 3457486 | 18362.88 | 735 | 711 | 188.2 |
| D | 5 | 235 | 1036087 | 5500.06 | 735 | 711 | 188.2 |
| D | 11 | 241 | 448899 | 2380.84 | 735 | 711 | 188.2 |
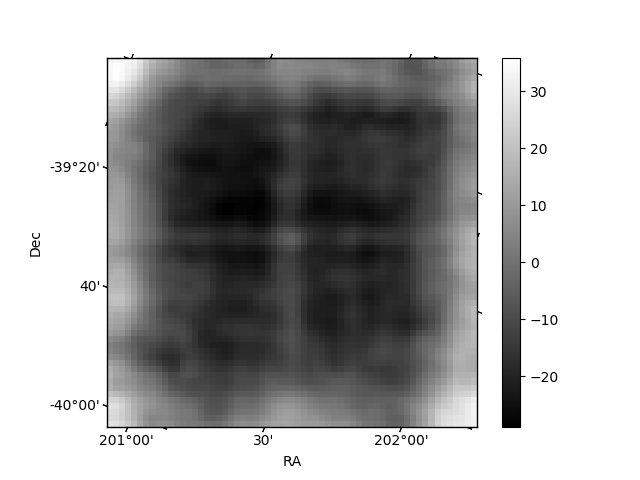
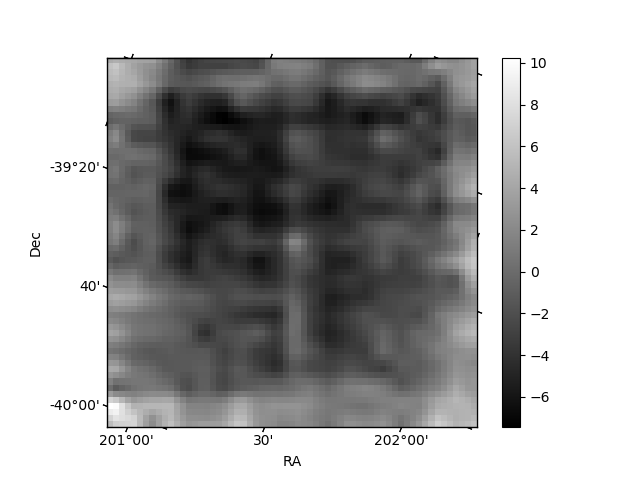
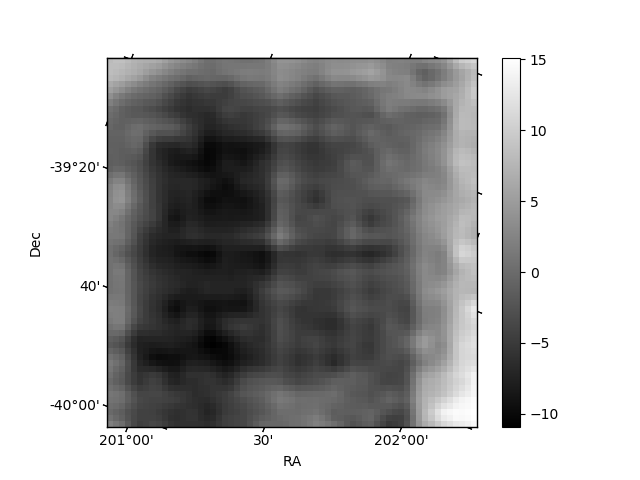
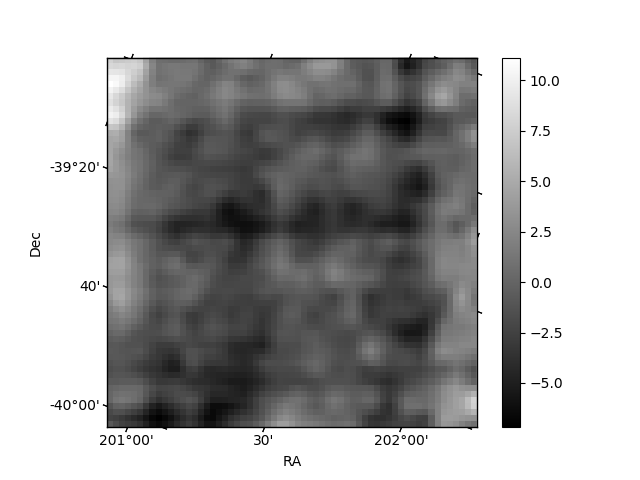
Histogram calculated using DETX and DETY for each event in the final _common_clean file
| Quadrant A | 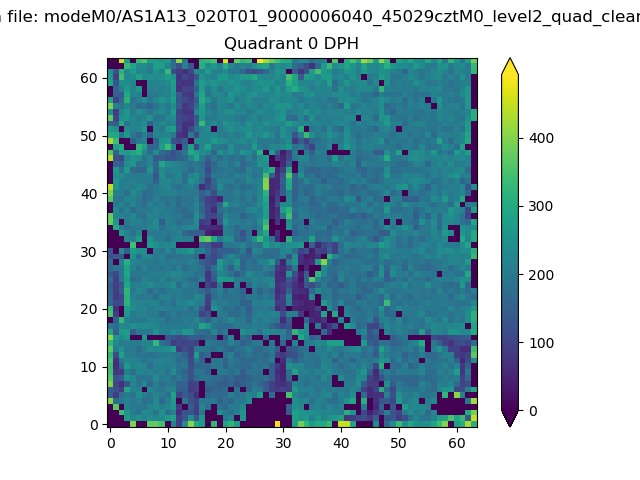 |
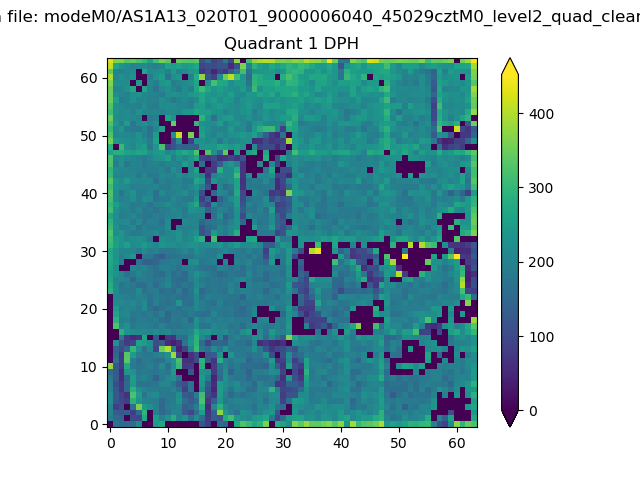 |
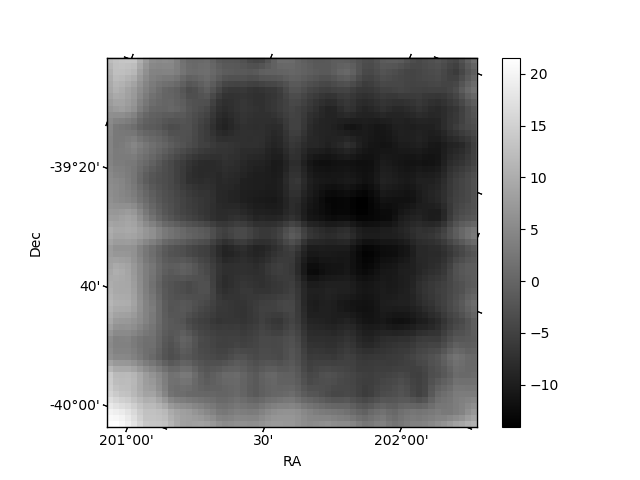
Quadrant B |
|---|---|---|---|
| Quadrant D | 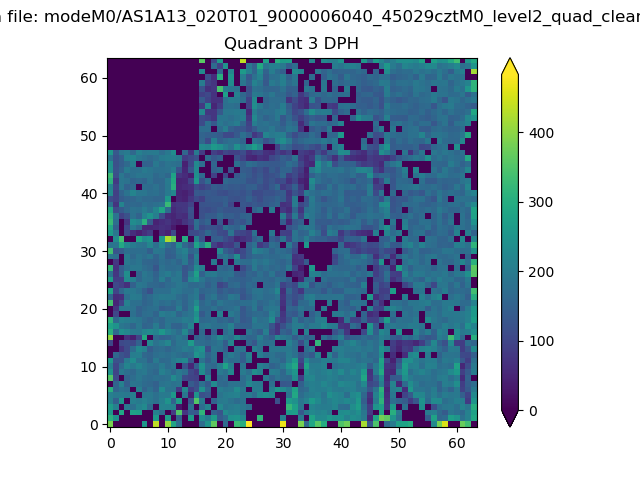 |
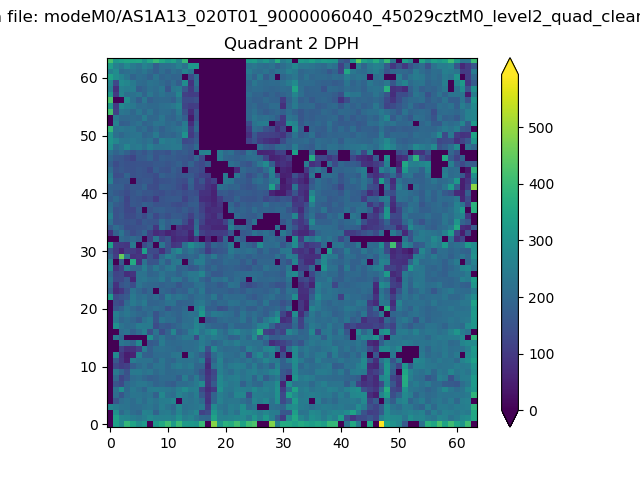 |
Quadrant C |
| Plot type | Count rate plots | Images |
|---|---|---|
| Comparison with Poisson distribution Blue bars denote a histogram of data divided into 1 sec bins. Red curve is a Poisson curve with rate = median count rate of data. |
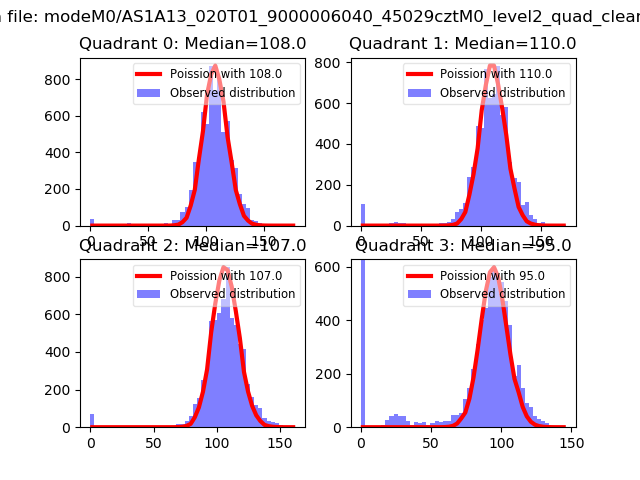 |
 |
| Quadrant-wise count rates Data is divided into 100 sec bins |
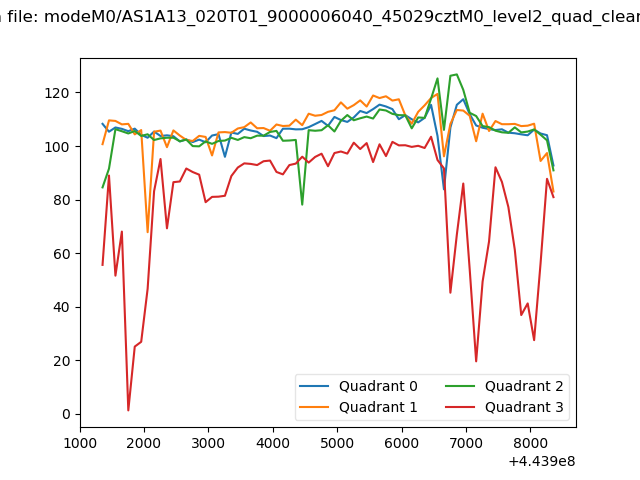 |
|
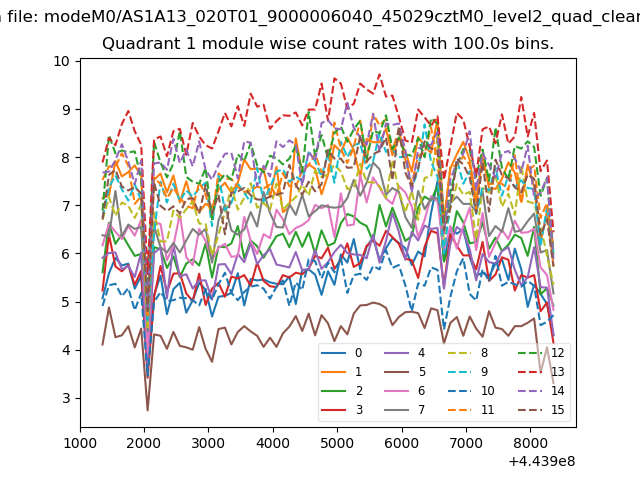
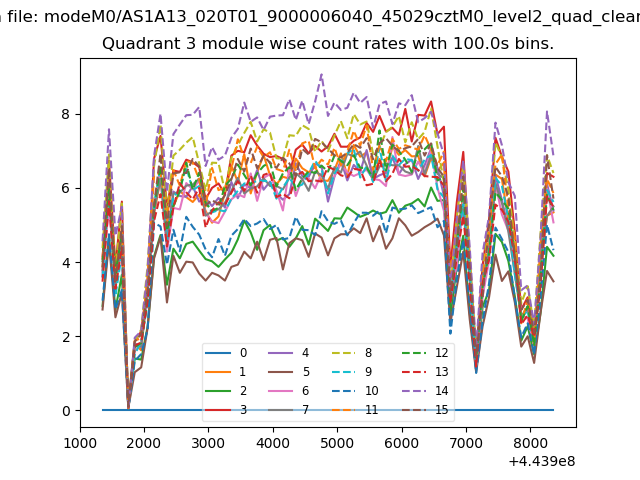
| Module-wise count rates for Quadrant A Data is divided into 100 sec bins |
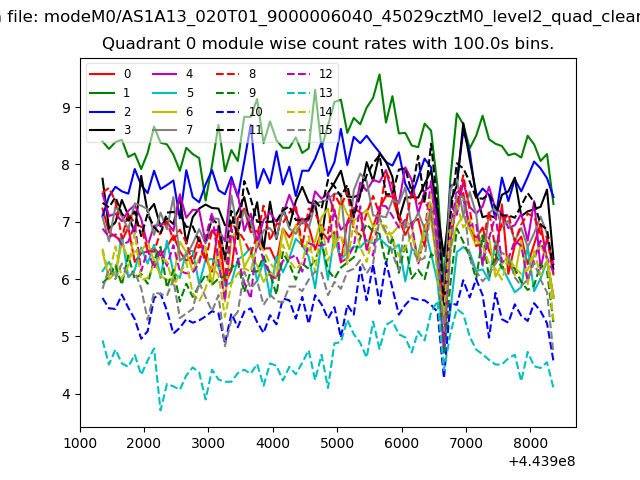 |
 |
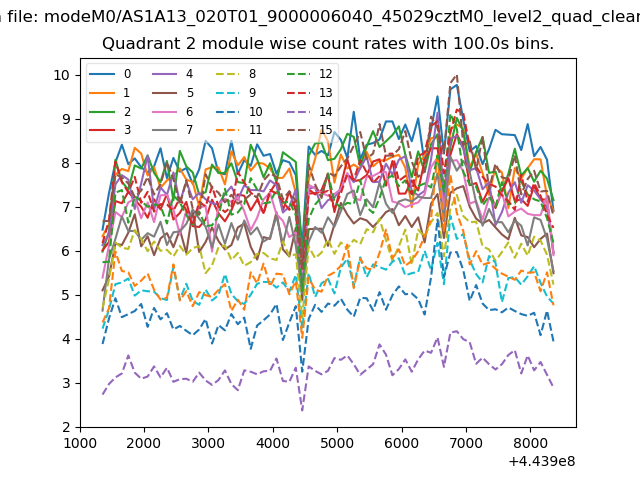
| Module-wise count rates for Quadrant B Data is divided into 100 sec bins |
 |
 |
| Module-wise count rates for Quadrant C Data is divided into 100 sec bins |
 |
 |
| Module-wise count rates for Quadrant D Data is divided into 100 sec bins |
 |
 |
| Parameter | Plot |
|---|---|
| CZT HV Monitor | 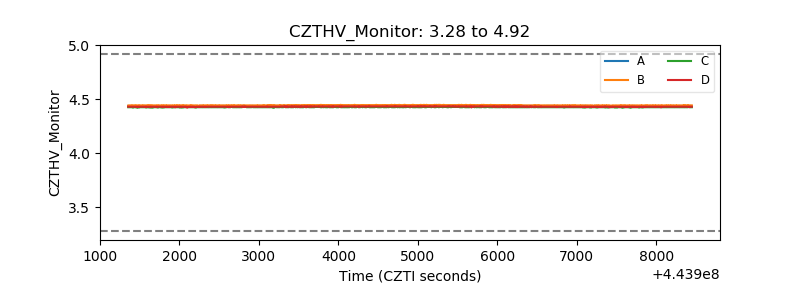 |
| D_VDD | 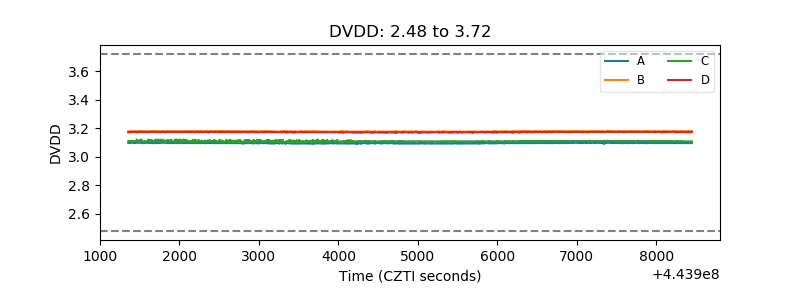 |
| Temperature 1 | 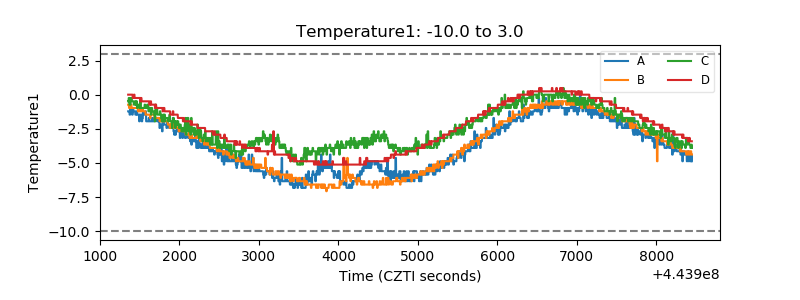 |
| Veto HV Monitor | 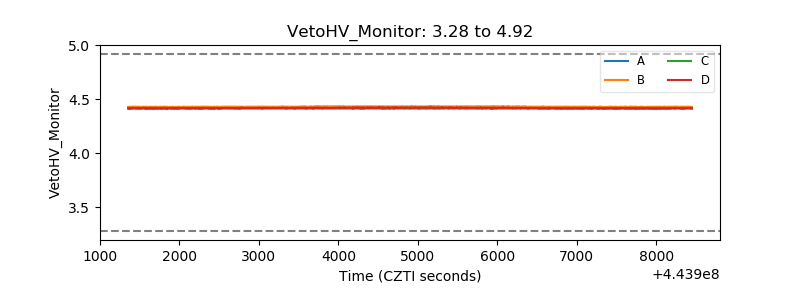 |
| Veto LLD | 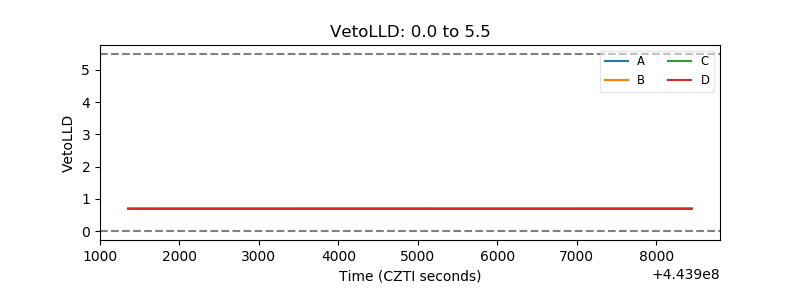 |
| Alpha Counter | 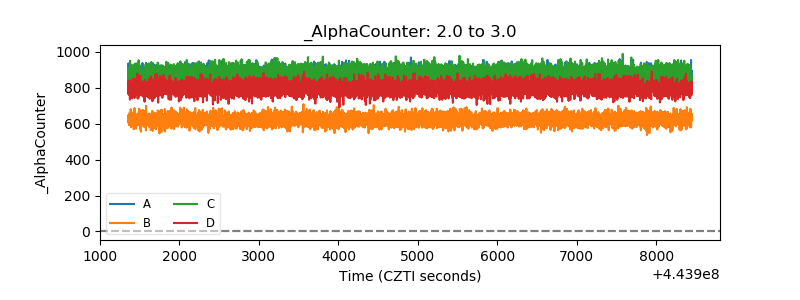 |
| _CPM_Rate | 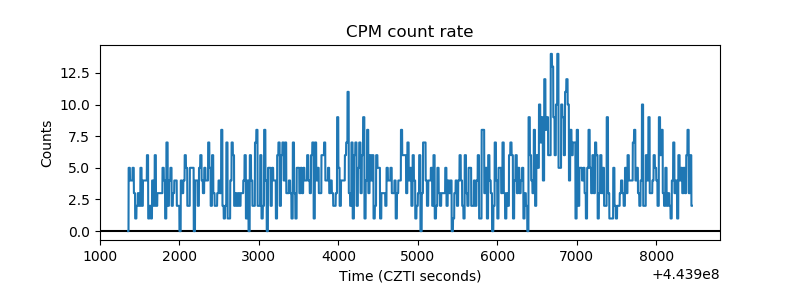 |
| CZT Counter |  |
| +2.5 Volts monitor | 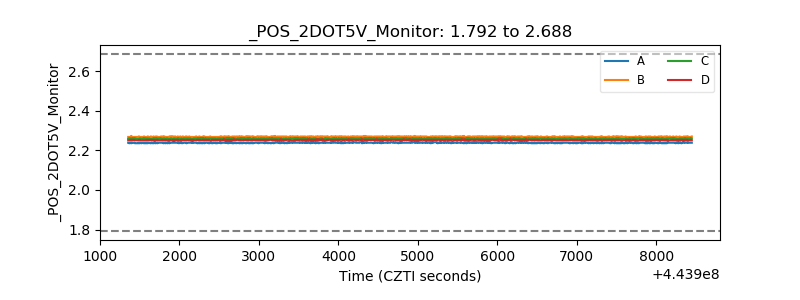 |
| +5 Volts monitor | 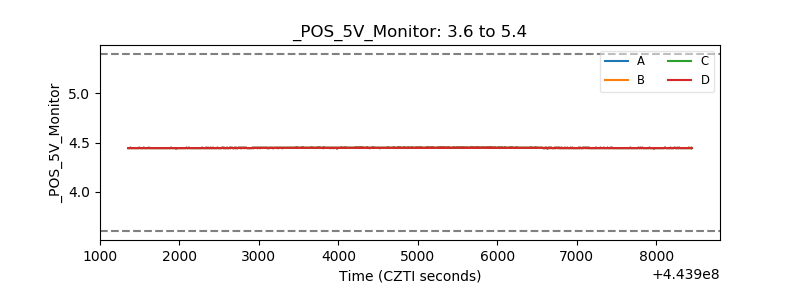 |
| _ROLL_ROT | 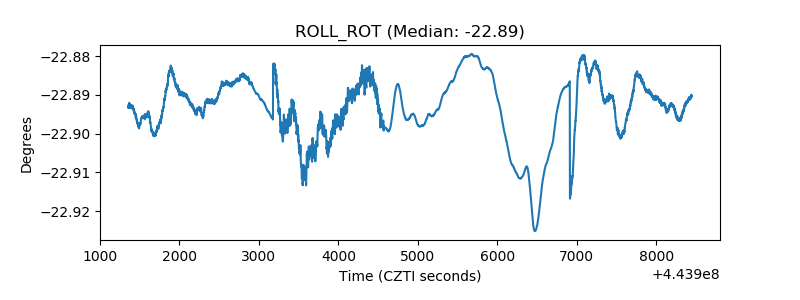 |
| _Roll_DEC | 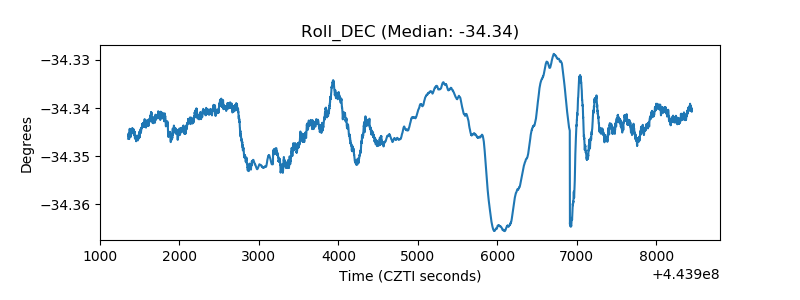 |
| _Roll_RA | 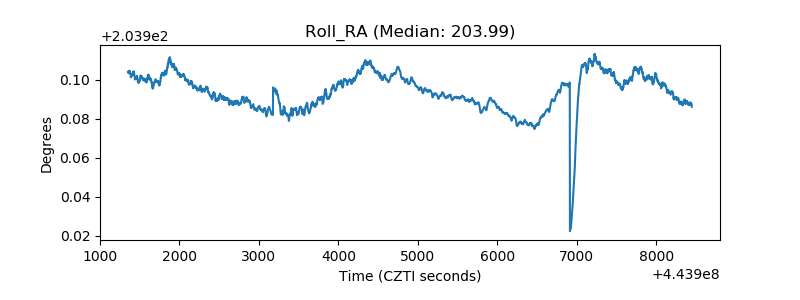 |
| Veto Counter | 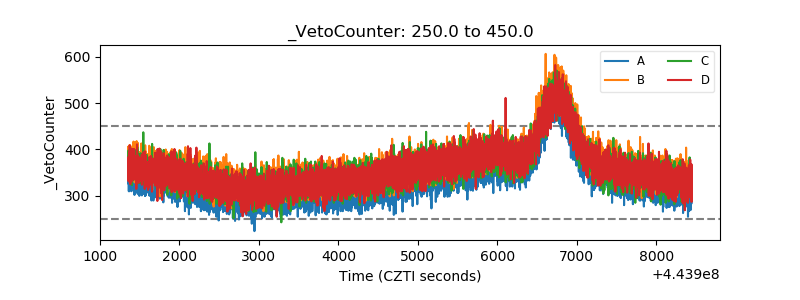 |