| Param | Original file | Final file |
|---|---|---|
| Filename | modeM0/AS1A13_020T01_9000006040_45030cztM0_level2.fits | modeM0/AS1A13_020T01_9000006040_45030cztM0_level2_quad_clean.evt |
| Size (bytes) | 751,426,560 | 113,333,760 |
| Size | 716.6 MB | 108.1 MB |
| Events in quadrant A | 5,998,085 | 804,464 |
| Events in quadrant B | 4,795,485 | 801,127 |
| Events in quadrant C | 4,372,183 | 767,198 |
| Events in quadrant D | 12,066,465 | 533,611 |
| Mode SS | |||
|---|---|---|---|
| Quadrant | BADHDUFLAG | Total packets | Discarded packets |
| A | 0 | 152 | 0 |
| B | 0 | 152 | 0 |
| C | 0 | 152 | 0 |
| D | 0 | 152 | 0 |
| Mode M0 | |||
|---|---|---|---|
| Quadrant | BADHDUFLAG | Total packets | Discarded packets |
| A | 0 | 23363 | 1 |
| B | 0 | 19402 | 0 |
| C | 0 | 18527 | 0 |
| D | 0 | 41096 | 0 |
| Quadrant | Total seconds | Saturated seconds | Saturation percentage |
|---|---|---|---|
| A | 7539 | 99 | 1.313172% |
| B | 7540 | 358 | 4.748011% |
| C | 7540 | 380 | 5.039788% |
| D | 7540 | 2423 | 32.135279% |
Noise dominated data is calculated using 1-second bins in cleaned event files. If a bin has >2000 counts, and if more than 50% of those come from <1% of pixels, then it is considered to be noise-dominated and hence unusable.
| Quadrant | # 1 sec bins | Bins with >0 counts | Bins with >2000 counts | High rate bins dominated by noise | Noise dominated (total time) | Noise dominated (detector-on time) | Marked lightcurve |
|---|---|---|---|---|---|---|---|
| A | 7539 | 7539 | 10 | 10 | 0.13% | 0.13% | 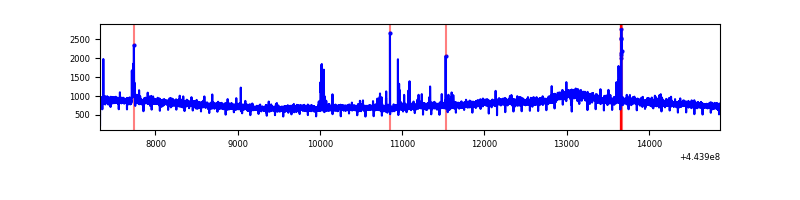 |
| B | 7540 | 7540 | 194 | 194 | 2.57% | 2.57% | 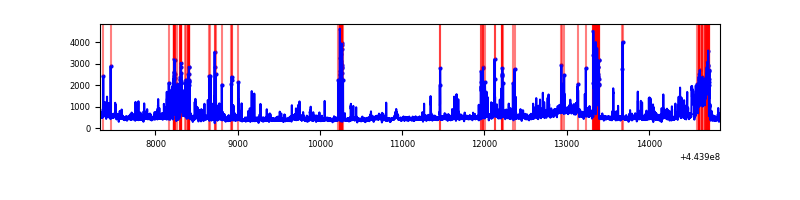 |
| C | 7540 | 7540 | 208 | 208 | 2.76% | 2.76% | 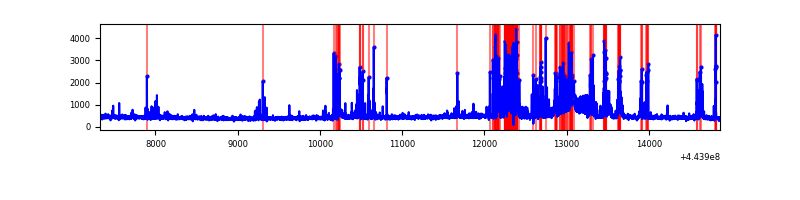 |
| D | 7540 | 7540 | 2195 | 2195 | 29.11% | 29.11% | 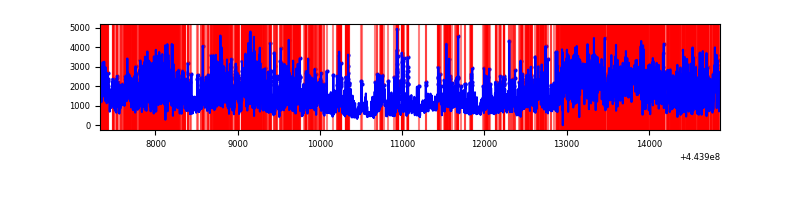 |
Top three noisy pixels from each quadrant. If the there are fewer than three noisy pixels in the level2.evt file, extra rows are filled as -1
| Pixel properties | Quadrant properties | ||||||
|---|---|---|---|---|---|---|---|
| Quadrant | DetID | PixID | Counts | Sigma | Mean | Median | Sigma |
| A | 10 | 83 | 2633356 | 14774.38 | 847 | 830 | 178.2 |
| A | 0 | 243 | 48755 | 268.97 | 847 | 830 | 178.2 |
| A | 13 | 248 | 42923 | 236.24 | 847 | 830 | 178.2 |
| B | 0 | 189 | 511517 | 3085.74 | 835 | 809 | 165.5 |
| B | 5 | 255 | 340976 | 2055.32 | 835 | 809 | 165.5 |
| B | 4 | 171 | 275400 | 1659.1 | 835 | 809 | 165.5 |
| C | 14 | 254 | 1080892 | 5627.85 | 813 | 819 | 191.9 |
| C | 12 | 2 | 37262 | 189.89 | 813 | 819 | 191.9 |
| C | 2 | 14 | 26719 | 134.96 | 813 | 819 | 191.9 |
| D | 13 | 174 | 4209342 | 22894.31 | 717 | 695 | 183.8 |
| D | 5 | 235 | 1567192 | 8521.47 | 717 | 695 | 183.8 |
| D | 1 | 52 | 1128398 | 6134.51 | 717 | 695 | 183.8 |
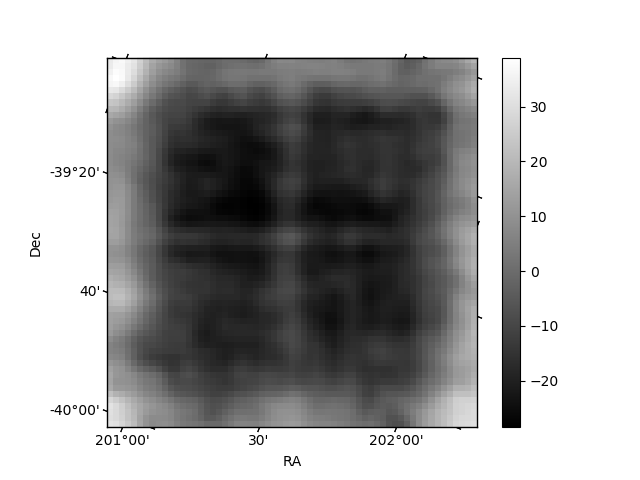
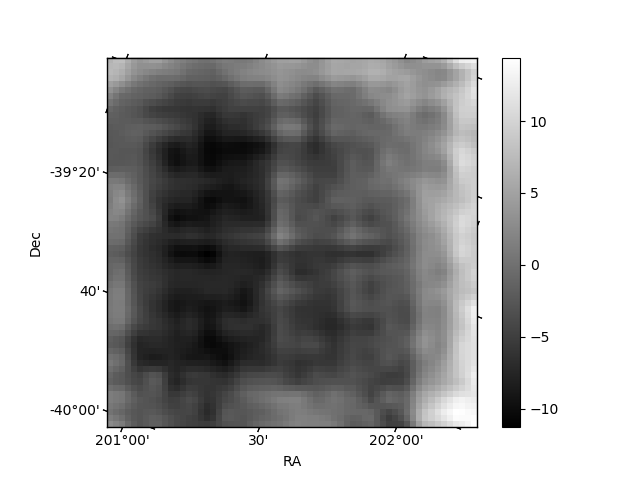
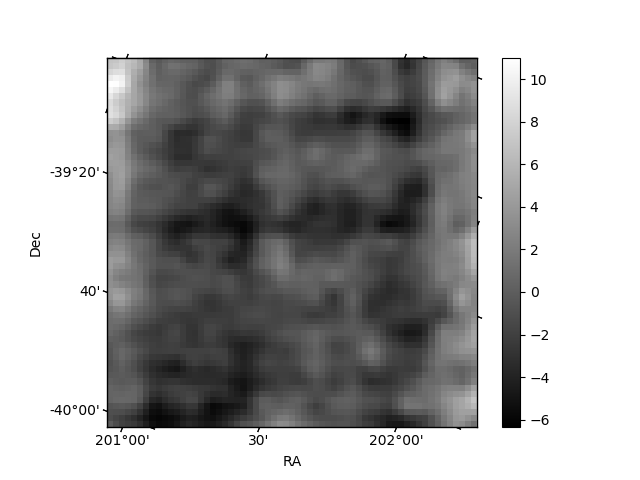
Histogram calculated using DETX and DETY for each event in the final _common_clean file
| Quadrant A | 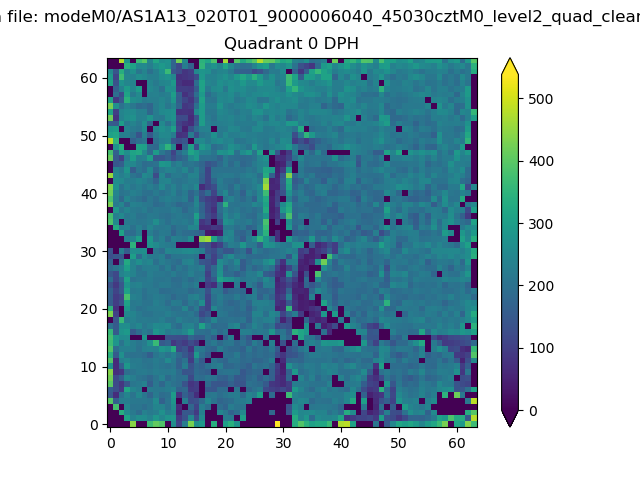 |
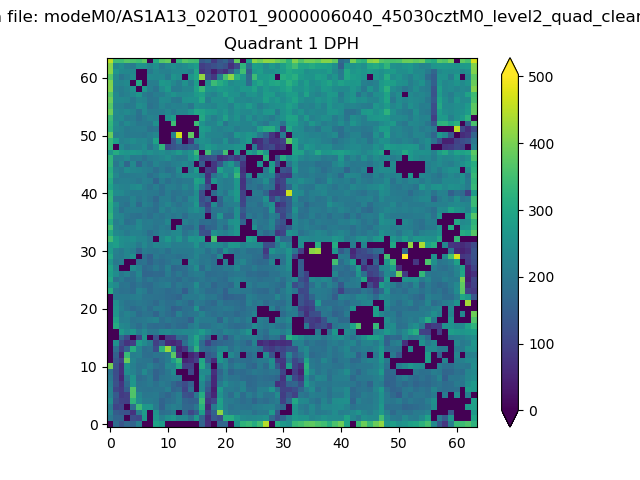 |
Quadrant B |
|---|---|---|---|
| Quadrant D | 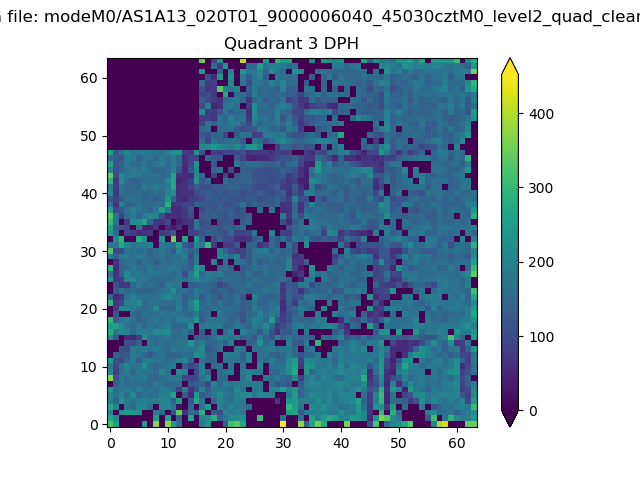 |
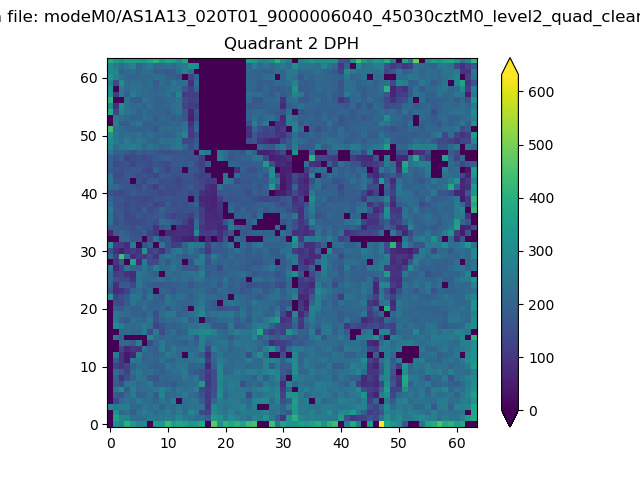 |
Quadrant C |
| Plot type | Count rate plots | Images |
|---|---|---|
| Comparison with Poisson distribution Blue bars denote a histogram of data divided into 1 sec bins. Red curve is a Poisson curve with rate = median count rate of data. |
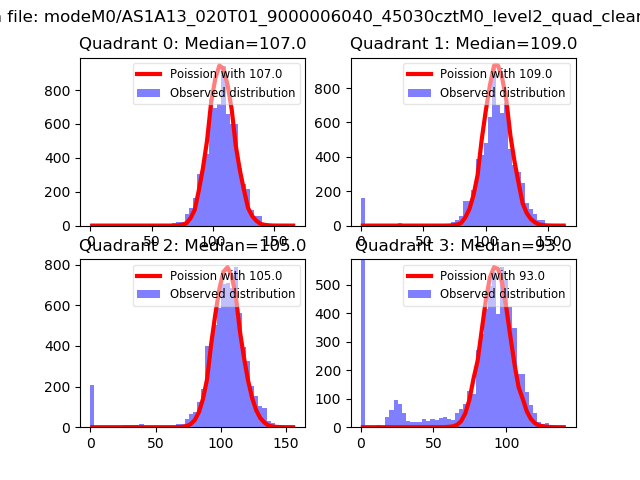 |
 |
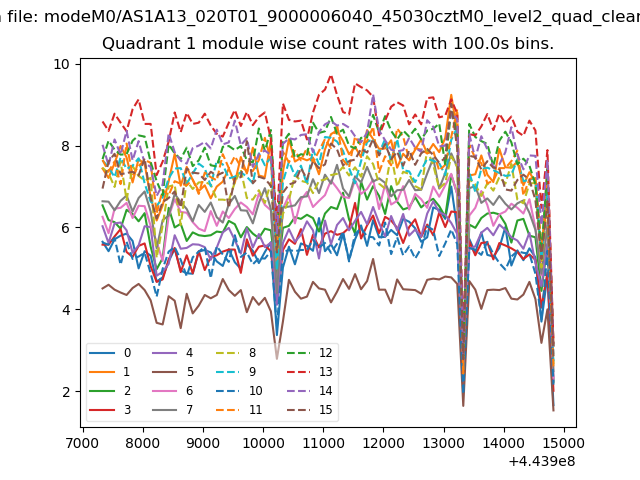
| Quadrant-wise count rates Data is divided into 100 sec bins |
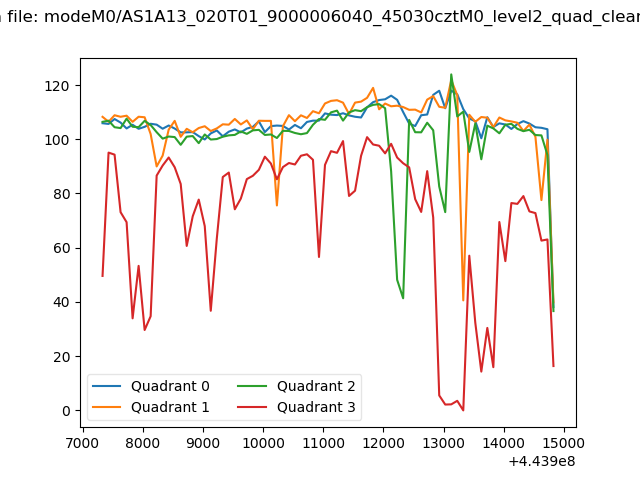 |
|
| Module-wise count rates for Quadrant A Data is divided into 100 sec bins |
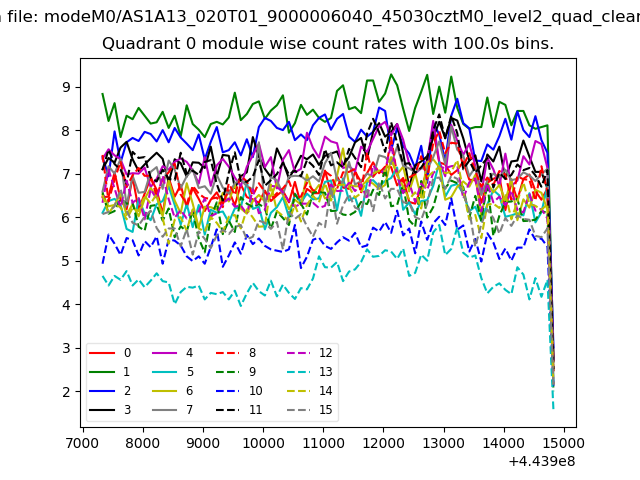 |
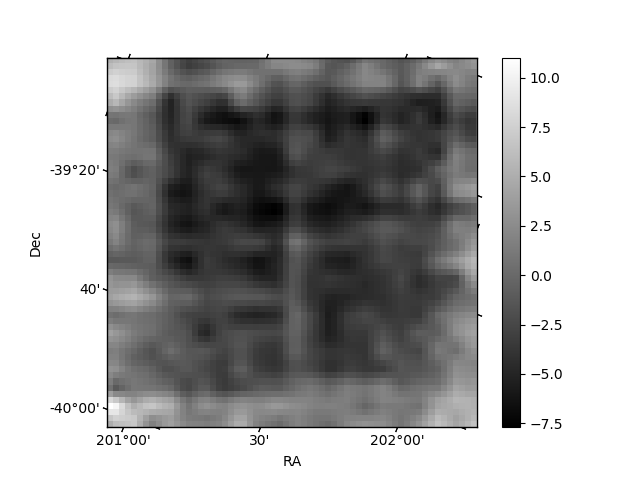 |
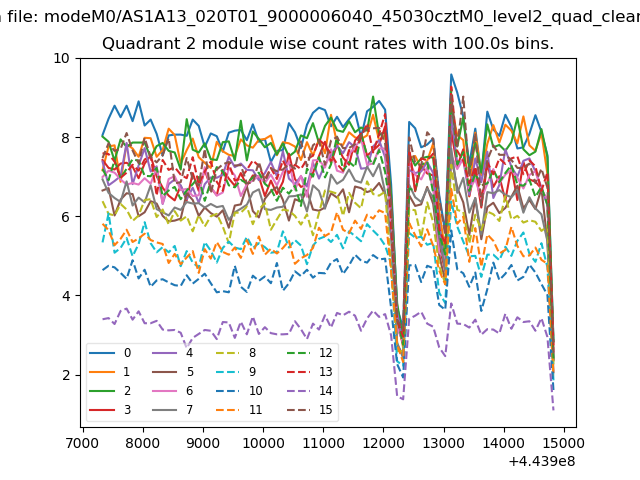
| Module-wise count rates for Quadrant B Data is divided into 100 sec bins |
 |
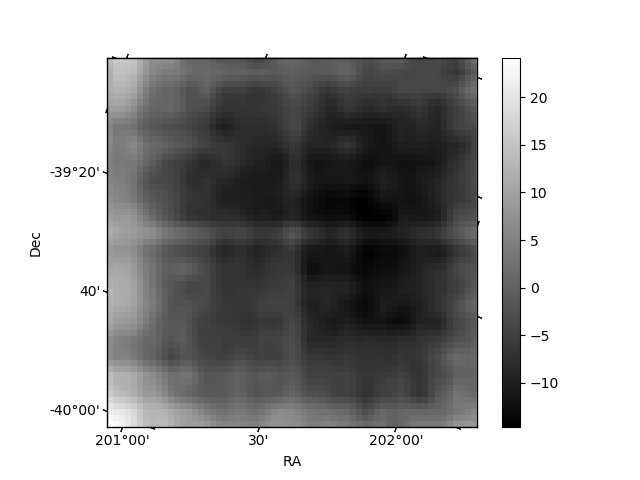 |
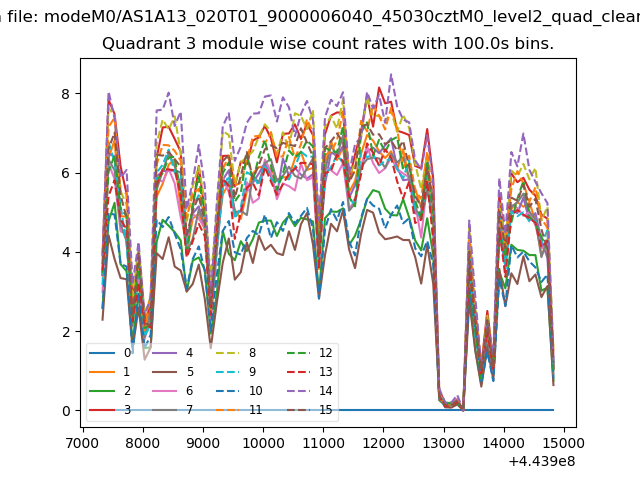
| Module-wise count rates for Quadrant C Data is divided into 100 sec bins |
 |
 |
| Module-wise count rates for Quadrant D Data is divided into 100 sec bins |
 |
 |
| Parameter | Plot |
|---|---|
| CZT HV Monitor | 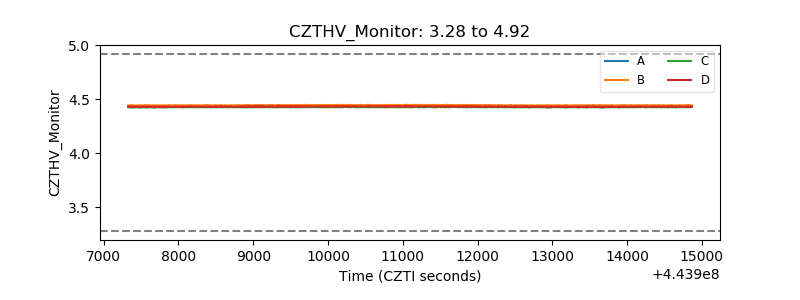 |
| D_VDD | 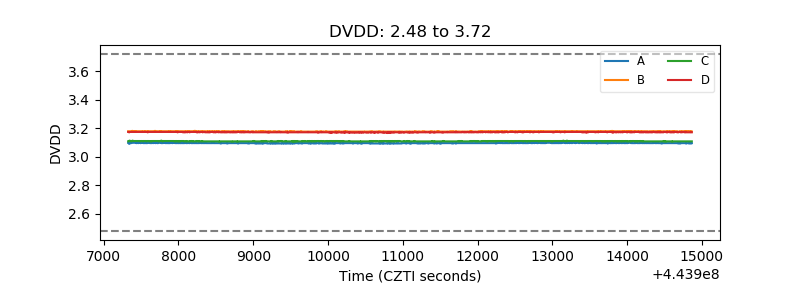 |
| Temperature 1 | 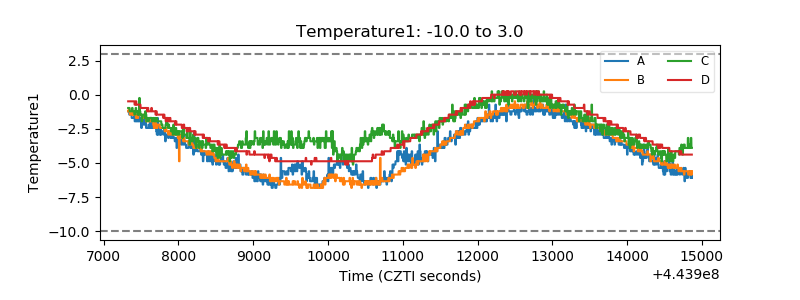 |
| Veto HV Monitor | 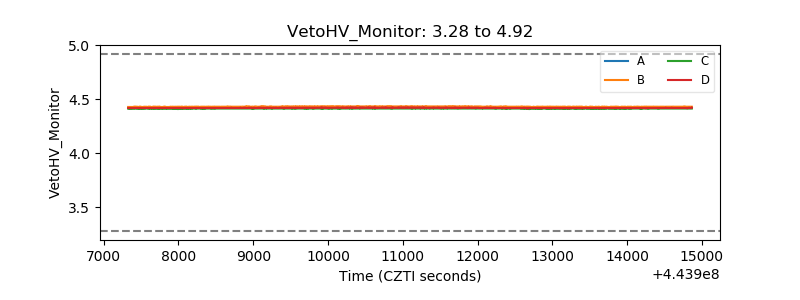 |
| Veto LLD | 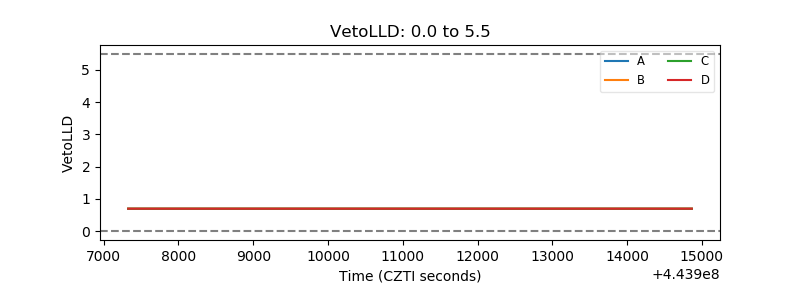 |
| Alpha Counter | 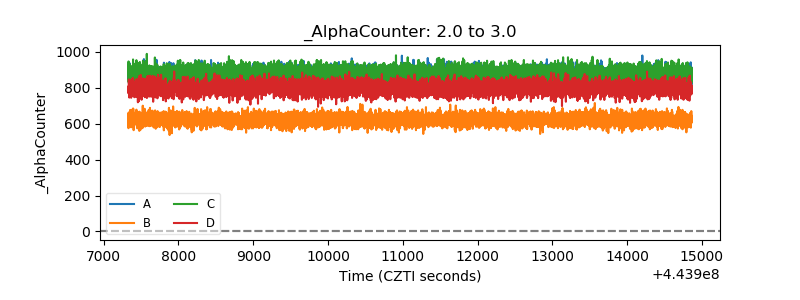 |
| _CPM_Rate | 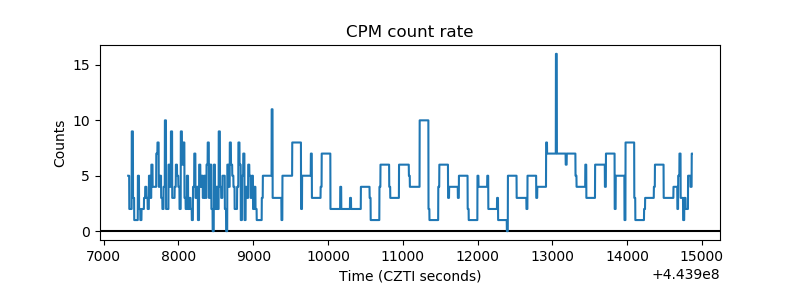 |
| CZT Counter |  |
| +2.5 Volts monitor | 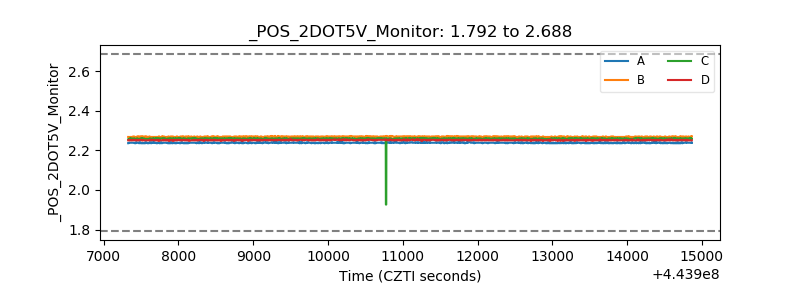 |
| +5 Volts monitor | 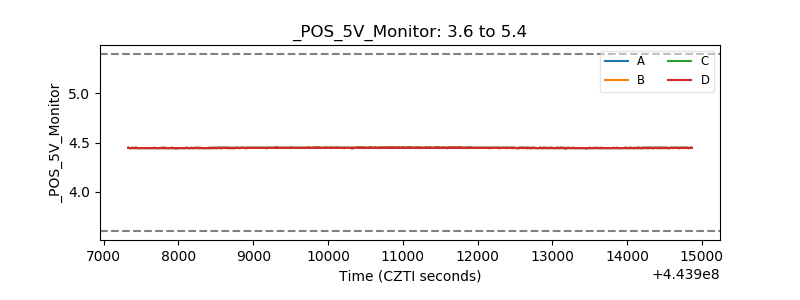 |
| _ROLL_ROT | 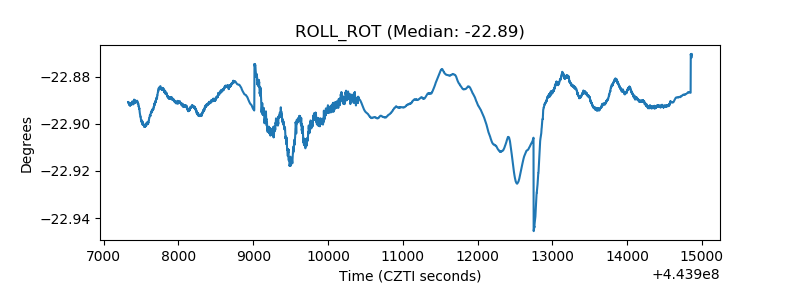 |
| _Roll_DEC | 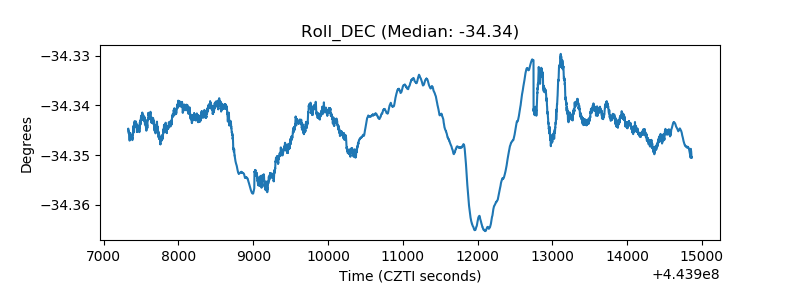 |
| _Roll_RA | 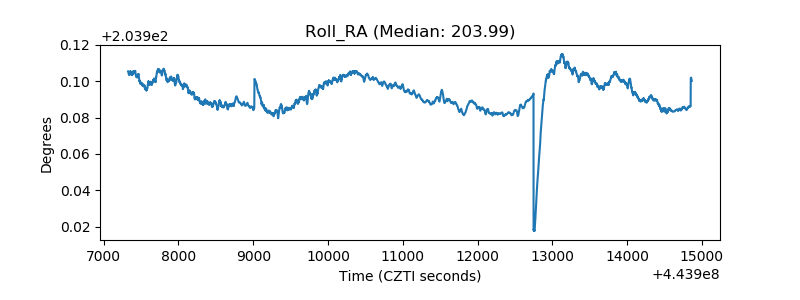 |
| Veto Counter | 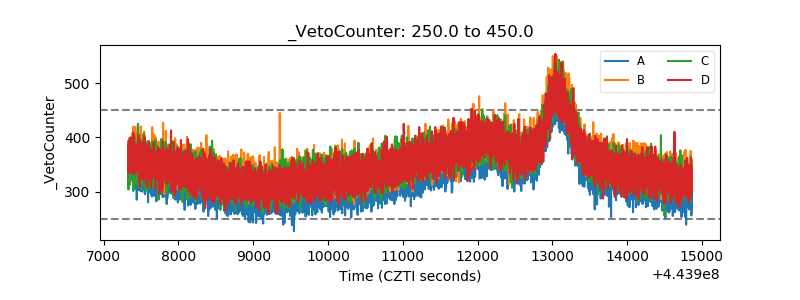 |