| Param | Original file | Final file |
|---|---|---|
| Filename | modeM0/AS1A13_020T01_9000006040_45034cztM0_level2.fits | modeM0/AS1A13_020T01_9000006040_45034cztM0_level2_quad_clean.evt |
| Size (bytes) | 1,847,243,520 | 332,933,760 |
| Size | 1.7 GB | 317.5 MB |
| Events in quadrant A | 16,940,864 | 2,310,590 |
| Events in quadrant B | 12,820,138 | 2,329,260 |
| Events in quadrant C | 10,804,682 | 2,290,509 |
| Events in quadrant D | 26,115,846 | 1,634,301 |
| Mode SS | |||
|---|---|---|---|
| Quadrant | BADHDUFLAG | Total packets | Discarded packets |
| A | 0 | 446 | 0 |
| B | 0 | 446 | 0 |
| C | 0 | 446 | 0 |
| D | 0 | 446 | 0 |
| Mode M9 | |||
|---|---|---|---|
| Quadrant | BADHDUFLAG | Total packets | Discarded packets |
| A | 0 | 11 | 0 |
| B | 0 | 11 | 0 |
| C | 0 | 11 | 0 |
| D | 0 | 11 | 0 |
| Mode M0 | |||
|---|---|---|---|
| Quadrant | BADHDUFLAG | Total packets | Discarded packets |
| A | 0 | 67610 | 4 |
| B | 0 | 53312 | 4 |
| C | 0 | 48235 | 6 |
| D | 0 | 92843 | 4 |
| Quadrant | Total seconds | Saturated seconds | Saturation percentage |
|---|---|---|---|
| A | 21998 | 390 | 1.772888% |
| B | 21998 | 903 | 4.104919% |
| C | 21998 | 359 | 1.631967% |
| D | 21998 | 4388 | 19.947268% |
Noise dominated data is calculated using 1-second bins in cleaned event files. If a bin has >2000 counts, and if more than 50% of those come from <1% of pixels, then it is considered to be noise-dominated and hence unusable.
| Quadrant | # 1 sec bins | Bins with >0 counts | Bins with >2000 counts | High rate bins dominated by noise | Noise dominated (total time) | Noise dominated (detector-on time) | Marked lightcurve |
|---|---|---|---|---|---|---|---|
| A | 23168 | 22003 | 14 | 14 | 0.06% | 0.06% | 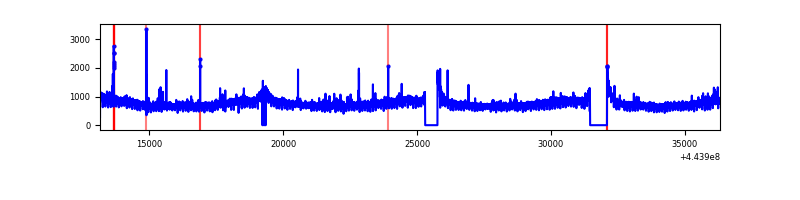 |
| B | 23168 | 22003 | 371 | 371 | 1.60% | 1.69% | 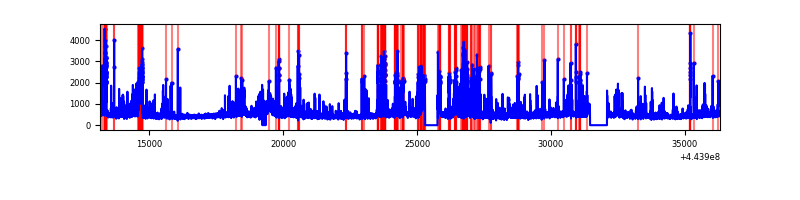 |
| C | 23168 | 22003 | 231 | 231 | 1.00% | 1.05% | 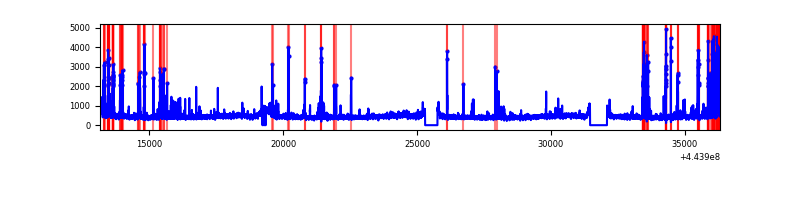 |
| D | 23168 | 22002 | 3568 | 3568 | 15.40% | 16.22% | 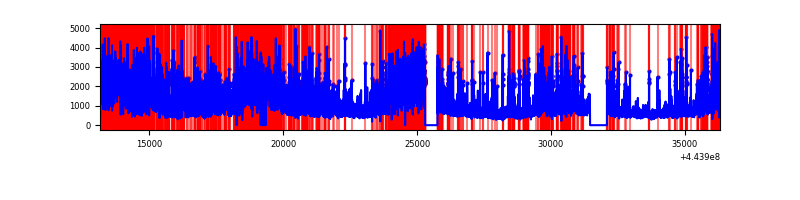 |
Top three noisy pixels from each quadrant. If the there are fewer than three noisy pixels in the level2.evt file, extra rows are filled as -1
| Pixel properties | Quadrant properties | ||||||
|---|---|---|---|---|---|---|---|
| Quadrant | DetID | PixID | Counts | Sigma | Mean | Median | Sigma |
| A | 10 | 83 | 7352682 | 14532.09 | 2442 | 2385 | 505.8 |
| A | 13 | 248 | 94222 | 181.57 | 2442 | 2385 | 505.8 |
| A | 0 | 243 | 37735 | 69.89 | 2442 | 2385 | 505.8 |
| B | 0 | 189 | 1402074 | 2961.96 | 2415 | 2340 | 472.6 |
| B | 12 | 48 | 597627 | 1259.68 | 2415 | 2340 | 472.6 |
| B | 5 | 255 | 389582 | 819.44 | 2415 | 2340 | 472.6 |
| C | 14 | 254 | 1178399 | 2079.34 | 2407 | 2420 | 565.6 |
| C | 2 | 14 | 95182 | 164.02 | 2407 | 2420 | 565.6 |
| C | 1 | 3 | 51550 | 86.87 | 2407 | 2420 | 565.6 |
| D | 13 | 174 | 5600981 | 10154.93 | 2187 | 2123 | 551.3 |
| D | 4 | 221 | 2813565 | 5099.25 | 2187 | 2123 | 551.3 |
| D | 5 | 235 | 2288820 | 4147.5 | 2187 | 2123 | 551.3 |
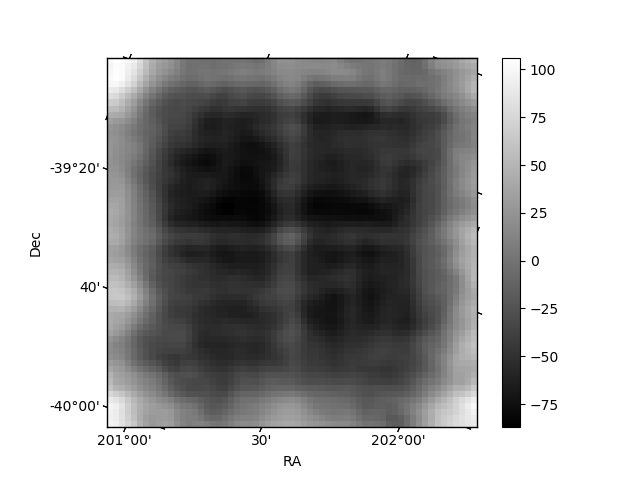
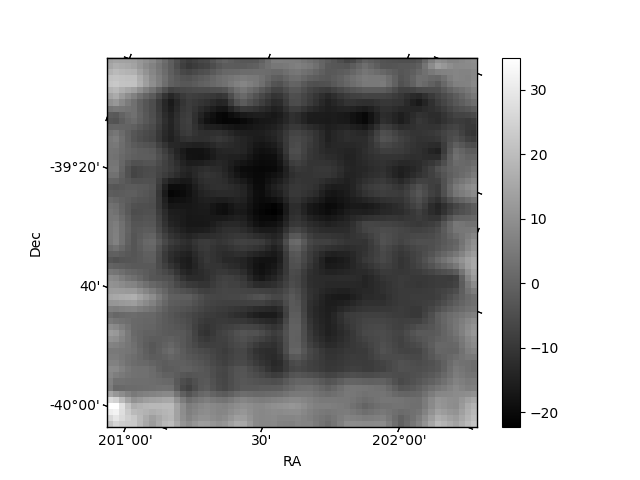
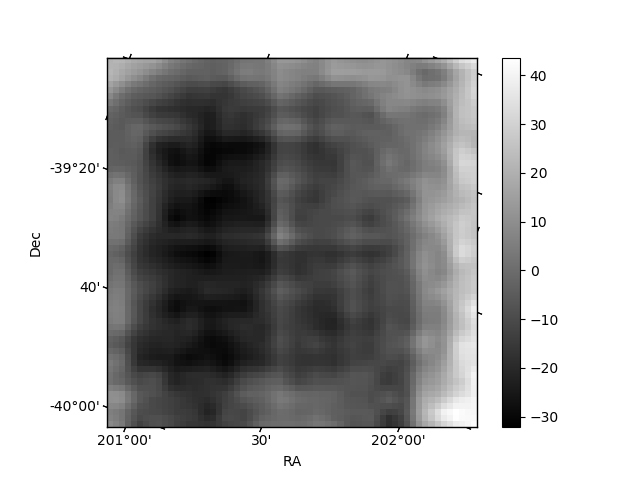
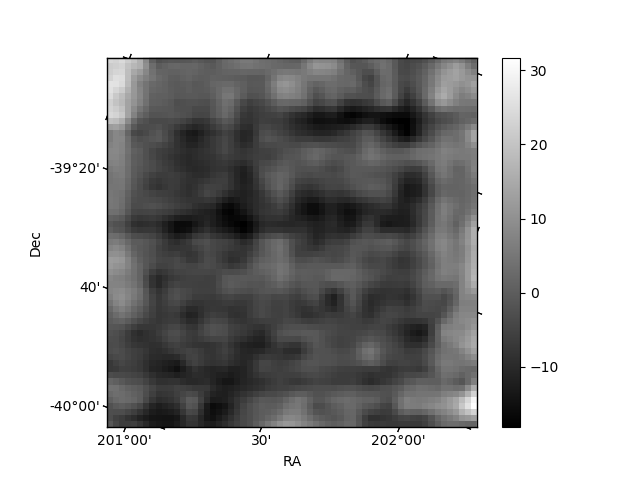
Histogram calculated using DETX and DETY for each event in the final _common_clean file
| Quadrant A | 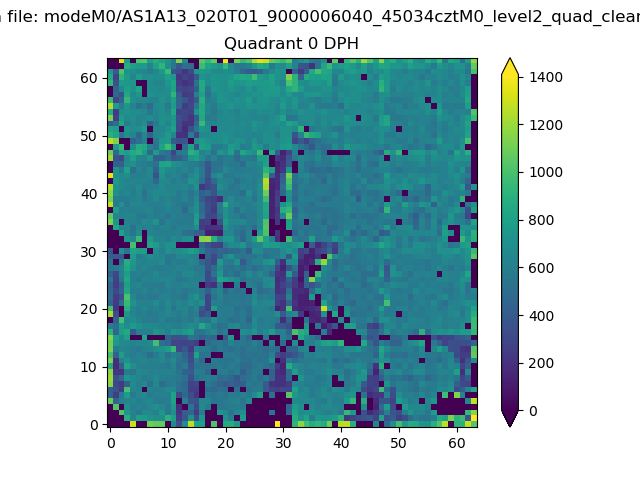 |
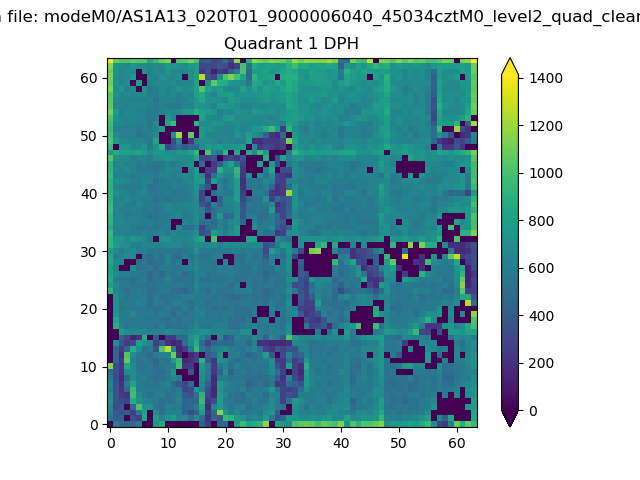 |
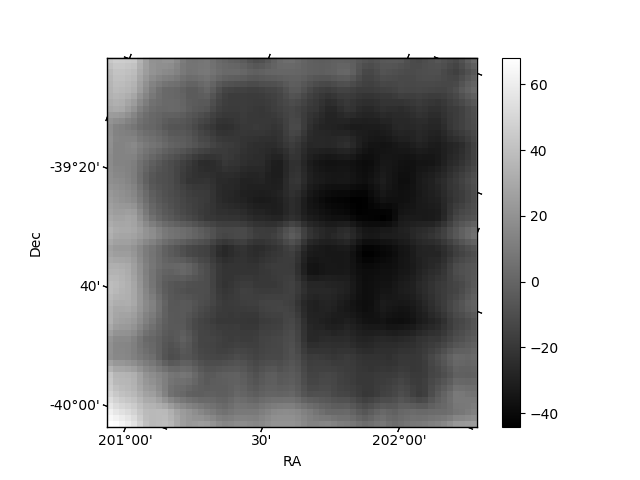
Quadrant B |
|---|---|---|---|
| Quadrant D | 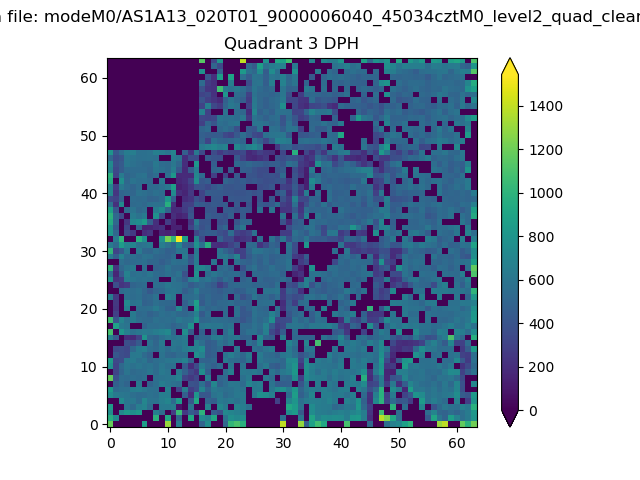 |
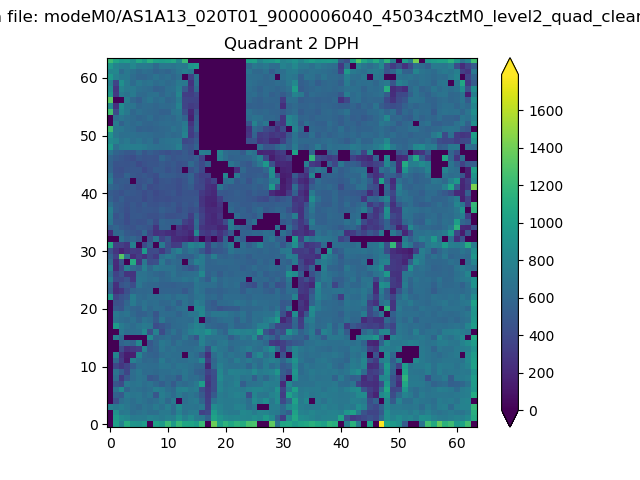 |
Quadrant C |
| Plot type | Count rate plots | Images |
|---|---|---|
| Comparison with Poisson distribution Blue bars denote a histogram of data divided into 1 sec bins. Red curve is a Poisson curve with rate = median count rate of data. |
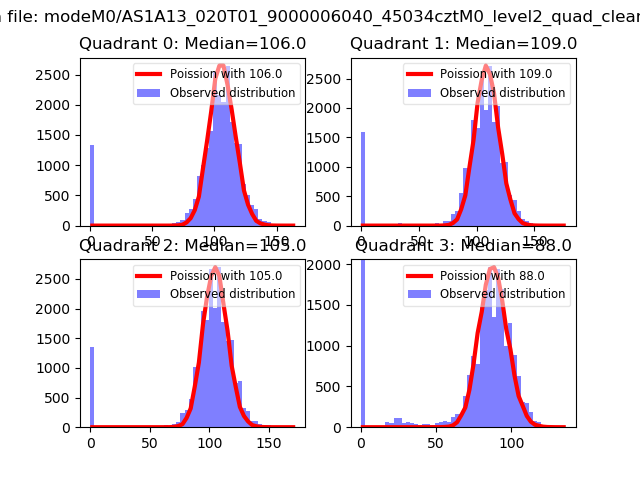 |
 |
| Quadrant-wise count rates Data is divided into 100 sec bins |
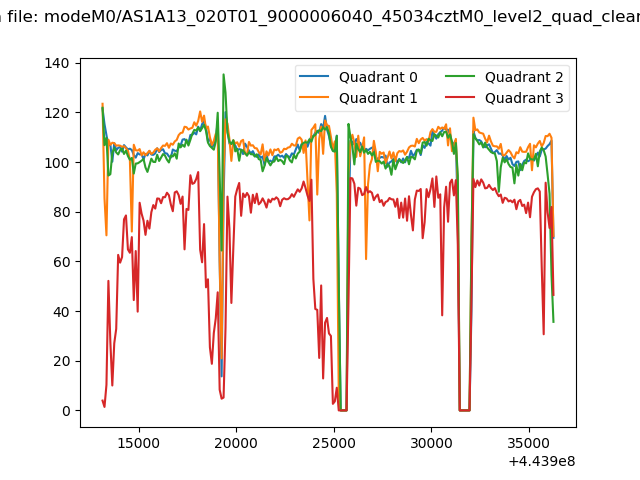 |
|
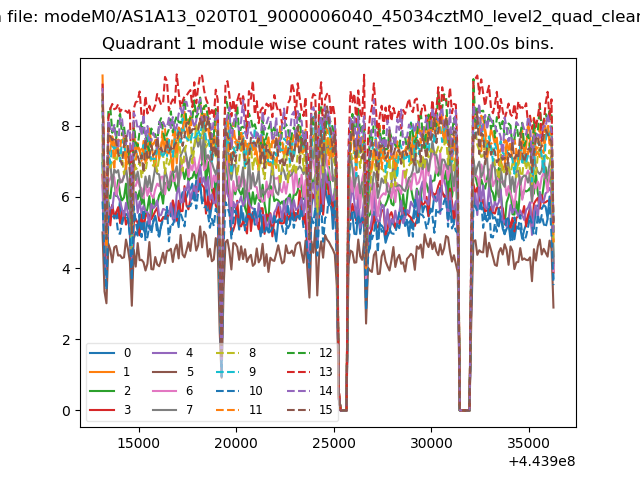
| Module-wise count rates for Quadrant A Data is divided into 100 sec bins |
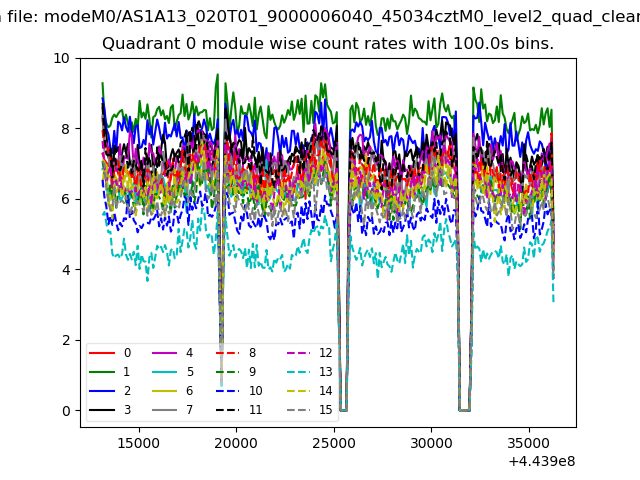 |
 |
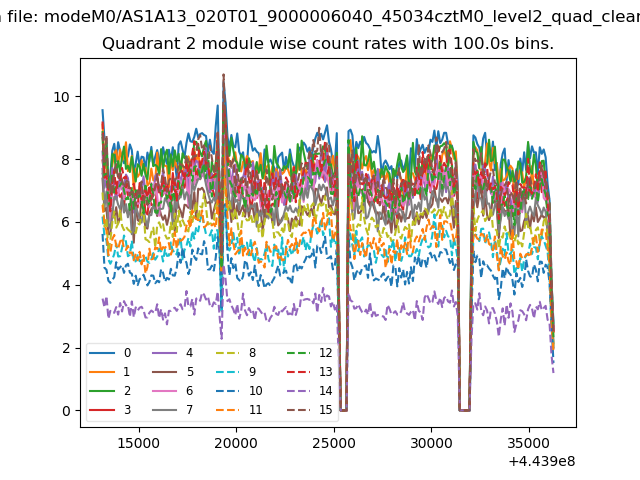
| Module-wise count rates for Quadrant B Data is divided into 100 sec bins |
 |
 |
| Module-wise count rates for Quadrant C Data is divided into 100 sec bins |
 |
 |
| Module-wise count rates for Quadrant D Data is divided into 100 sec bins |
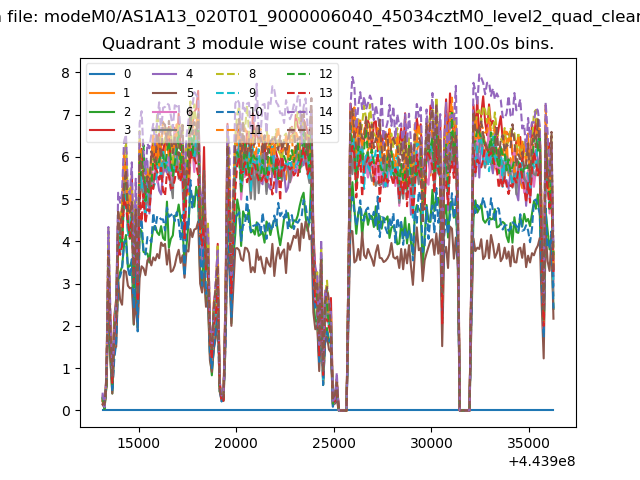 |
 |
| Parameter | Plot |
|---|---|
| CZT HV Monitor | 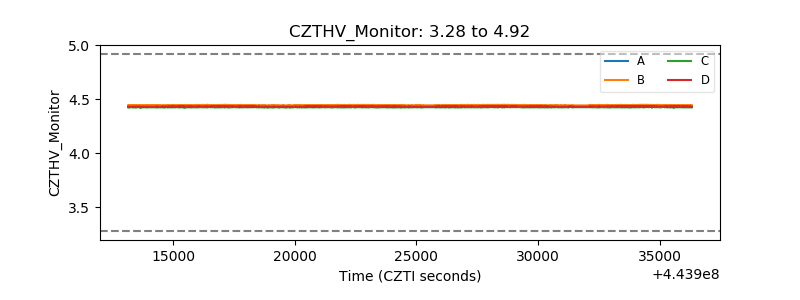 |
| D_VDD | 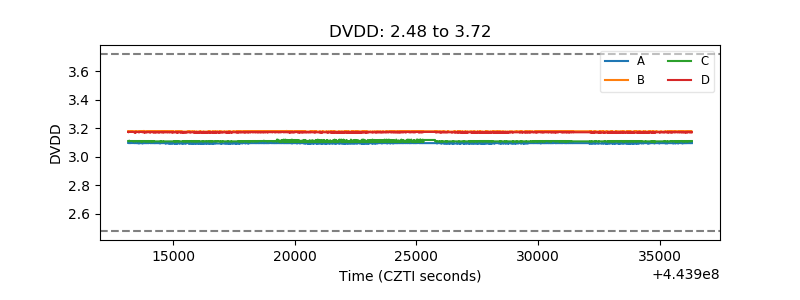 |
| Temperature 1 | 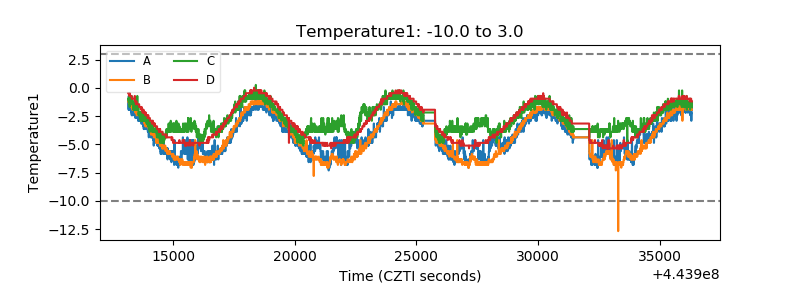 |
| Veto HV Monitor |  |
| Veto LLD | 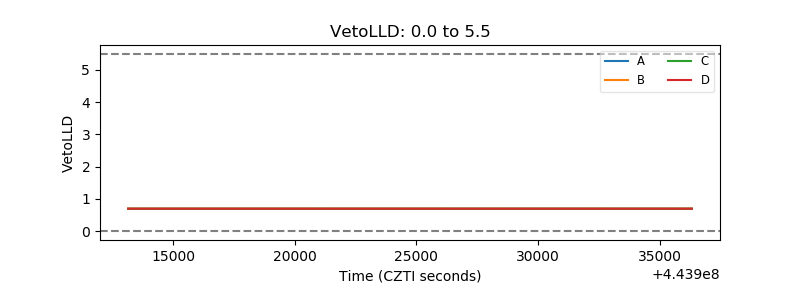 |
| Alpha Counter | 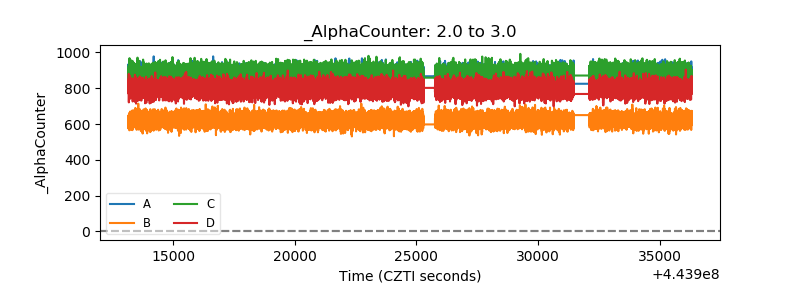 |
| _CPM_Rate | 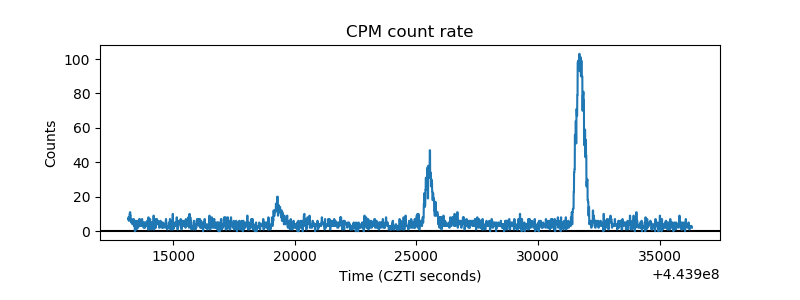 |
| CZT Counter | 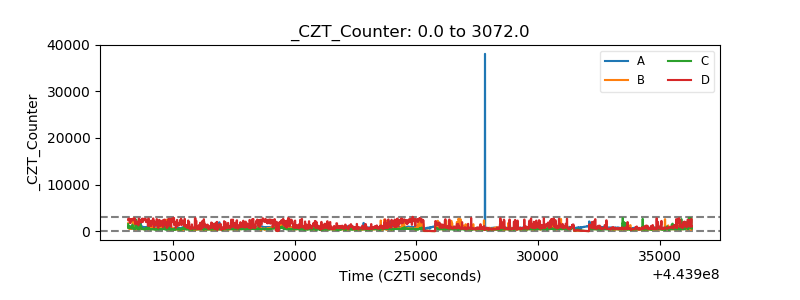 |
| +2.5 Volts monitor | 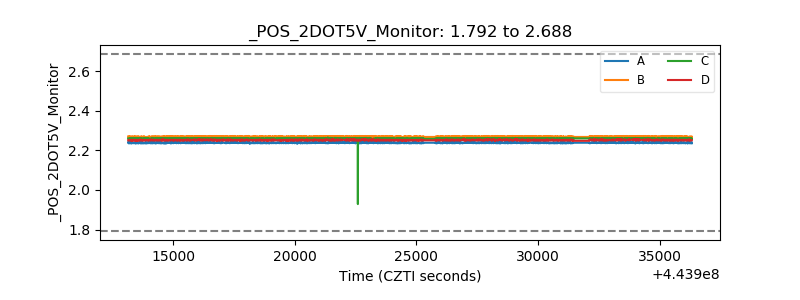 |
| +5 Volts monitor | 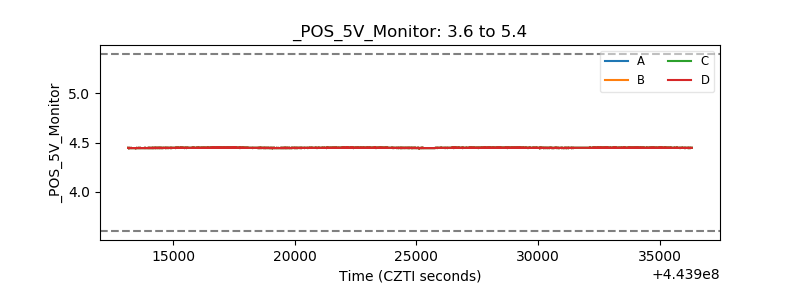 |
| _ROLL_ROT | 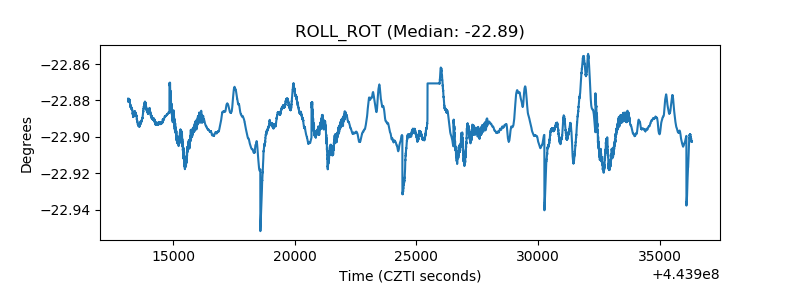 |
| _Roll_DEC | 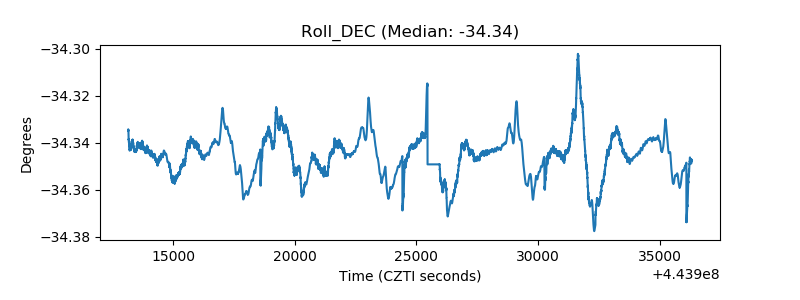 |
| _Roll_RA | 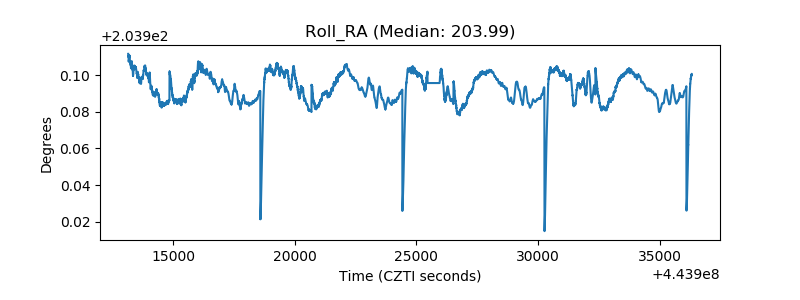 |
| Veto Counter | 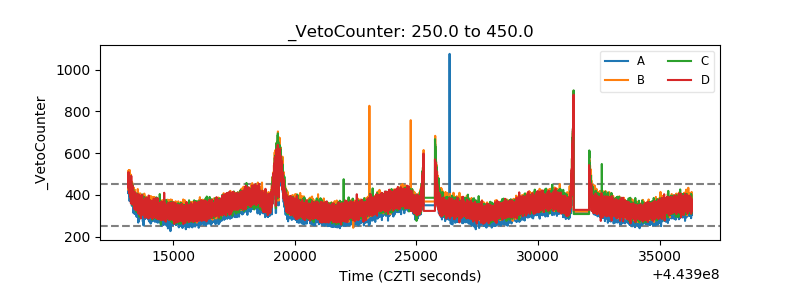 |