| Param | Original file | Final file |
|---|---|---|
| Filename | modeM0/AS1A13_020T01_9000006040_45035cztM0_level2.fits | modeM0/AS1A13_020T01_9000006040_45035cztM0_level2_quad_clean.evt |
| Size (bytes) | 681,759,360 | 133,185,600 |
| Size | 650.2 MB | 127.0 MB |
| Events in quadrant A | 6,830,185 | 894,167 |
| Events in quadrant B | 5,079,102 | 909,792 |
| Events in quadrant C | 4,447,560 | 882,088 |
| Events in quadrant D | 8,232,630 | 764,992 |
| Mode SS | |||
|---|---|---|---|
| Quadrant | BADHDUFLAG | Total packets | Discarded packets |
| A | 0 | 174 | 0 |
| B | 0 | 174 | 0 |
| C | 0 | 174 | 0 |
| D | 0 | 172 | 0 |
| Mode M9 | |||
|---|---|---|---|
| Quadrant | BADHDUFLAG | Total packets | Discarded packets |
| A | 0 | 17 | 0 |
| B | 0 | 17 | 0 |
| C | 0 | 17 | 0 |
| D | 0 | 17 | 0 |
| Mode M0 | |||
|---|---|---|---|
| Quadrant | BADHDUFLAG | Total packets | Discarded packets |
| A | 0 | 26257 | 2 |
| B | 0 | 20520 | 2 |
| C | 0 | 19121 | 2 |
| D | 0 | 30270 | 2 |
| Quadrant | Total seconds | Saturated seconds | Saturation percentage |
|---|---|---|---|
| A | 8361 | 202 | 2.415979% |
| B | 8362 | 357 | 4.269314% |
| C | 8362 | 262 | 3.133222% |
| D | 8361 | 852 | 10.190169% |
Noise dominated data is calculated using 1-second bins in cleaned event files. If a bin has >2000 counts, and if more than 50% of those come from <1% of pixels, then it is considered to be noise-dominated and hence unusable.
| Quadrant | # 1 sec bins | Bins with >0 counts | Bins with >2000 counts | High rate bins dominated by noise | Noise dominated (total time) | Noise dominated (detector-on time) | Marked lightcurve |
|---|---|---|---|---|---|---|---|
| A | 10100 | 8362 | 4 | 4 | 0.04% | 0.05% | 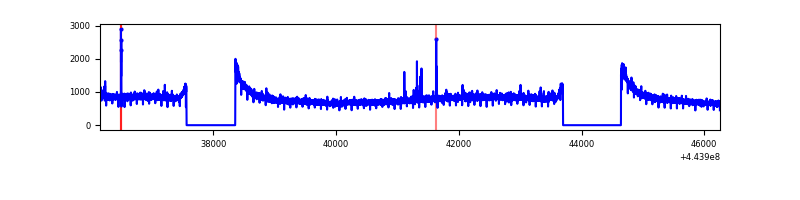 |
| B | 10102 | 8363 | 161 | 161 | 1.59% | 1.93% | 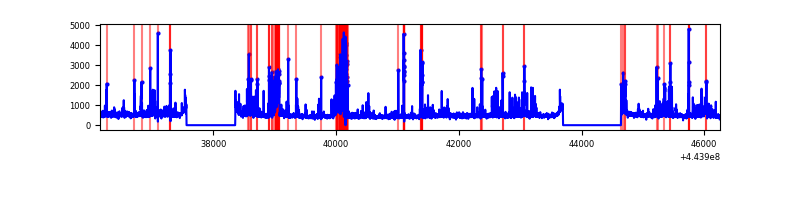 |
| C | 10102 | 8364 | 139 | 139 | 1.38% | 1.66% | 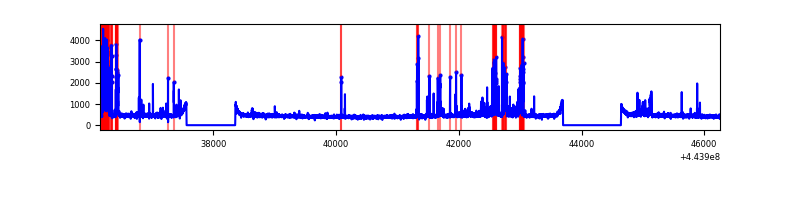 |
| D | 10101 | 8363 | 659 | 659 | 6.52% | 7.88% | 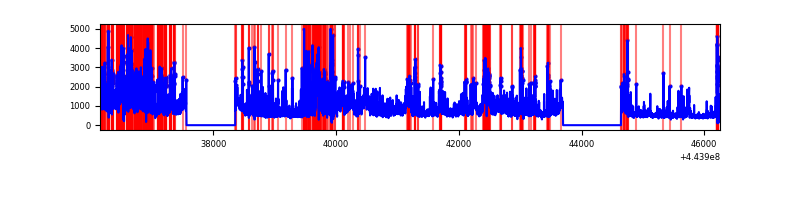 |
Top three noisy pixels from each quadrant. If the there are fewer than three noisy pixels in the level2.evt file, extra rows are filled as -1
| Pixel properties | Quadrant properties | ||||||
|---|---|---|---|---|---|---|---|
| Quadrant | DetID | PixID | Counts | Sigma | Mean | Median | Sigma |
| A | 10 | 83 | 3077660 | 15444.13 | 954 | 931 | 199.2 |
| A | 13 | 248 | 32474 | 158.34 | 954 | 931 | 199.2 |
| A | 0 | 243 | 16893 | 80.12 | 954 | 931 | 199.2 |
| B | 0 | 189 | 500125 | 2678.14 | 947 | 919 | 186.4 |
| B | 12 | 48 | 422289 | 2260.56 | 947 | 919 | 186.4 |
| B | 5 | 255 | 107691 | 572.81 | 947 | 919 | 186.4 |
| C | 14 | 254 | 584754 | 2629.27 | 943 | 951 | 222.0 |
| C | 3 | 233 | 102621 | 457.89 | 943 | 951 | 222.0 |
| C | 15 | 208 | 59098 | 261.88 | 943 | 951 | 222.0 |
| D | 1 | 52 | 937331 | 4058.39 | 914 | 885 | 230.7 |
| D | 13 | 187 | 708752 | 3067.77 | 914 | 885 | 230.7 |
| D | 13 | 174 | 648345 | 2805.98 | 914 | 885 | 230.7 |
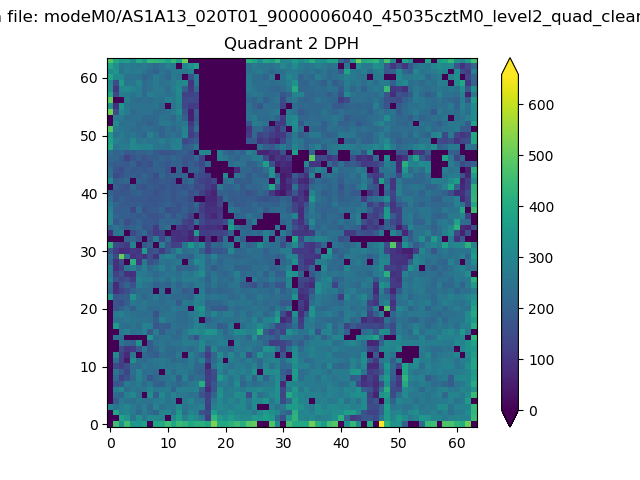
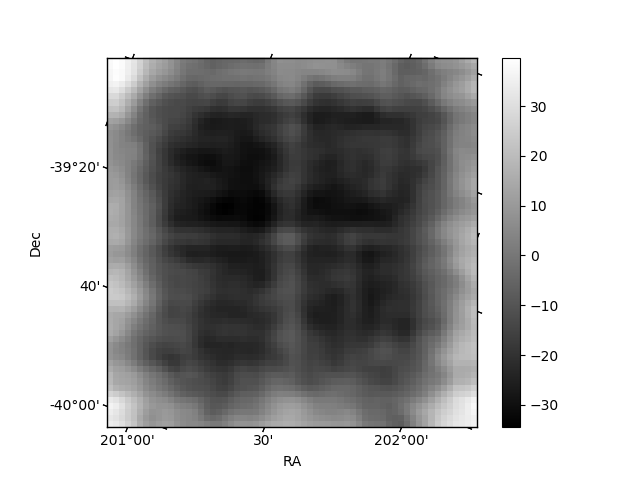
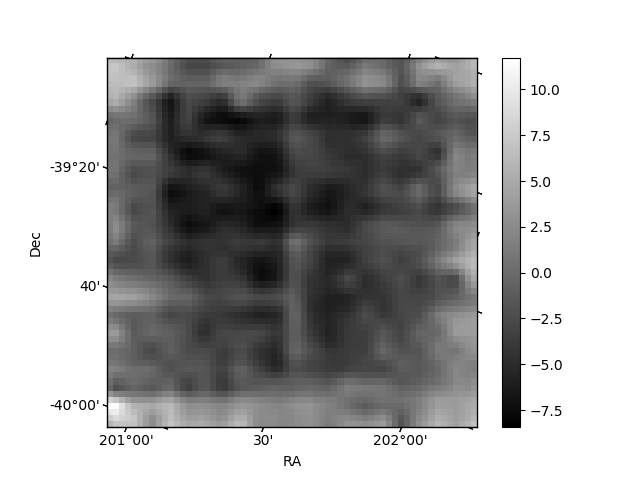
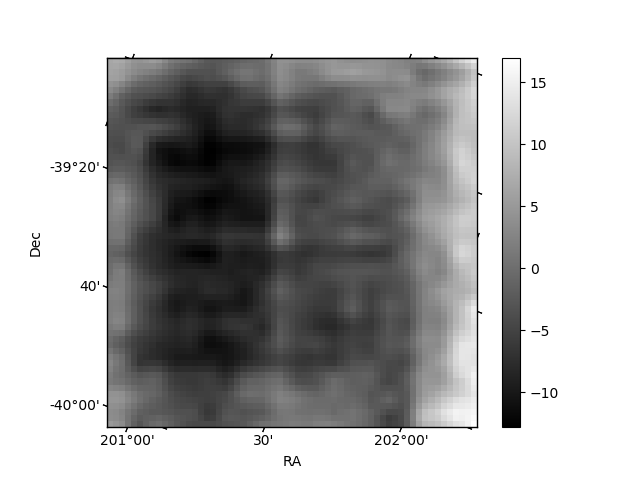
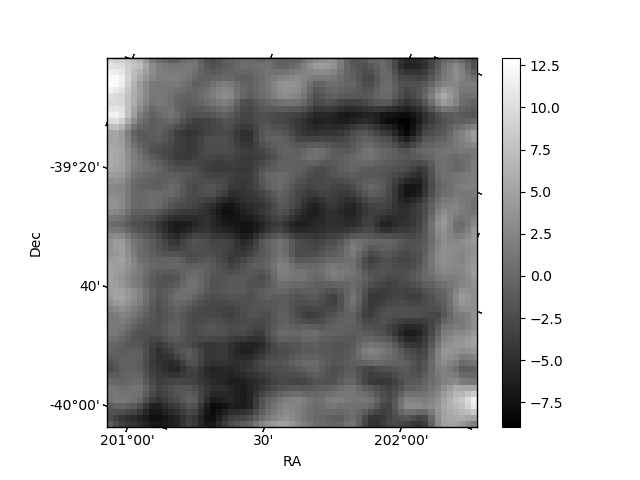
Histogram calculated using DETX and DETY for each event in the final _common_clean file
| Quadrant A | 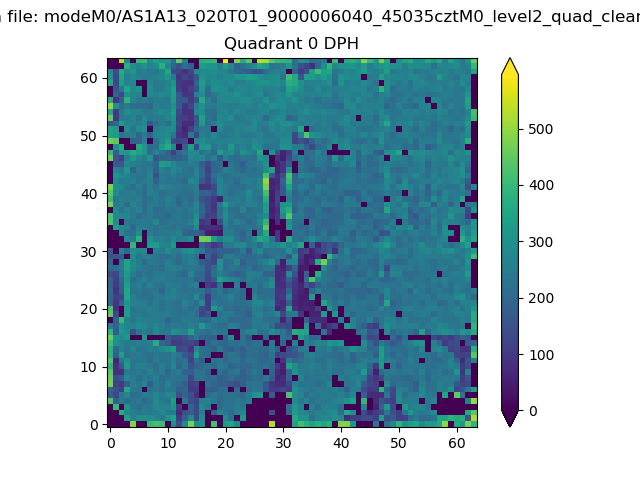 |
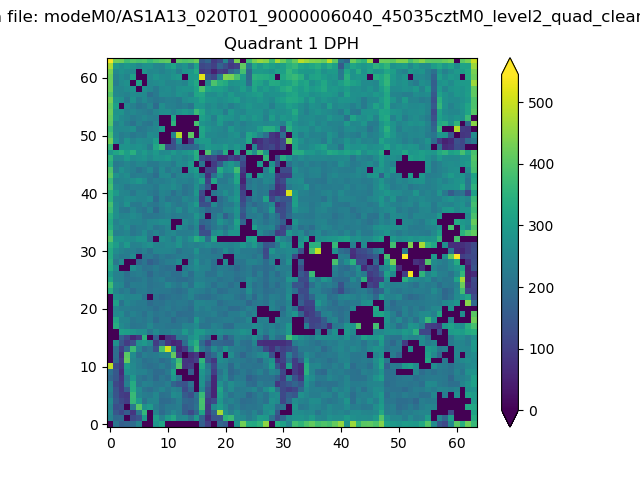 |
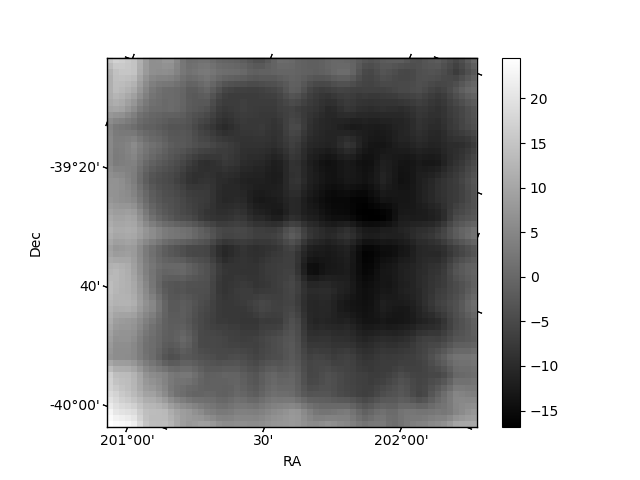
Quadrant B |
|---|---|---|---|
| Quadrant D | 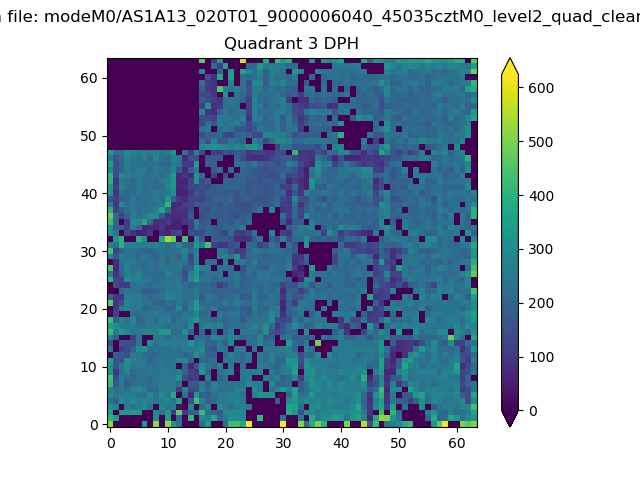 |
 |
Quadrant C |
| Plot type | Count rate plots | Images |
|---|---|---|
| Comparison with Poisson distribution Blue bars denote a histogram of data divided into 1 sec bins. Red curve is a Poisson curve with rate = median count rate of data. |
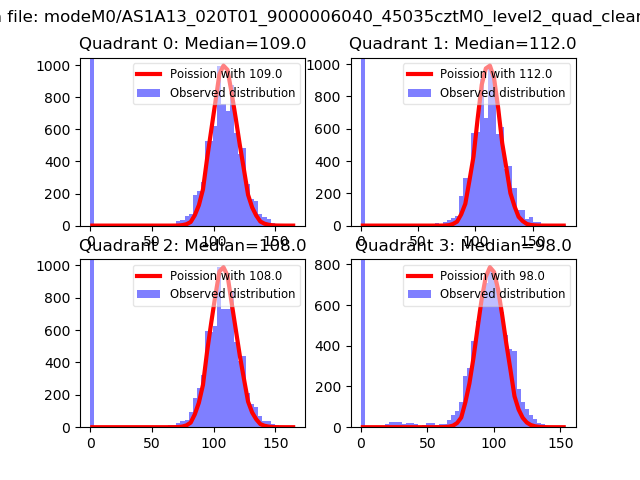 |
 |
| Quadrant-wise count rates Data is divided into 100 sec bins |
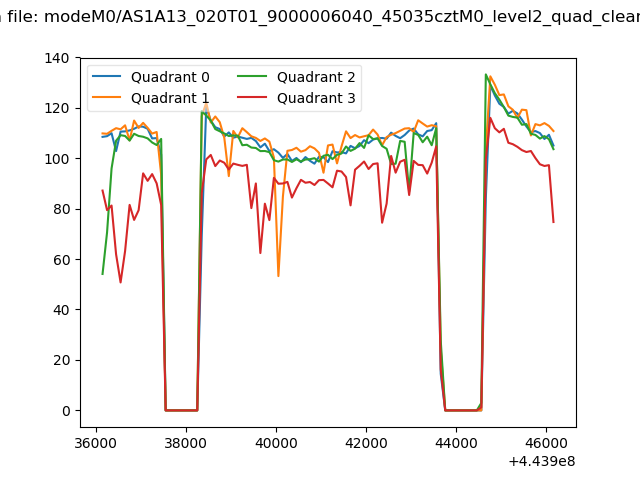 |
|
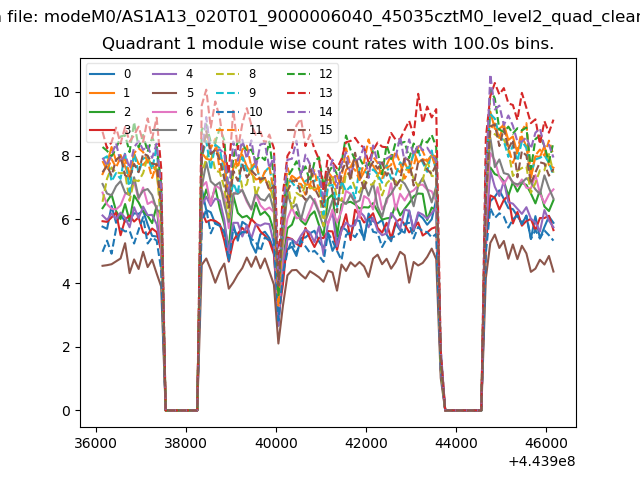
| Module-wise count rates for Quadrant A Data is divided into 100 sec bins |
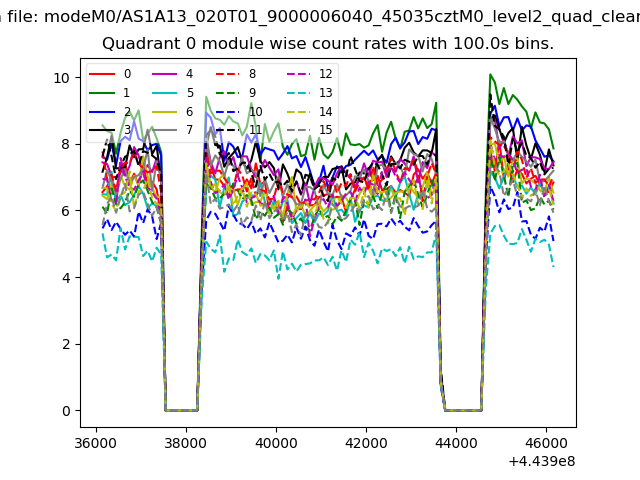 |
 |
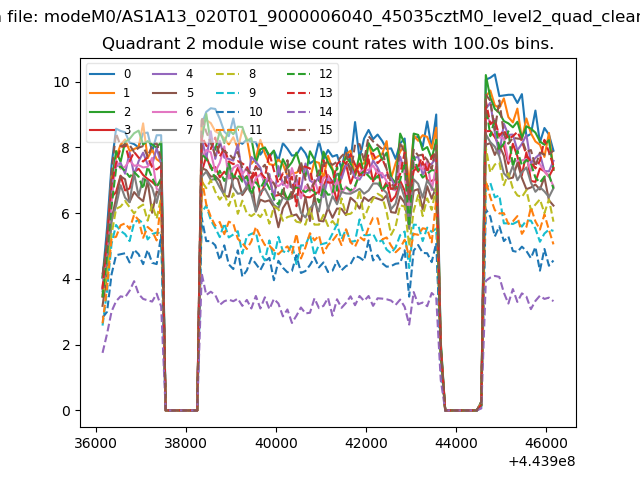
| Module-wise count rates for Quadrant B Data is divided into 100 sec bins |
 |
 |
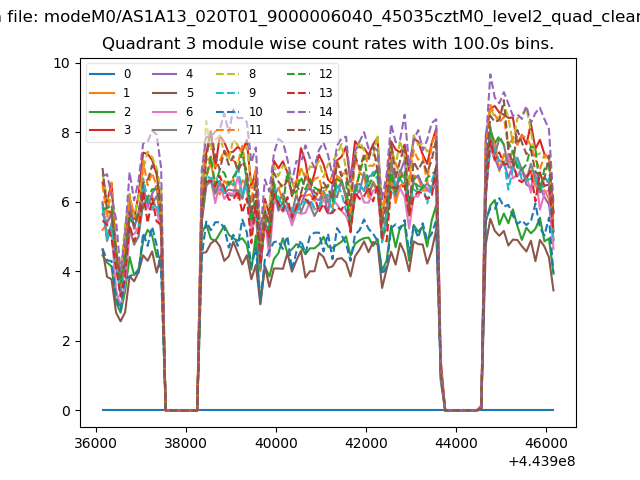
| Module-wise count rates for Quadrant C Data is divided into 100 sec bins |
 |
 |
| Module-wise count rates for Quadrant D Data is divided into 100 sec bins |
 |
 |
| Parameter | Plot |
|---|---|
| CZT HV Monitor | 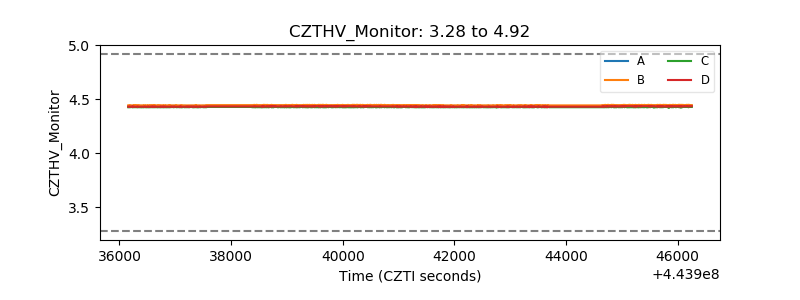 |
| D_VDD | 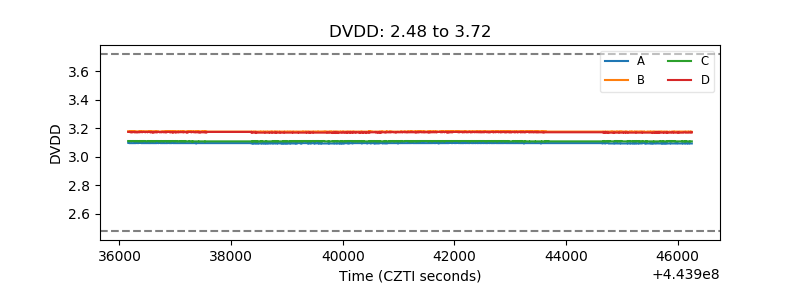 |
| Temperature 1 | 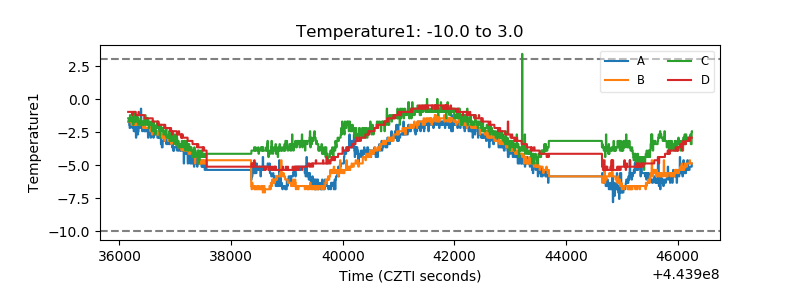 |
| Veto HV Monitor | 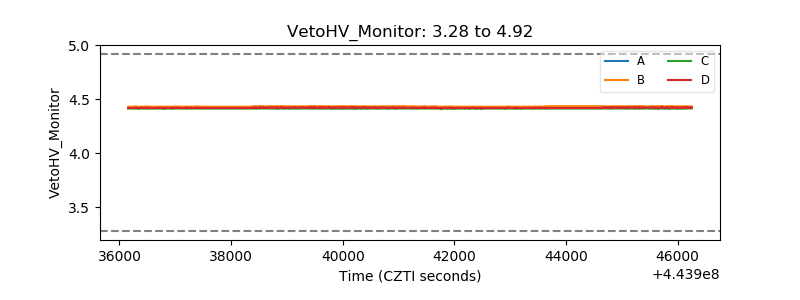 |
| Veto LLD | 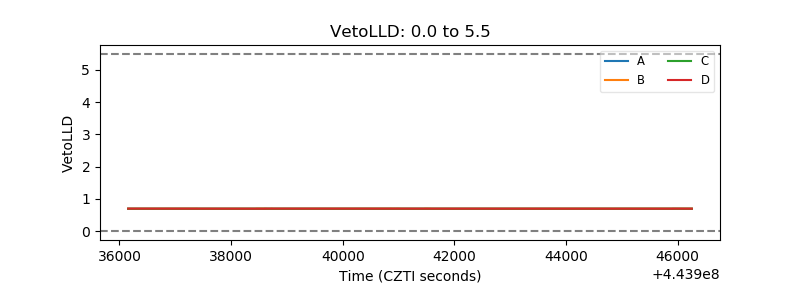 |
| Alpha Counter | 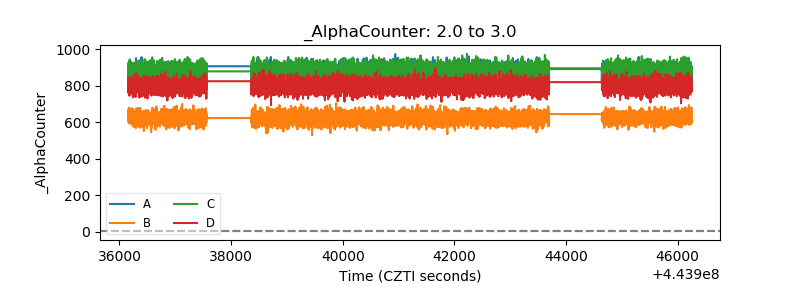 |
| _CPM_Rate | 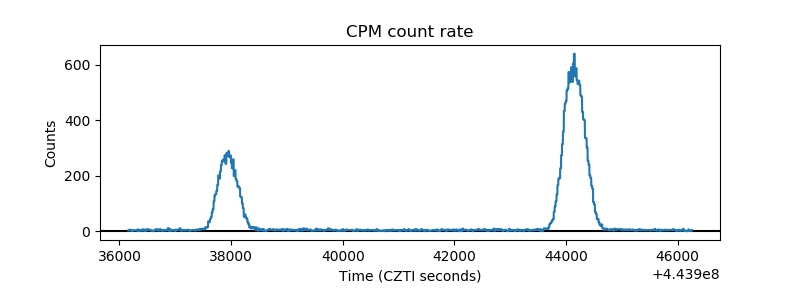 |
| CZT Counter | 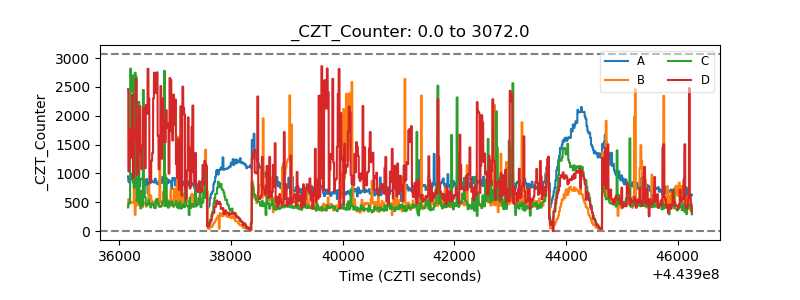 |
| +2.5 Volts monitor | 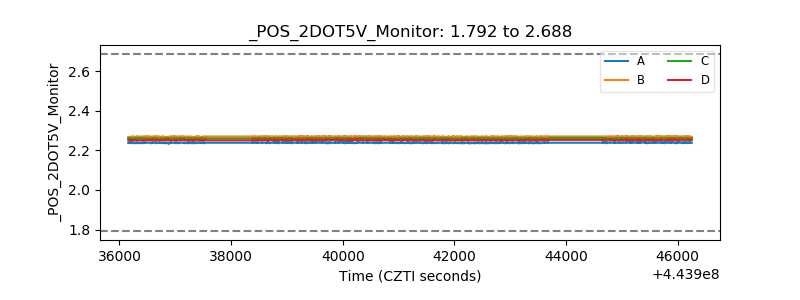 |
| +5 Volts monitor | 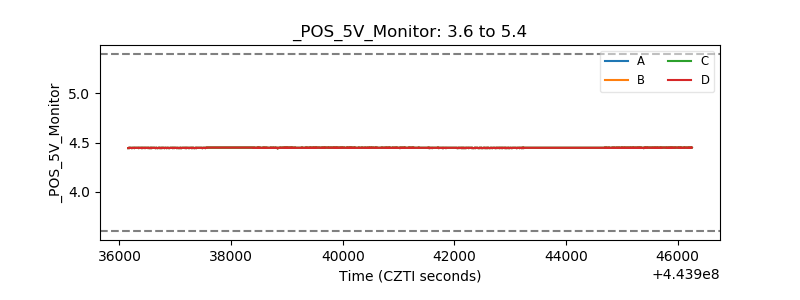 |
| _ROLL_ROT | 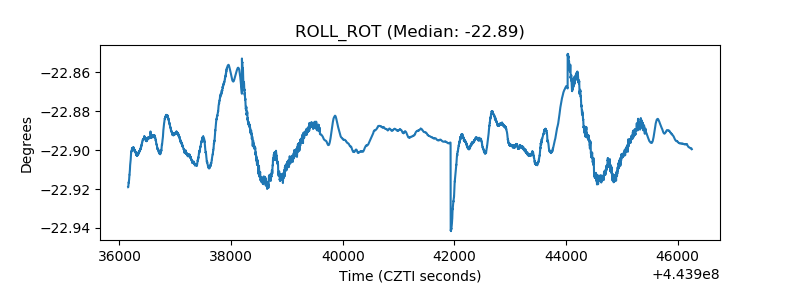 |
| _Roll_DEC | 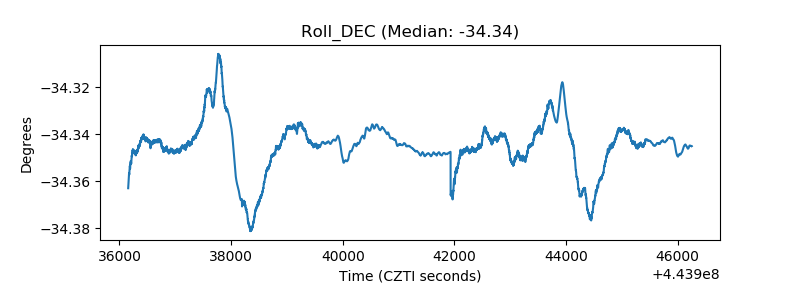 |
| _Roll_RA | 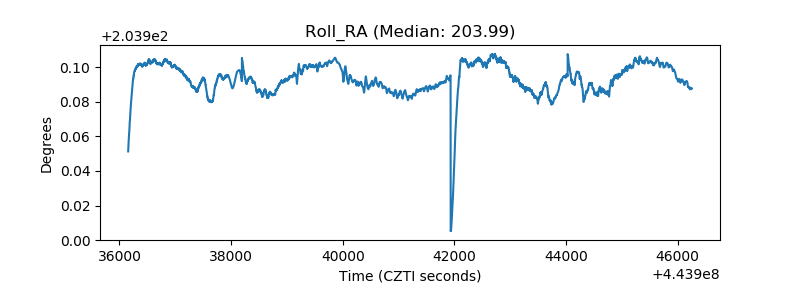 |
| Veto Counter | 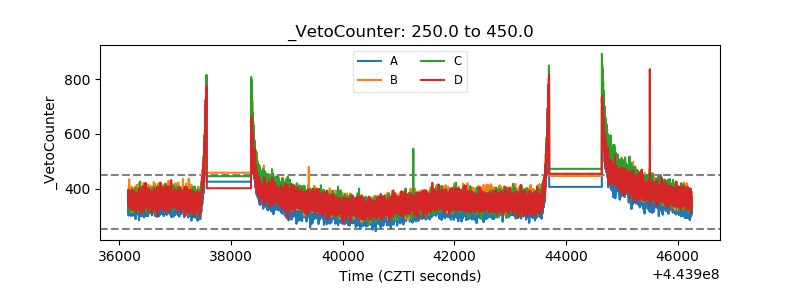 |