| Param | Original file | Final file |
|---|---|---|
| Filename | modeM0/AS1A13_020T01_9000006040_45037cztM0_level2.fits | modeM0/AS1A13_020T01_9000006040_45037cztM0_level2_quad_clean.evt |
| Size (bytes) | 503,043,840 | 103,968,000 |
| Size | 479.7 MB | 99.2 MB |
| Events in quadrant A | 5,031,906 | 705,806 |
| Events in quadrant B | 3,971,476 | 704,685 |
| Events in quadrant C | 3,385,536 | 700,727 |
| Events in quadrant D | 5,743,831 | 597,553 |
| Mode SS | |||
|---|---|---|---|
| Quadrant | BADHDUFLAG | Total packets | Discarded packets |
| A | 0 | 128 | 0 |
| B | 0 | 128 | 0 |
| C | 0 | 128 | 0 |
| D | 0 | 128 | 0 |
| Mode M9 | |||
|---|---|---|---|
| Quadrant | BADHDUFLAG | Total packets | Discarded packets |
| A | 0 | 11 | 0 |
| B | 0 | 11 | 0 |
| C | 0 | 11 | 0 |
| D | 0 | 11 | 0 |
| Mode M0 | |||
|---|---|---|---|
| Quadrant | BADHDUFLAG | Total packets | Discarded packets |
| A | 0 | 19634 | 1 |
| B | 0 | 15961 | 1 |
| C | 0 | 14407 | 1 |
| D | 0 | 21343 | 1 |
| Quadrant | Total seconds | Saturated seconds | Saturation percentage |
|---|---|---|---|
| A | 6294 | 122 | 1.938354% |
| B | 6295 | 334 | 5.305798% |
| C | 6295 | 111 | 1.763304% |
| D | 6295 | 612 | 9.722002% |
Noise dominated data is calculated using 1-second bins in cleaned event files. If a bin has >2000 counts, and if more than 50% of those come from <1% of pixels, then it is considered to be noise-dominated and hence unusable.
| Quadrant | # 1 sec bins | Bins with >0 counts | Bins with >2000 counts | High rate bins dominated by noise | Noise dominated (total time) | Noise dominated (detector-on time) | Marked lightcurve |
|---|---|---|---|---|---|---|---|
| A | 7379 | 6295 | 15 | 15 | 0.20% | 0.24% | 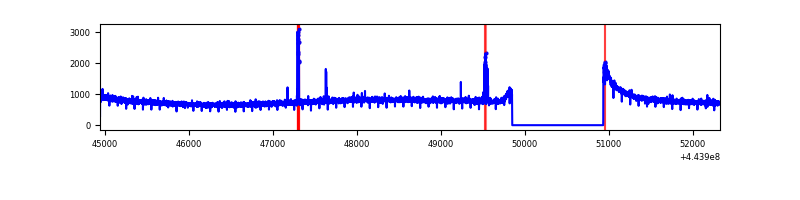 |
| B | 7380 | 6296 | 205 | 205 | 2.78% | 3.26% | 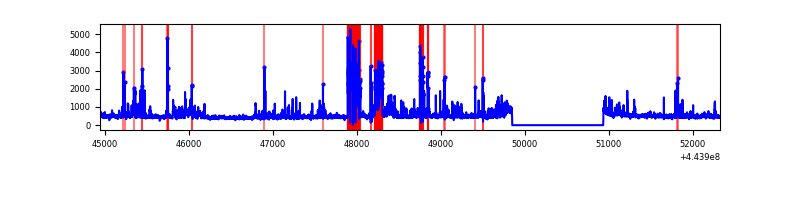 |
| C | 7380 | 6296 | 67 | 67 | 0.91% | 1.06% | 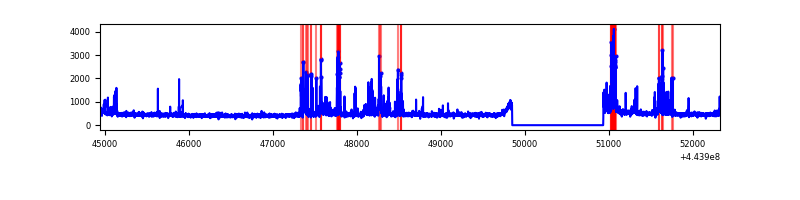 |
| D | 7380 | 6296 | 440 | 440 | 5.96% | 6.99% | 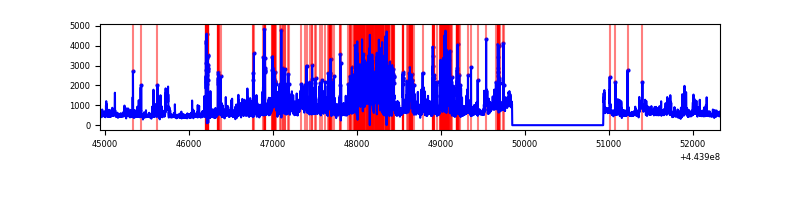 |
Top three noisy pixels from each quadrant. If the there are fewer than three noisy pixels in the level2.evt file, extra rows are filled as -1
| Pixel properties | Quadrant properties | ||||||
|---|---|---|---|---|---|---|---|
| Quadrant | DetID | PixID | Counts | Sigma | Mean | Median | Sigma |
| A | 10 | 83 | 2170277 | 14551.65 | 720 | 705 | 149.1 |
| A | 15 | 174 | 50786 | 335.9 | 720 | 705 | 149.1 |
| A | 7 | 16 | 15500 | 99.23 | 720 | 705 | 149.1 |
| B | 0 | 189 | 894857 | 6447.81 | 703 | 684 | 138.7 |
| B | 5 | 255 | 91677 | 656.14 | 703 | 684 | 138.7 |
| B | 12 | 48 | 64659 | 461.32 | 703 | 684 | 138.7 |
| C | 14 | 254 | 500528 | 2973.39 | 715 | 722 | 168.1 |
| C | 15 | 208 | 60564 | 356.01 | 715 | 722 | 168.1 |
| C | 1 | 3 | 17132 | 97.62 | 715 | 722 | 168.1 |
| D | 13 | 249 | 1199233 | 6919.72 | 688 | 669 | 173.2 |
| D | 5 | 222 | 393551 | 2268.24 | 688 | 669 | 173.2 |
| D | 13 | 174 | 263012 | 1514.6 | 688 | 669 | 173.2 |
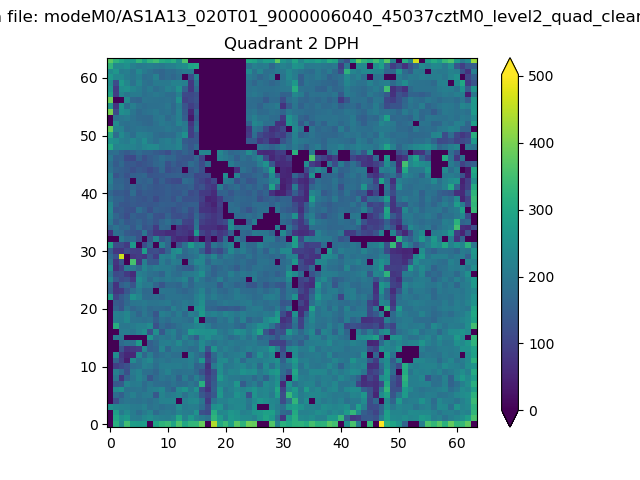
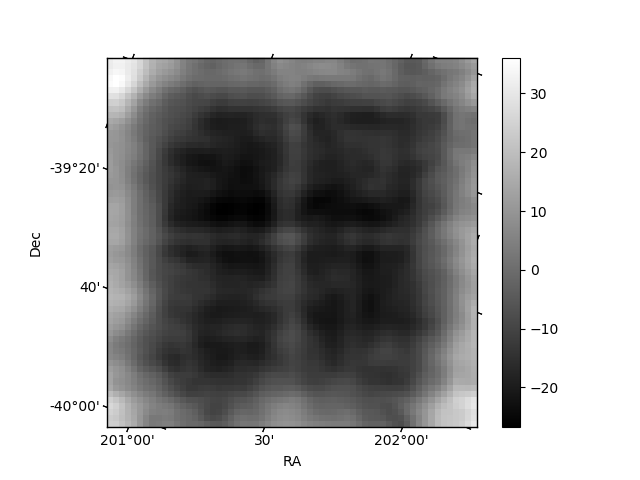
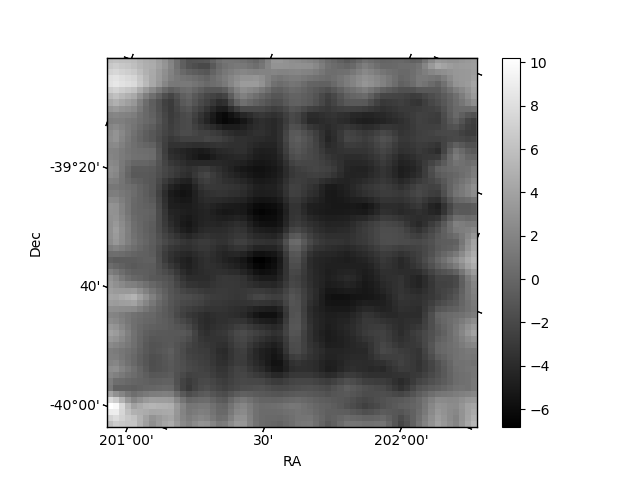
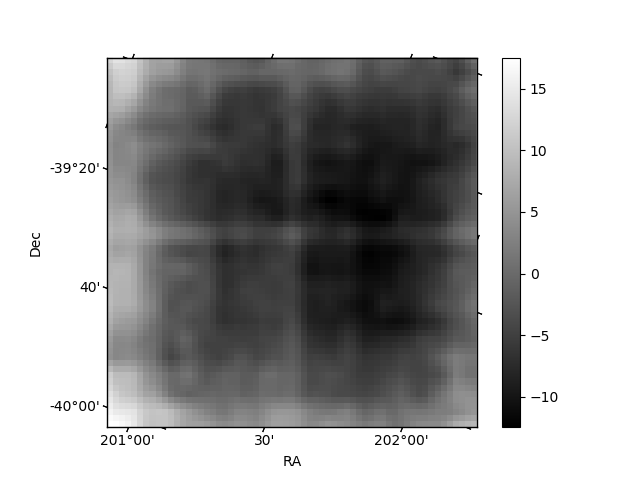
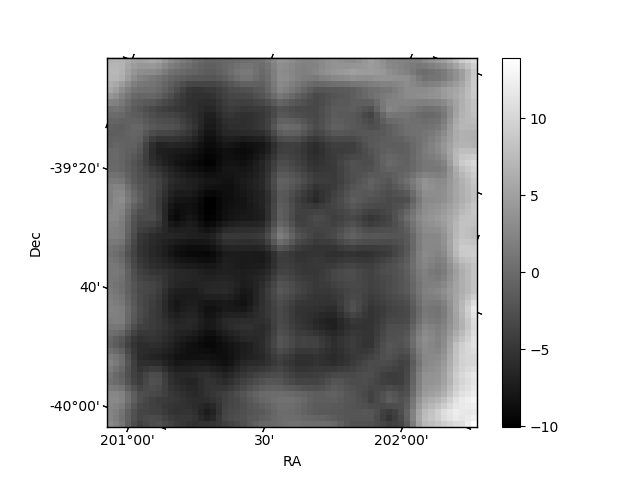
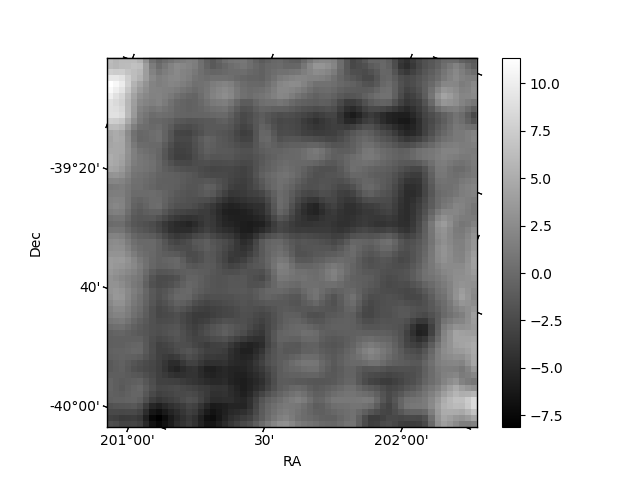
Histogram calculated using DETX and DETY for each event in the final _common_clean file
| Quadrant A | 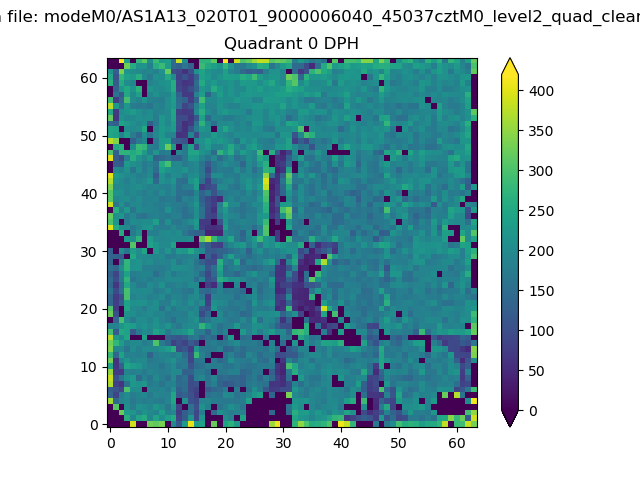 |
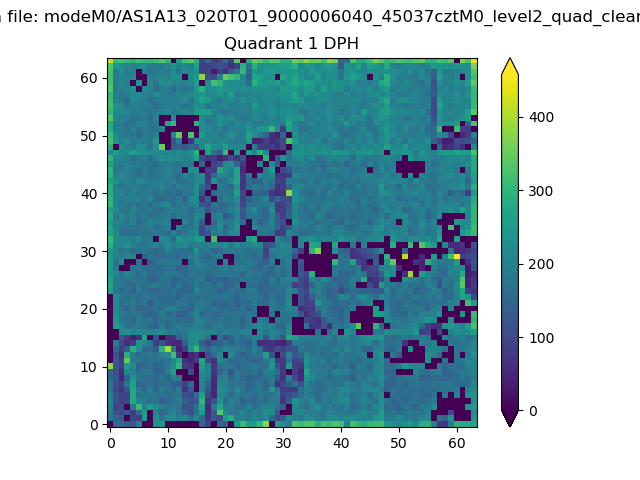 |
Quadrant B |
|---|---|---|---|
| Quadrant D | 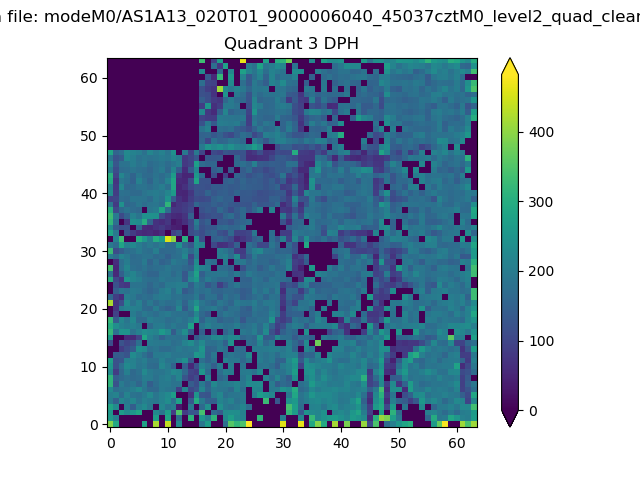 |
 |
Quadrant C |
| Plot type | Count rate plots | Images |
|---|---|---|
| Comparison with Poisson distribution Blue bars denote a histogram of data divided into 1 sec bins. Red curve is a Poisson curve with rate = median count rate of data. |
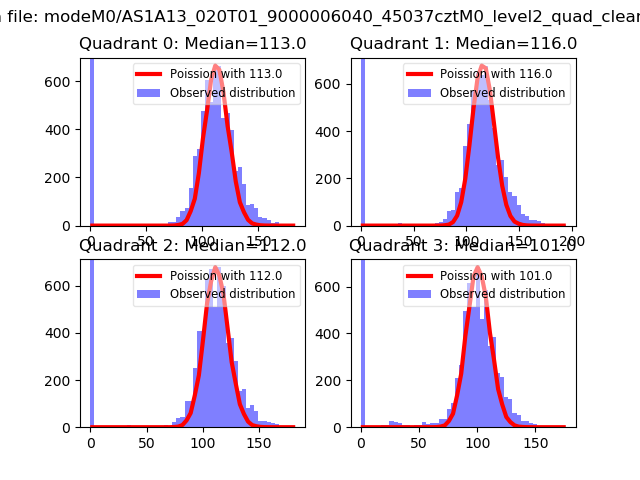 |
 |
| Quadrant-wise count rates Data is divided into 100 sec bins |
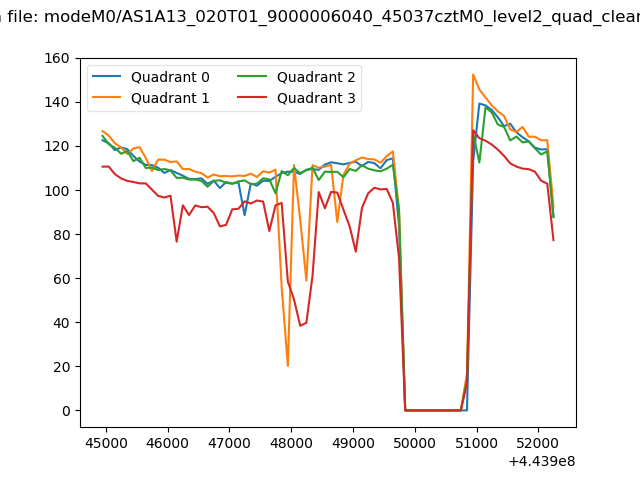 |
|
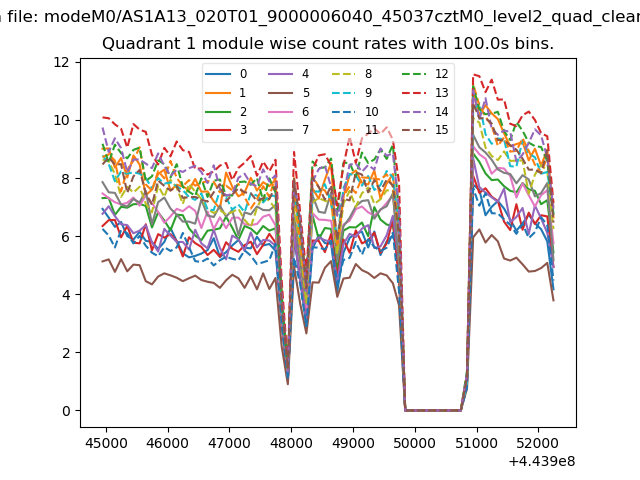
| Module-wise count rates for Quadrant A Data is divided into 100 sec bins |
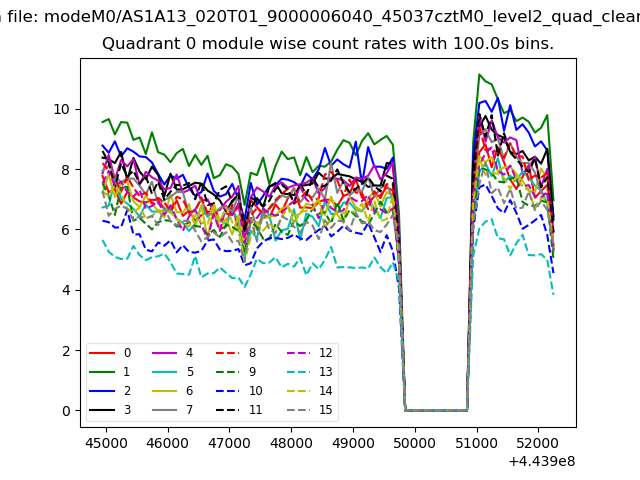 |
 |
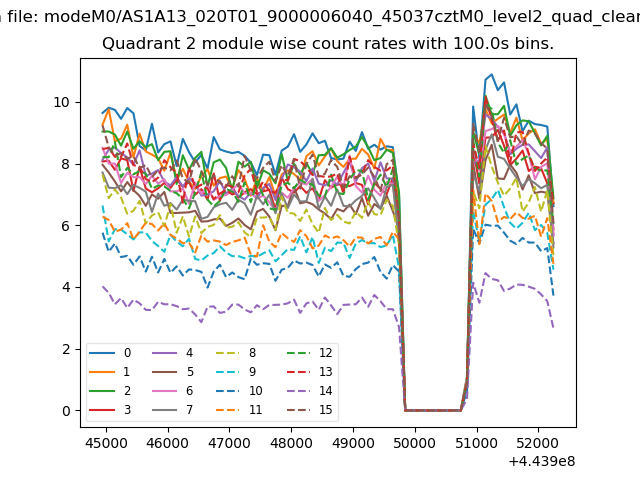
| Module-wise count rates for Quadrant B Data is divided into 100 sec bins |
 |
 |
| Module-wise count rates for Quadrant C Data is divided into 100 sec bins |
 |
 |
| Module-wise count rates for Quadrant D Data is divided into 100 sec bins |
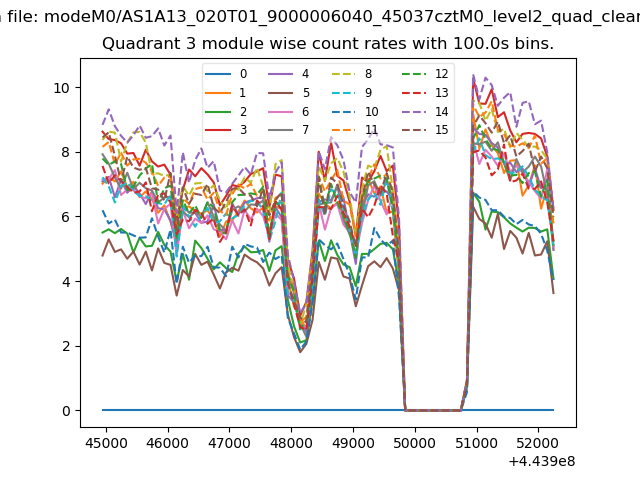 |
 |
| Parameter | Plot |
|---|---|
| CZT HV Monitor | 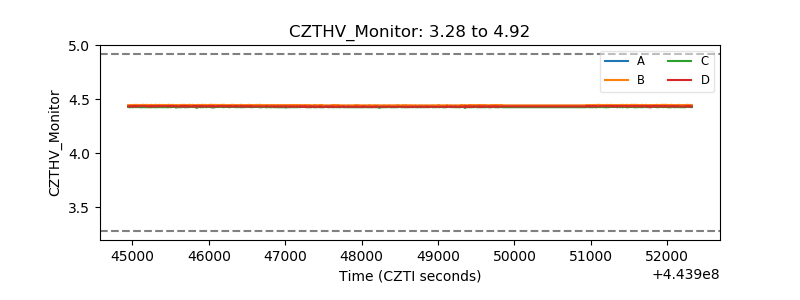 |
| D_VDD | 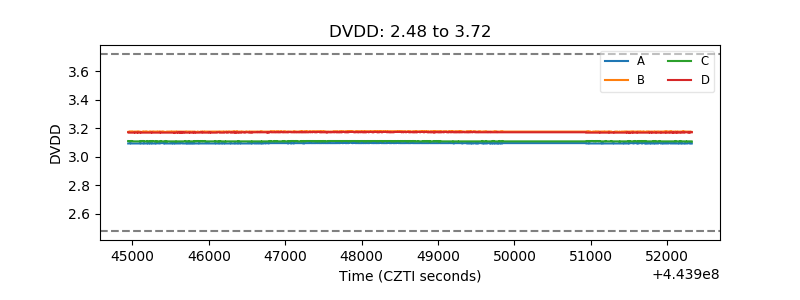 |
| Temperature 1 | 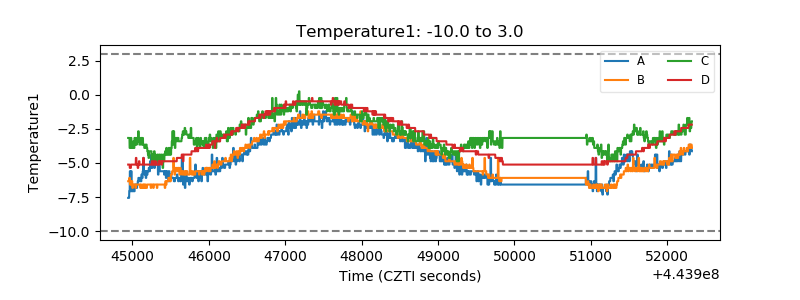 |
| Veto HV Monitor | 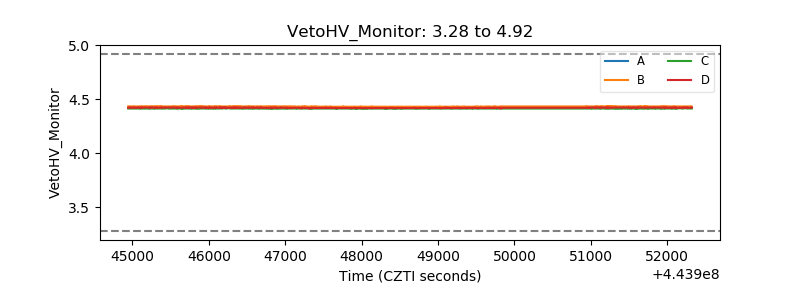 |
| Veto LLD | 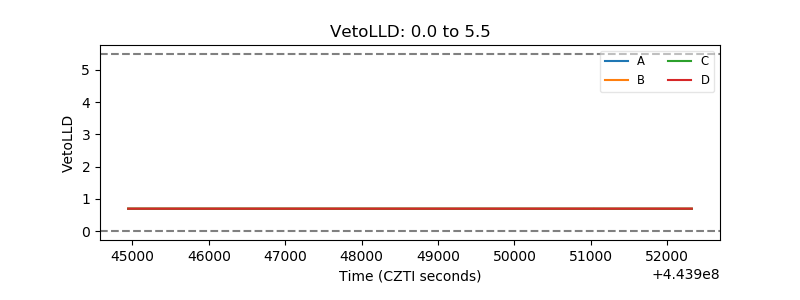 |
| Alpha Counter | 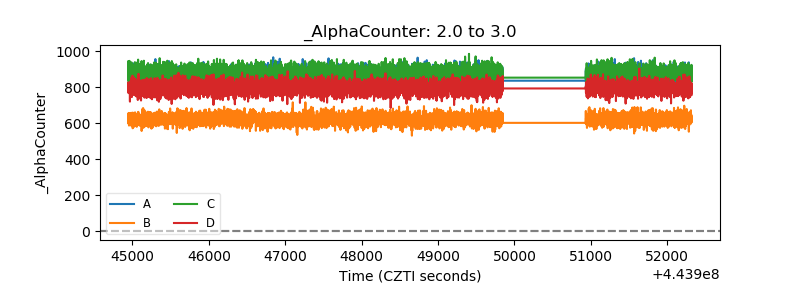 |
| _CPM_Rate | 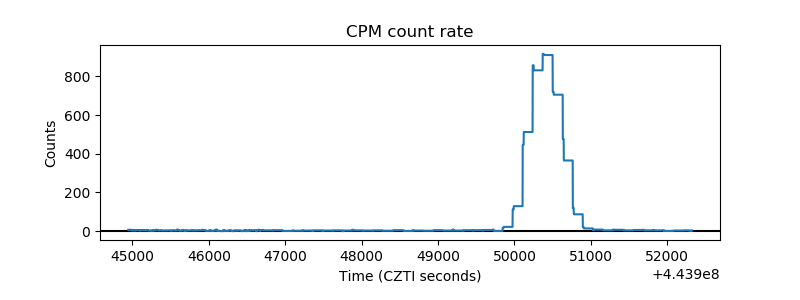 |
| CZT Counter | 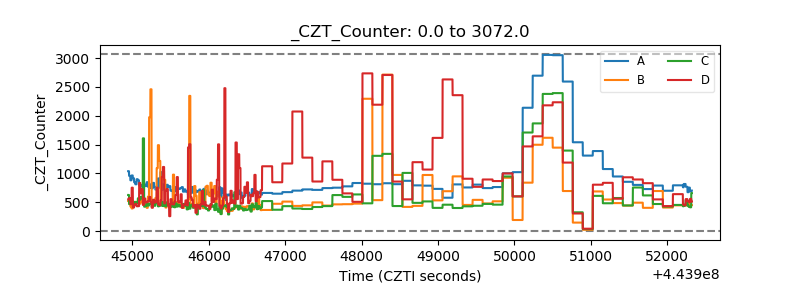 |
| +2.5 Volts monitor | 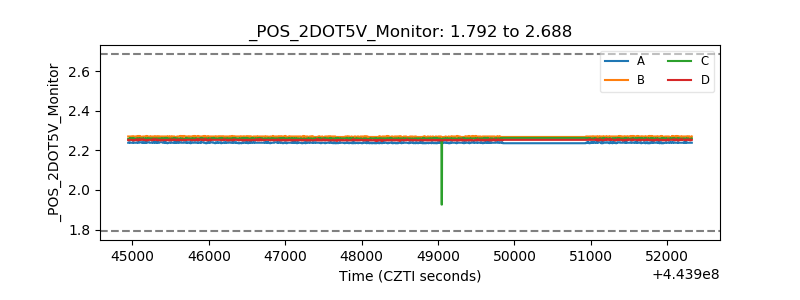 |
| +5 Volts monitor | 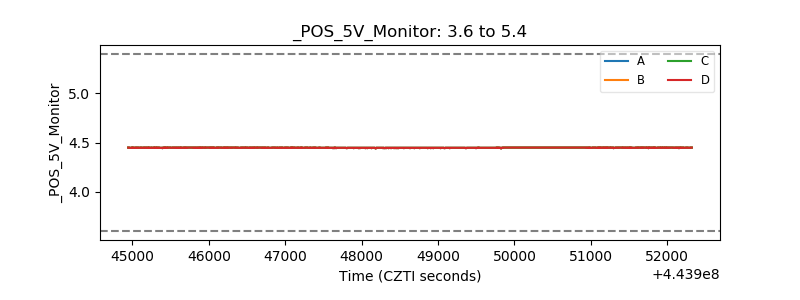 |
| _ROLL_ROT | 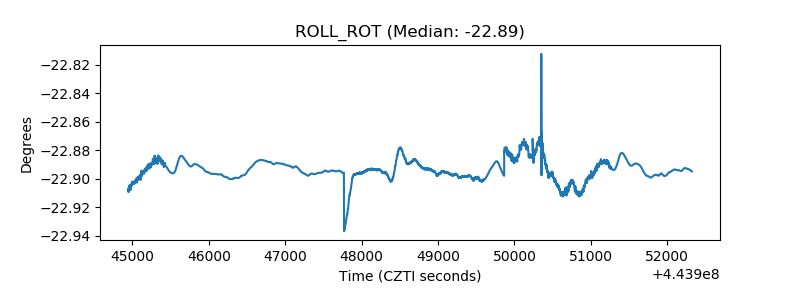 |
| _Roll_DEC | 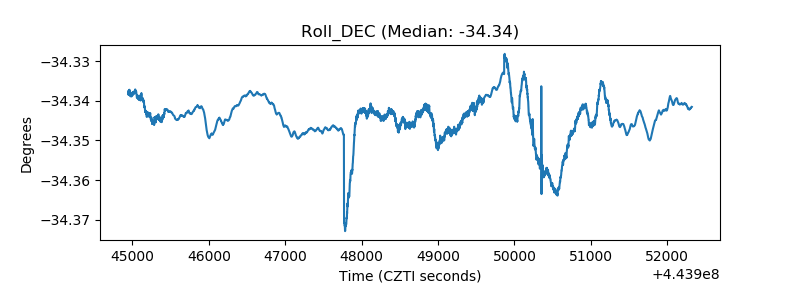 |
| _Roll_RA | 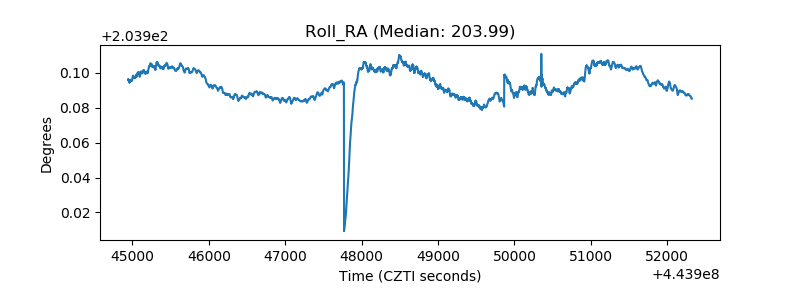 |
| Veto Counter | 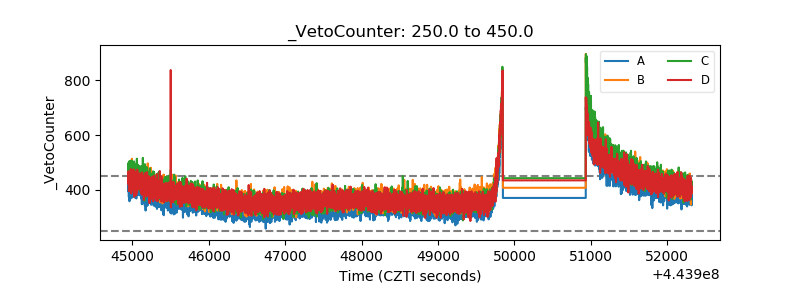 |