| Param | Original file | Final file |
|---|---|---|
| Filename | modeM0/AS1A13_020T01_9000006040_45038cztM0_level2.fits | modeM0/AS1A13_020T01_9000006040_45038cztM0_level2_quad_clean.evt |
| Size (bytes) | 515,433,600 | 105,240,960 |
| Size | 491.6 MB | 100.4 MB |
| Events in quadrant A | 5,108,485 | 719,361 |
| Events in quadrant B | 3,925,592 | 723,490 |
| Events in quadrant C | 3,504,309 | 711,638 |
| Events in quadrant D | 6,062,683 | 601,786 |
| Mode SS | |||
|---|---|---|---|
| Quadrant | BADHDUFLAG | Total packets | Discarded packets |
| A | 0 | 124 | 0 |
| B | 0 | 124 | 0 |
| C | 0 | 124 | 0 |
| D | 0 | 124 | 0 |
| Mode M9 | |||
|---|---|---|---|
| Quadrant | BADHDUFLAG | Total packets | Discarded packets |
| A | 0 | 12 | 0 |
| B | 0 | 12 | 0 |
| C | 0 | 12 | 0 |
| D | 0 | 12 | 0 |
| Mode M0 | |||
|---|---|---|---|
| Quadrant | BADHDUFLAG | Total packets | Discarded packets |
| A | 0 | 19428 | 1 |
| B | 0 | 15585 | 1 |
| C | 0 | 14477 | 1 |
| D | 0 | 22280 | 1 |
| Quadrant | Total seconds | Saturated seconds | Saturation percentage |
|---|---|---|---|
| A | 6170 | 158 | 2.560778% |
| B | 6171 | 324 | 5.250365% |
| C | 6171 | 182 | 2.949279% |
| D | 6171 | 710 | 11.505429% |
Noise dominated data is calculated using 1-second bins in cleaned event files. If a bin has >2000 counts, and if more than 50% of those come from <1% of pixels, then it is considered to be noise-dominated and hence unusable.
| Quadrant | # 1 sec bins | Bins with >0 counts | Bins with >2000 counts | High rate bins dominated by noise | Noise dominated (total time) | Noise dominated (detector-on time) | Marked lightcurve |
|---|---|---|---|---|---|---|---|
| A | 7300 | 6171 | 6 | 6 | 0.08% | 0.10% | 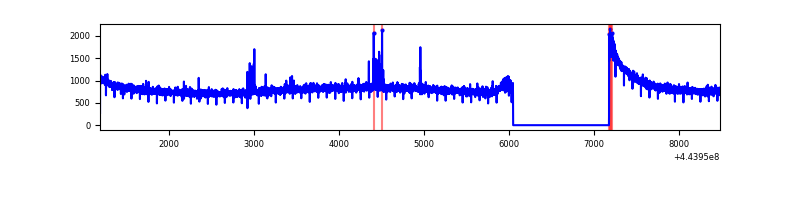 |
| B | 7301 | 6172 | 182 | 182 | 2.49% | 2.95% | 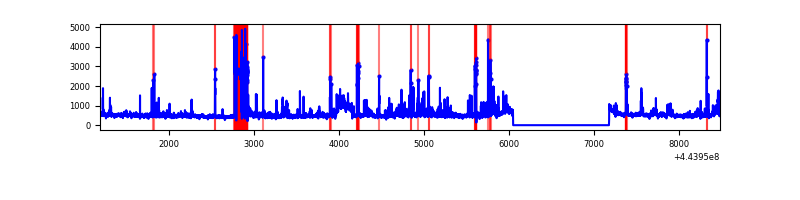 |
| C | 7301 | 6172 | 102 | 102 | 1.40% | 1.65% | 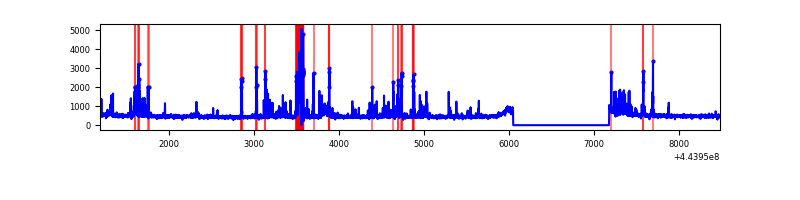 |
| D | 7301 | 6172 | 590 | 590 | 8.08% | 9.56% | 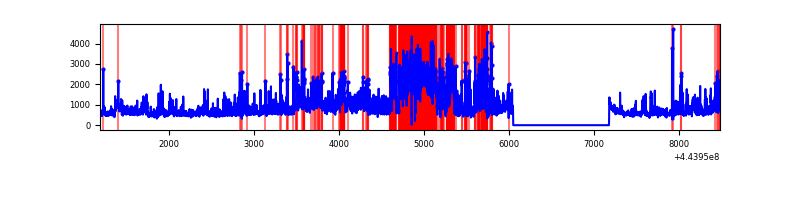 |
Top three noisy pixels from each quadrant. If the there are fewer than three noisy pixels in the level2.evt file, extra rows are filled as -1
| Pixel properties | Quadrant properties | ||||||
|---|---|---|---|---|---|---|---|
| Quadrant | DetID | PixID | Counts | Sigma | Mean | Median | Sigma |
| A | 10 | 83 | 2221515 | 14536.72 | 735 | 717 | 152.8 |
| A | 0 | 243 | 25877 | 164.69 | 735 | 717 | 152.8 |
| A | 15 | 174 | 11500 | 70.58 | 735 | 717 | 152.8 |
| B | 0 | 189 | 638985 | 4625.64 | 714 | 693 | 138.0 |
| B | 15 | 36 | 131512 | 948.03 | 714 | 693 | 138.0 |
| B | 5 | 255 | 93424 | 672.01 | 714 | 693 | 138.0 |
| C | 14 | 254 | 551854 | 3250.53 | 725 | 729 | 169.5 |
| C | 15 | 208 | 89073 | 521.05 | 725 | 729 | 169.5 |
| C | 2 | 14 | 16706 | 94.23 | 725 | 729 | 169.5 |
| D | 1 | 47 | 1320355 | 7427.64 | 705 | 685 | 177.7 |
| D | 13 | 174 | 743969 | 4183.51 | 705 | 685 | 177.7 |
| D | 5 | 235 | 268359 | 1506.58 | 705 | 685 | 177.7 |
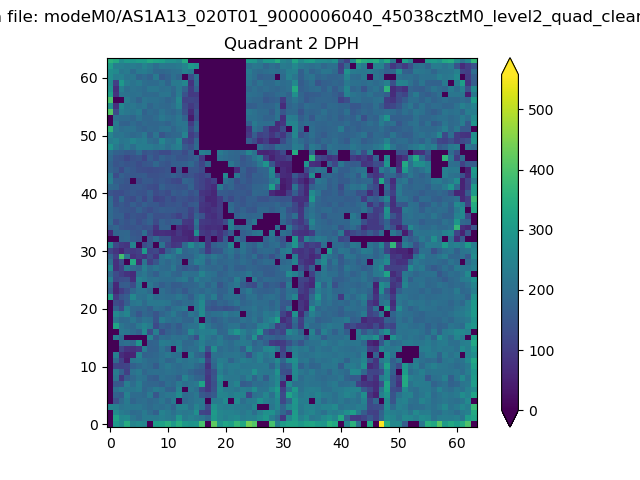
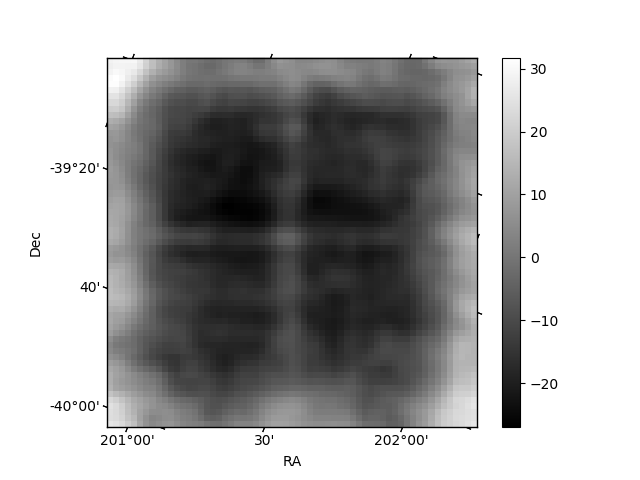
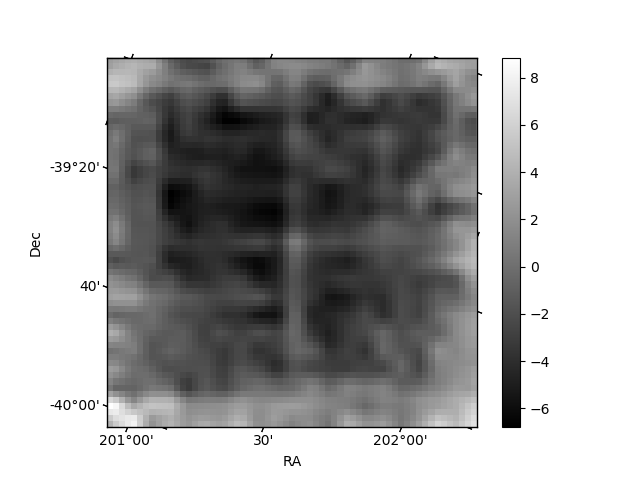
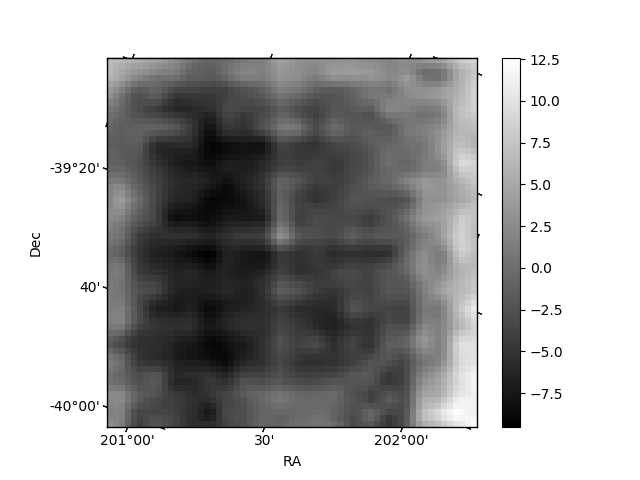
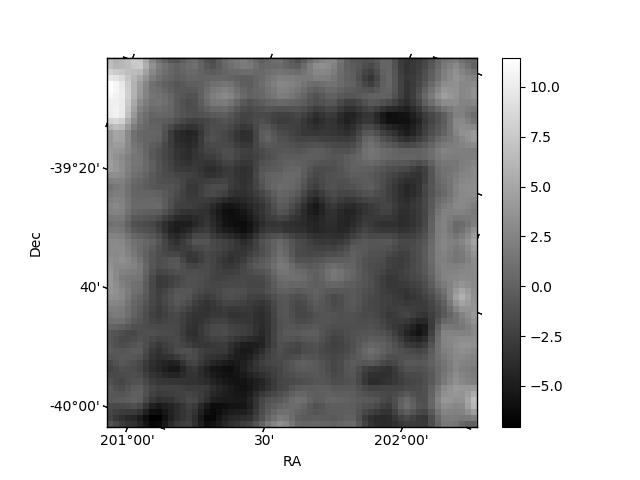
Histogram calculated using DETX and DETY for each event in the final _common_clean file
| Quadrant A | 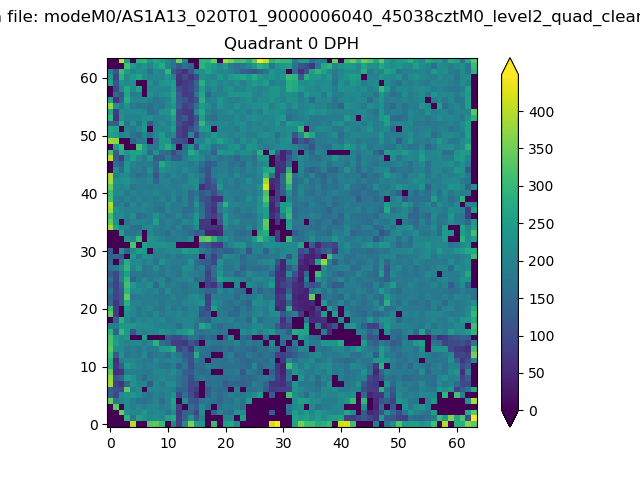 |
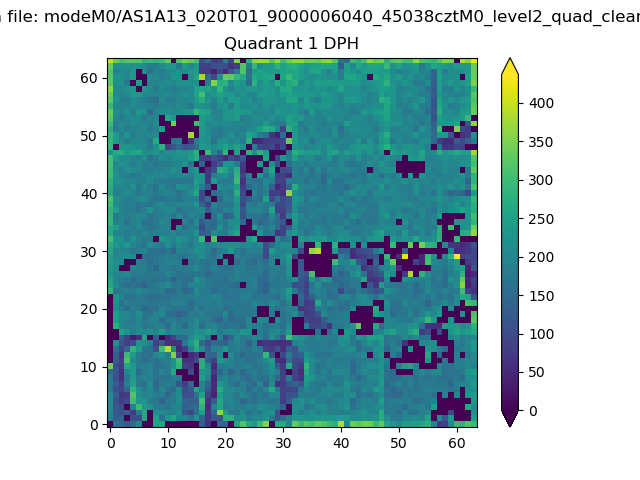 |
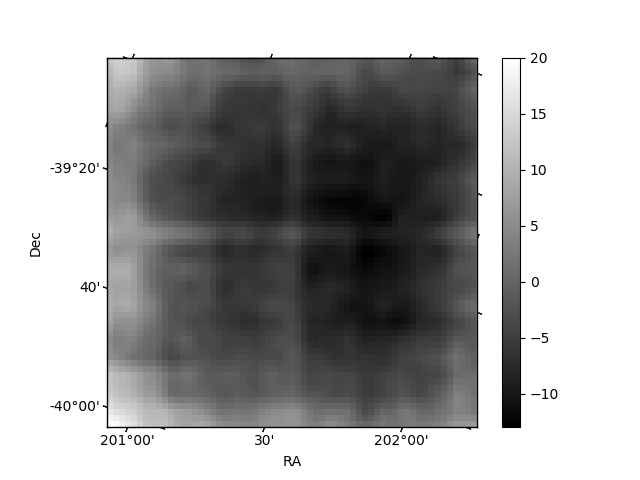
Quadrant B |
|---|---|---|---|
| Quadrant D | 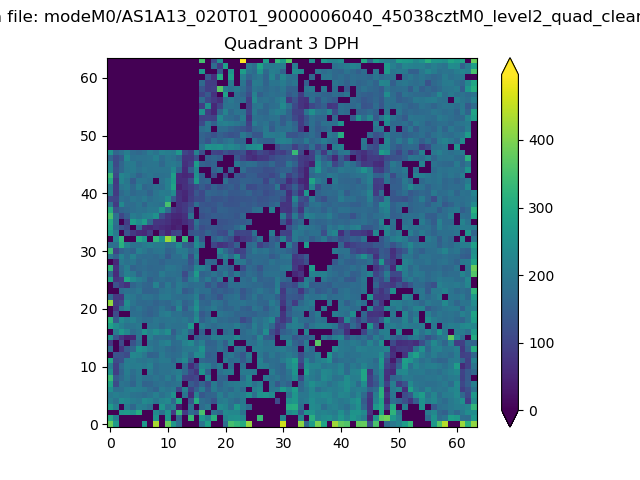 |
 |
Quadrant C |
| Plot type | Count rate plots | Images |
|---|---|---|
| Comparison with Poisson distribution Blue bars denote a histogram of data divided into 1 sec bins. Red curve is a Poisson curve with rate = median count rate of data. |
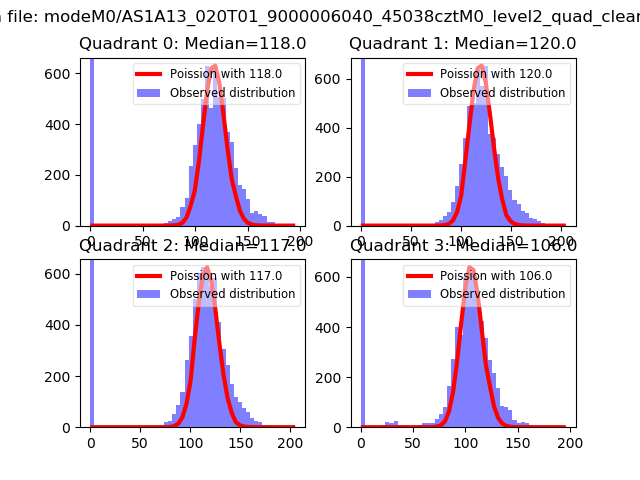 |
 |
| Quadrant-wise count rates Data is divided into 100 sec bins |
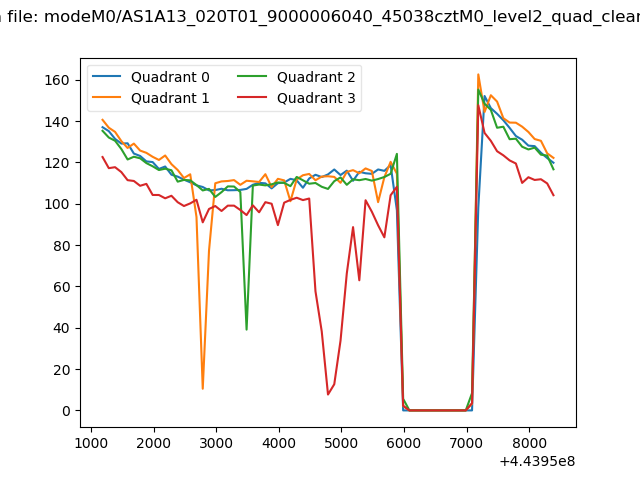 |
|
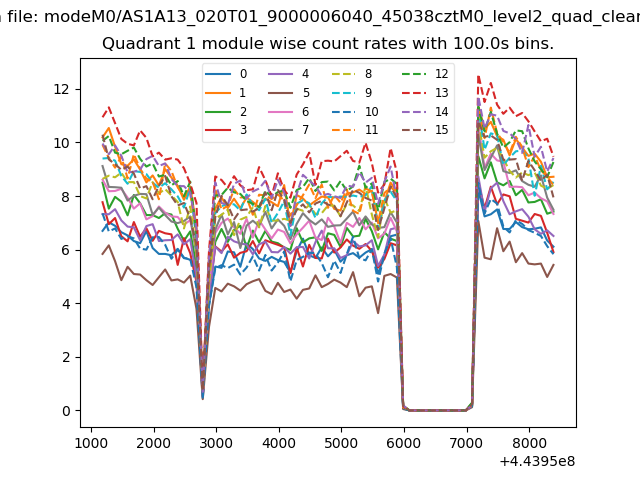
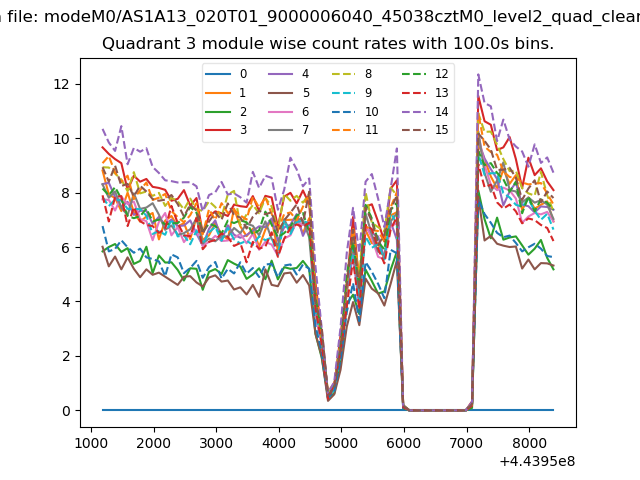
| Module-wise count rates for Quadrant A Data is divided into 100 sec bins |
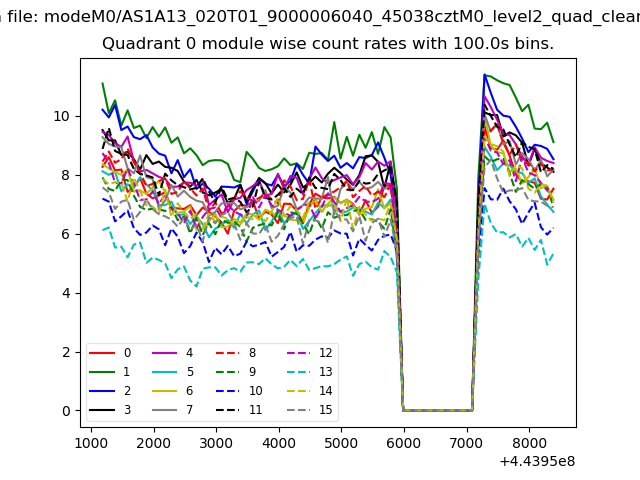 |
 |
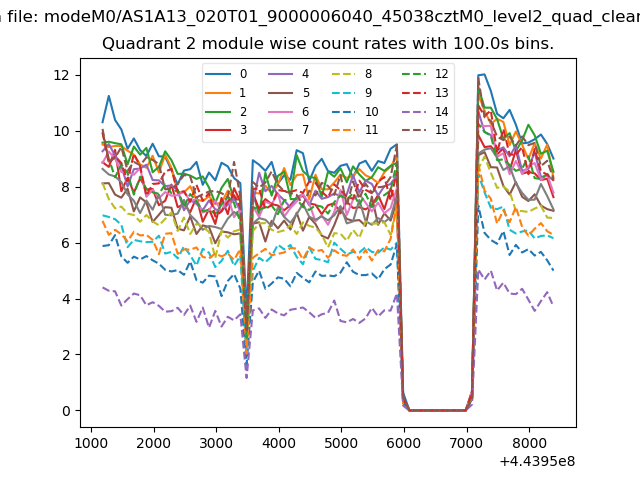
| Module-wise count rates for Quadrant B Data is divided into 100 sec bins |
 |
 |
| Module-wise count rates for Quadrant C Data is divided into 100 sec bins |
 |
 |
| Module-wise count rates for Quadrant D Data is divided into 100 sec bins |
 |
 |
| Parameter | Plot |
|---|---|
| CZT HV Monitor | 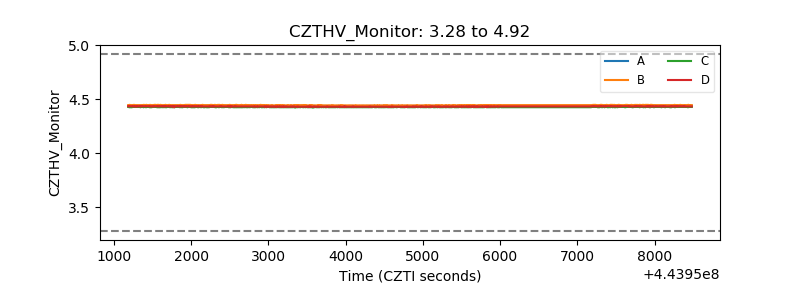 |
| D_VDD | 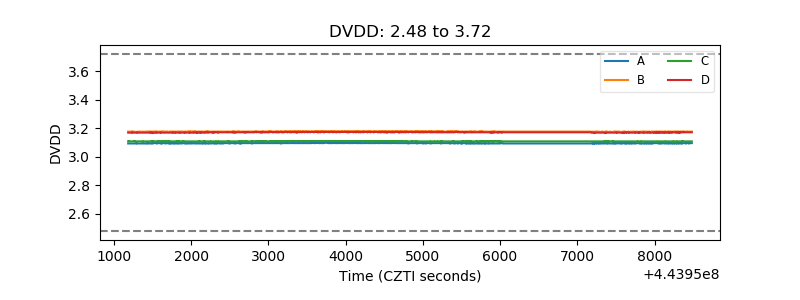 |
| Temperature 1 | 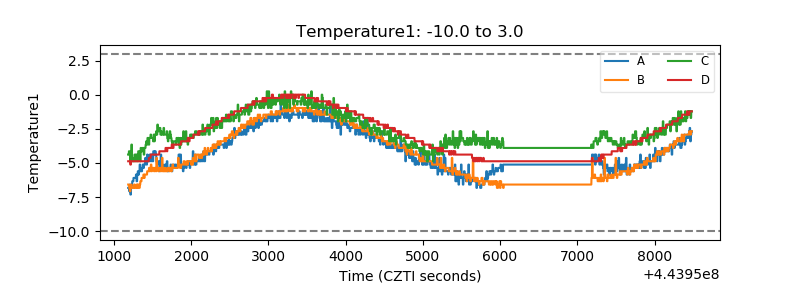 |
| Veto HV Monitor | 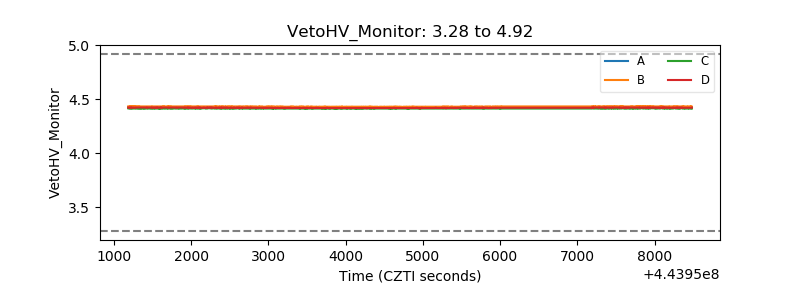 |
| Veto LLD | 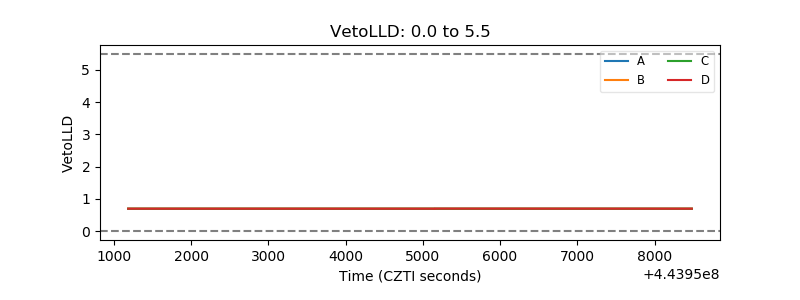 |
| Alpha Counter | 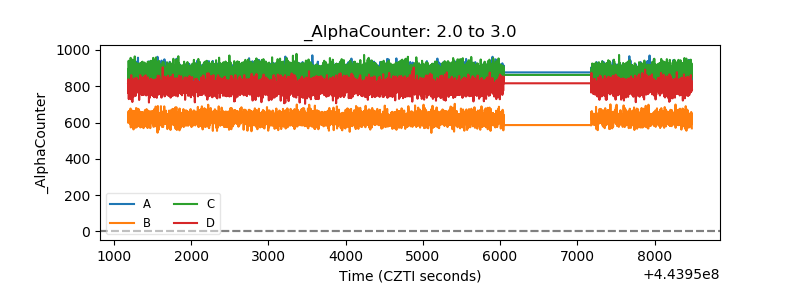 |
| _CPM_Rate | 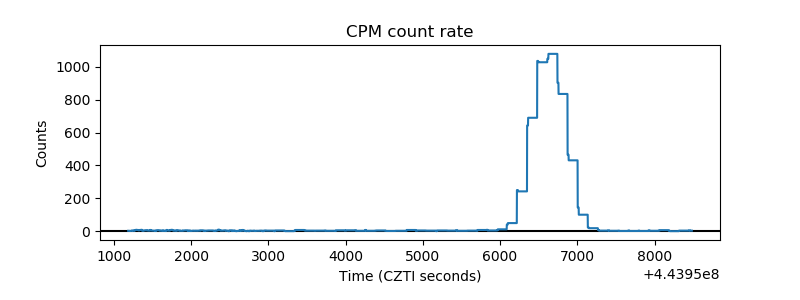 |
| CZT Counter | 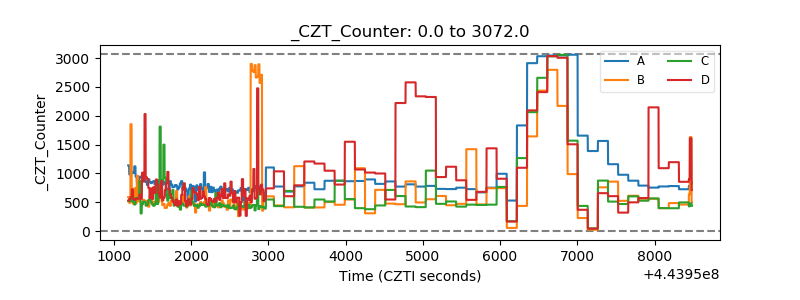 |
| +2.5 Volts monitor | 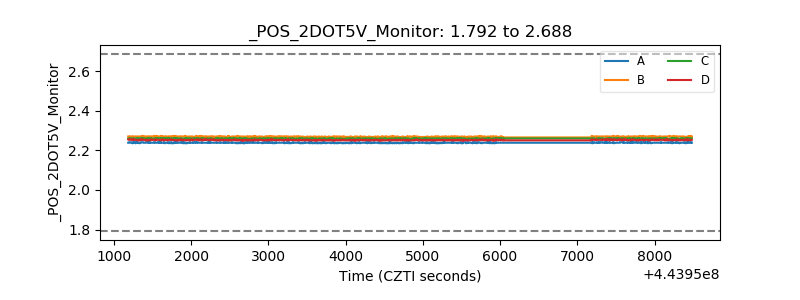 |
| +5 Volts monitor | 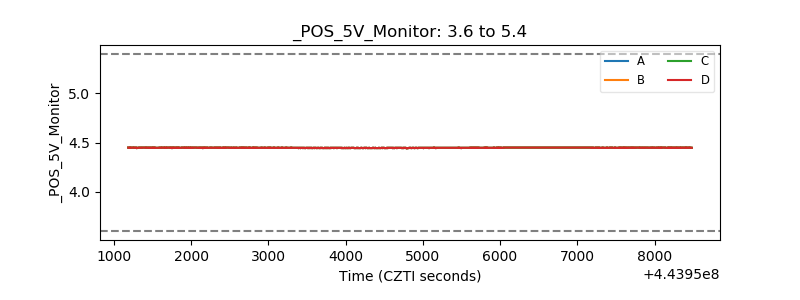 |
| _ROLL_ROT | 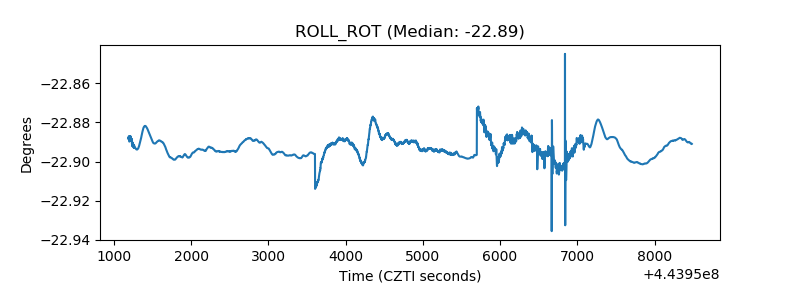 |
| _Roll_DEC | 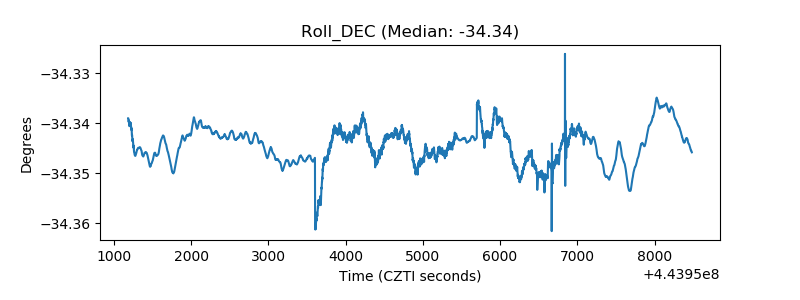 |
| _Roll_RA | 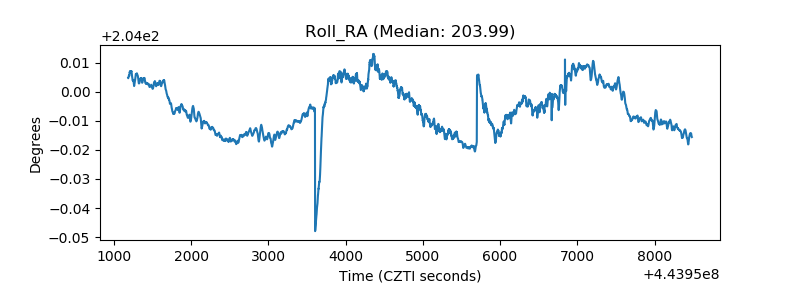 |
| Veto Counter | 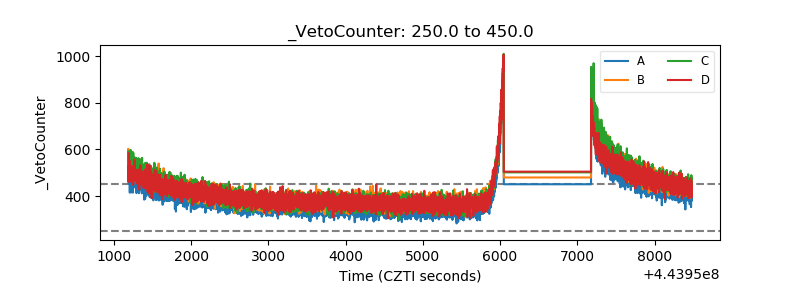 |