| Param | Original file | Final file |
|---|---|---|
| Filename | modeM0/AS1A13_020T01_9000006040_45039cztM0_level2.fits | modeM0/AS1A13_020T01_9000006040_45039cztM0_level2_quad_clean.evt |
| Size (bytes) | 573,995,520 | 110,609,280 |
| Size | 547.4 MB | 105.5 MB |
| Events in quadrant A | 5,415,622 | 764,991 |
| Events in quadrant B | 3,863,687 | 774,375 |
| Events in quadrant C | 3,405,060 | 762,897 |
| Events in quadrant D | 8,073,790 | 606,107 |
| Mode SS | |||
|---|---|---|---|
| Quadrant | BADHDUFLAG | Total packets | Discarded packets |
| A | 0 | 128 | 0 |
| B | 0 | 128 | 0 |
| C | 0 | 128 | 0 |
| D | 0 | 128 | 0 |
| Mode M9 | |||
|---|---|---|---|
| Quadrant | BADHDUFLAG | Total packets | Discarded packets |
| A | 0 | 12 | 0 |
| B | 0 | 12 | 0 |
| C | 0 | 12 | 0 |
| D | 0 | 12 | 0 |
| Mode M0 | |||
|---|---|---|---|
| Quadrant | BADHDUFLAG | Total packets | Discarded packets |
| A | 0 | 20244 | 1 |
| B | 0 | 15397 | 1 |
| C | 0 | 14143 | 1 |
| D | 0 | 28406 | 1 |
| Quadrant | Total seconds | Saturated seconds | Saturation percentage |
|---|---|---|---|
| A | 6318 | 148 | 2.342513% |
| B | 6318 | 251 | 3.972776% |
| C | 6319 | 95 | 1.503402% |
| D | 6319 | 1152 | 18.230733% |
Noise dominated data is calculated using 1-second bins in cleaned event files. If a bin has >2000 counts, and if more than 50% of those come from <1% of pixels, then it is considered to be noise-dominated and hence unusable.
| Quadrant | # 1 sec bins | Bins with >0 counts | Bins with >2000 counts | High rate bins dominated by noise | Noise dominated (total time) | Noise dominated (detector-on time) | Marked lightcurve |
|---|---|---|---|---|---|---|---|
| A | 7533 | 6319 | 10 | 10 | 0.13% | 0.16% | 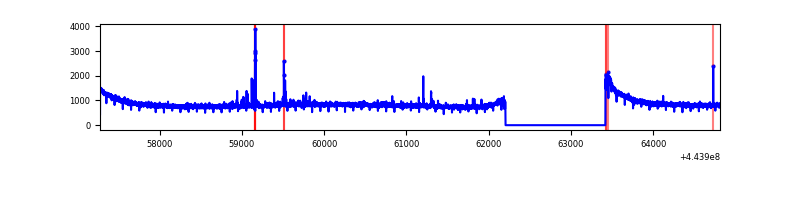 |
| B | 7533 | 6319 | 128 | 128 | 1.70% | 2.03% | 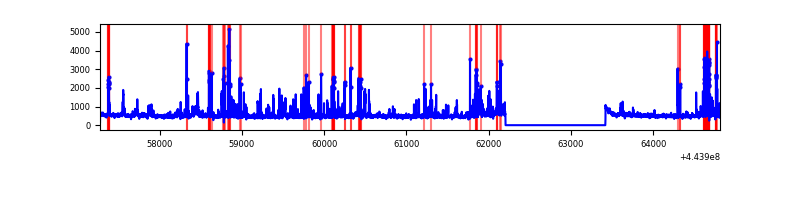 |
| C | 7534 | 6320 | 45 | 45 | 0.60% | 0.71% | 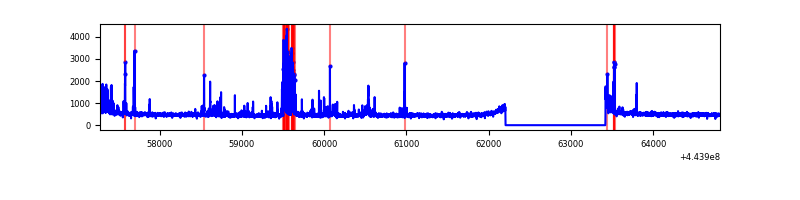 |
| D | 7534 | 6319 | 957 | 957 | 12.70% | 15.14% | 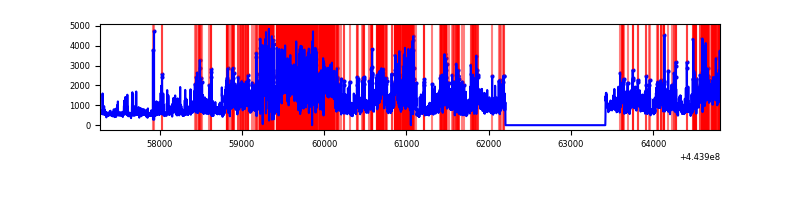 |
Top three noisy pixels from each quadrant. If the there are fewer than three noisy pixels in the level2.evt file, extra rows are filled as -1
| Pixel properties | Quadrant properties | ||||||
|---|---|---|---|---|---|---|---|
| Quadrant | DetID | PixID | Counts | Sigma | Mean | Median | Sigma |
| A | 10 | 83 | 2374612 | 14974.13 | 768 | 753 | 158.5 |
| A | 13 | 248 | 59716 | 371.93 | 768 | 753 | 158.5 |
| A | 0 | 243 | 13984 | 83.46 | 768 | 753 | 158.5 |
| B | 0 | 189 | 401844 | 2750.52 | 753 | 732 | 145.8 |
| B | 5 | 255 | 174739 | 1193.21 | 753 | 732 | 145.8 |
| B | 5 | 32 | 145986 | 996.04 | 753 | 732 | 145.8 |
| C | 14 | 254 | 278624 | 1577.17 | 757 | 763 | 176.2 |
| C | 12 | 2 | 73954 | 415.44 | 757 | 763 | 176.2 |
| C | 1 | 3 | 49167 | 274.75 | 757 | 763 | 176.2 |
| D | 13 | 174 | 2221559 | 12501.99 | 713 | 694 | 177.6 |
| D | 5 | 235 | 990507 | 5571.98 | 713 | 694 | 177.6 |
| D | 13 | 249 | 477194 | 2682.37 | 713 | 694 | 177.6 |
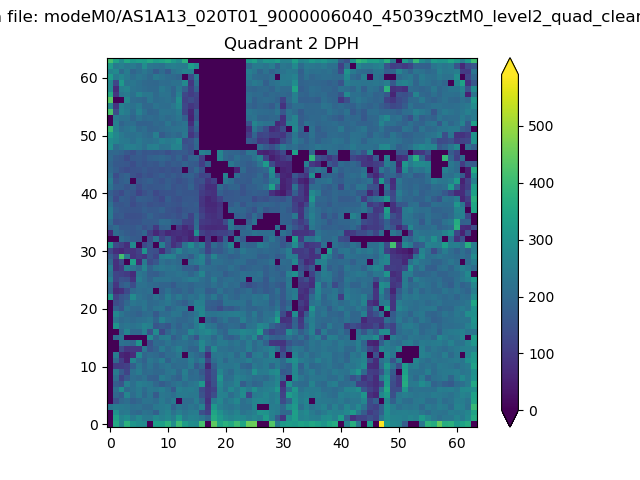
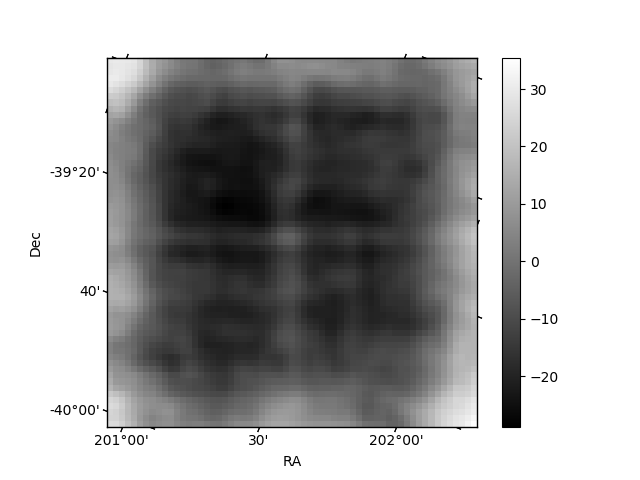
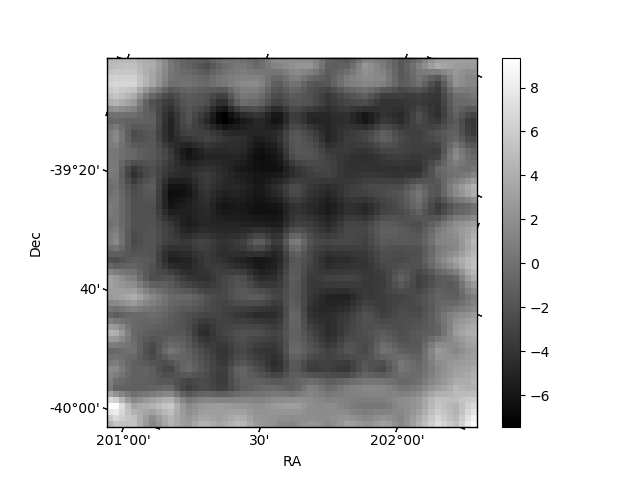
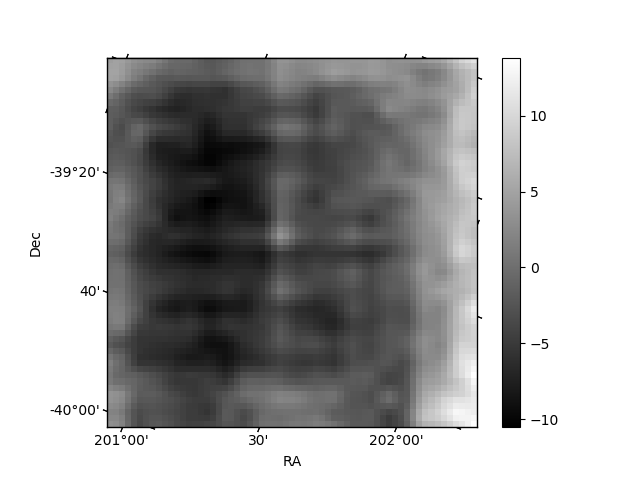
Histogram calculated using DETX and DETY for each event in the final _common_clean file
| Quadrant A | 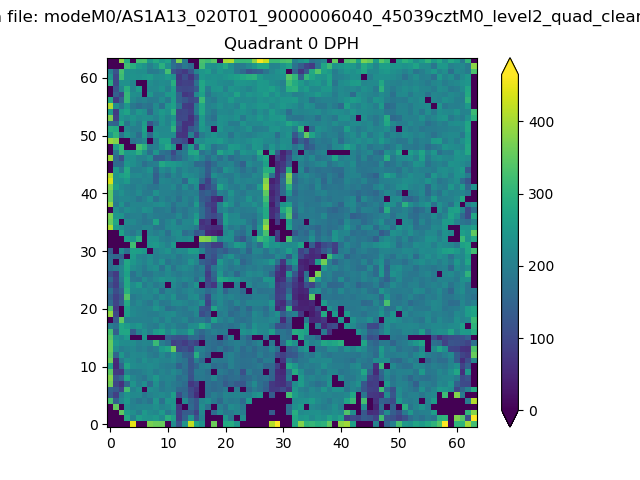 |
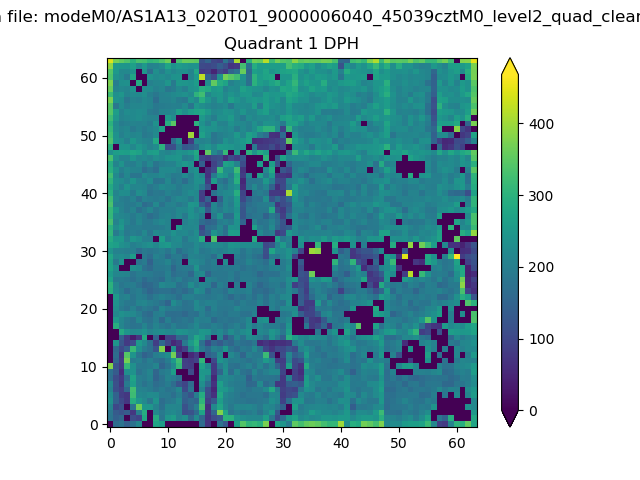 |
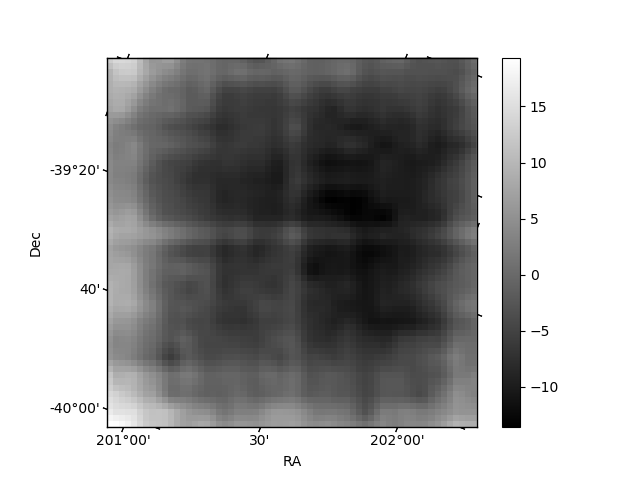
Quadrant B |
|---|---|---|---|
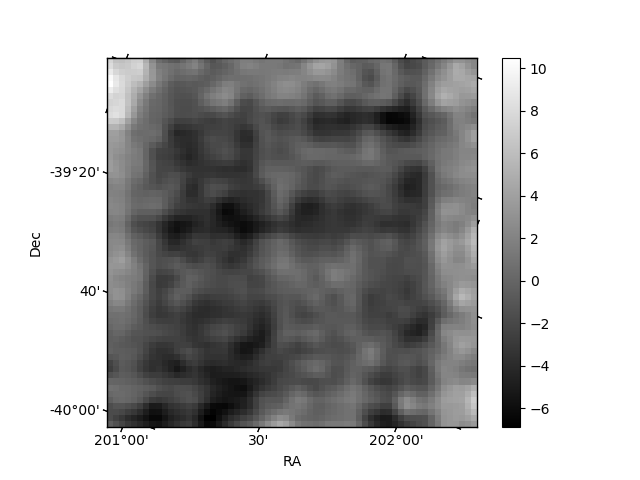
| Quadrant D | 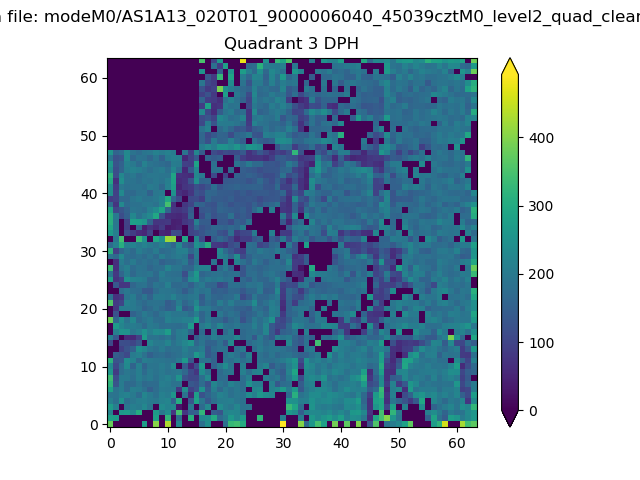 |
 |
Quadrant C |
| Plot type | Count rate plots | Images |
|---|---|---|
| Comparison with Poisson distribution Blue bars denote a histogram of data divided into 1 sec bins. Red curve is a Poisson curve with rate = median count rate of data. |
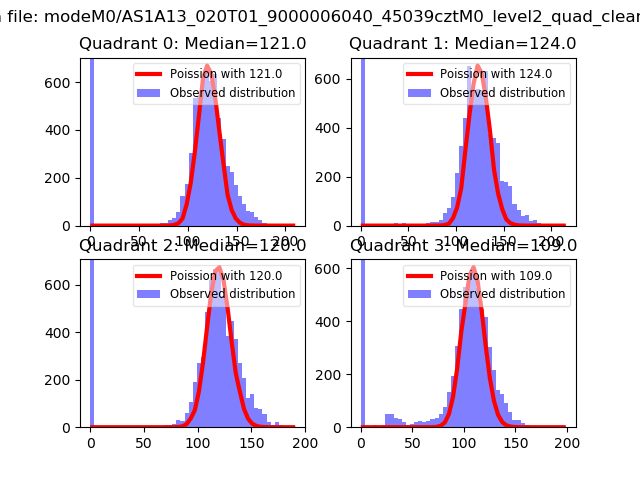 |
 |
| Quadrant-wise count rates Data is divided into 100 sec bins |
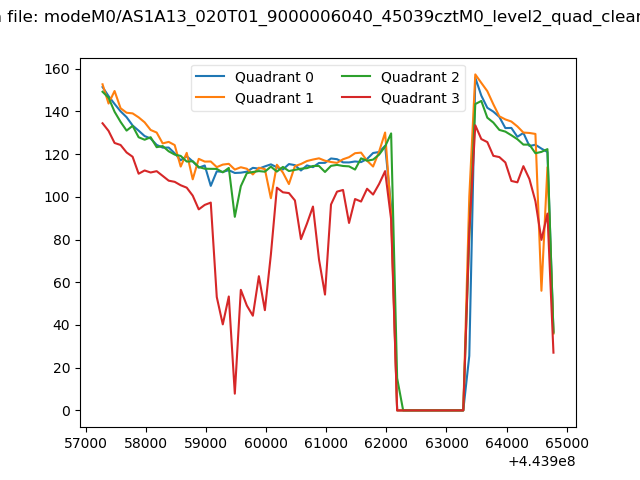 |
|
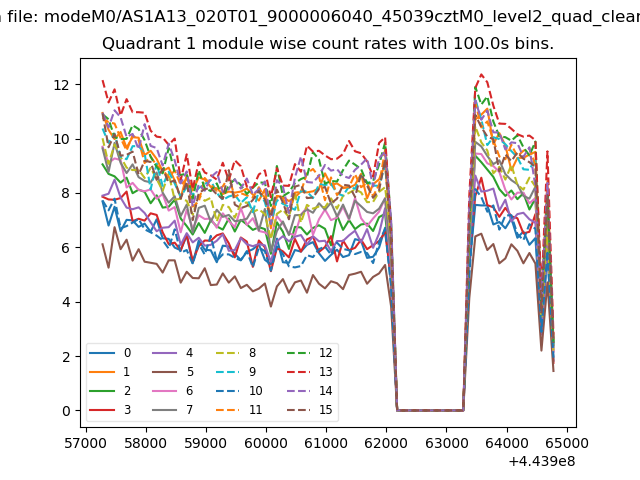
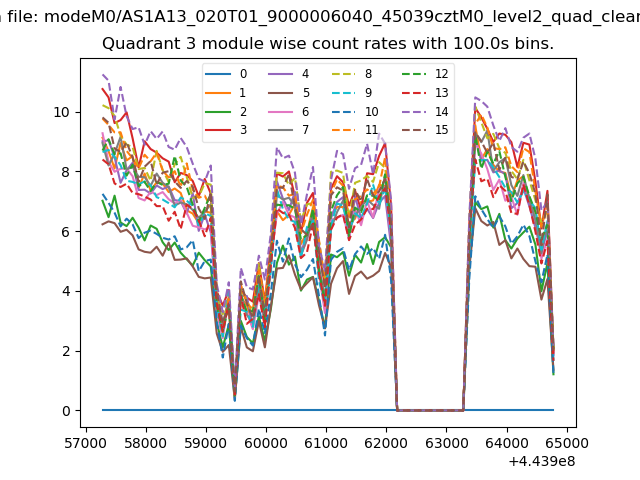
| Module-wise count rates for Quadrant A Data is divided into 100 sec bins |
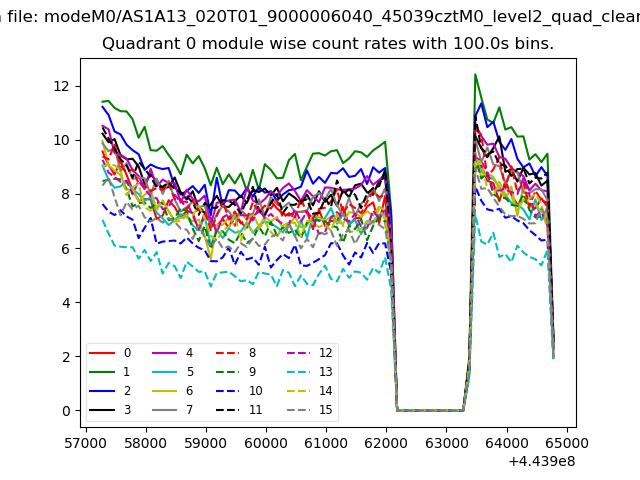 |
 |
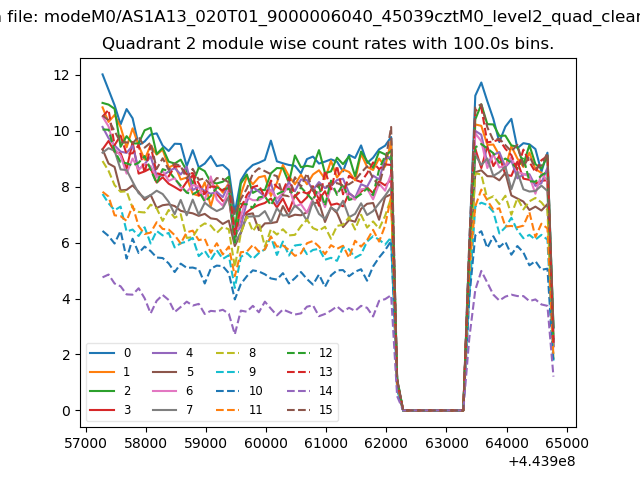
| Module-wise count rates for Quadrant B Data is divided into 100 sec bins |
 |
 |
| Module-wise count rates for Quadrant C Data is divided into 100 sec bins |
 |
 |
| Module-wise count rates for Quadrant D Data is divided into 100 sec bins |
 |
 |
| Parameter | Plot |
|---|---|
| CZT HV Monitor | 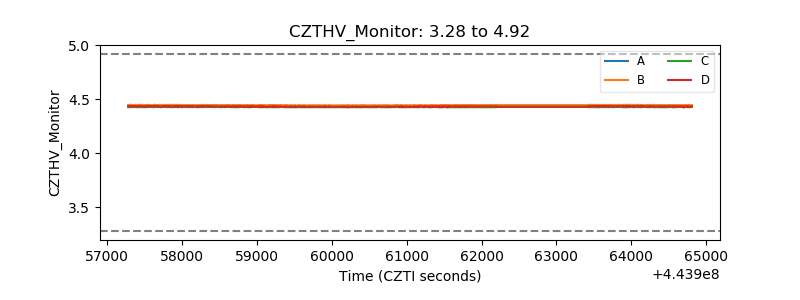 |
| D_VDD | 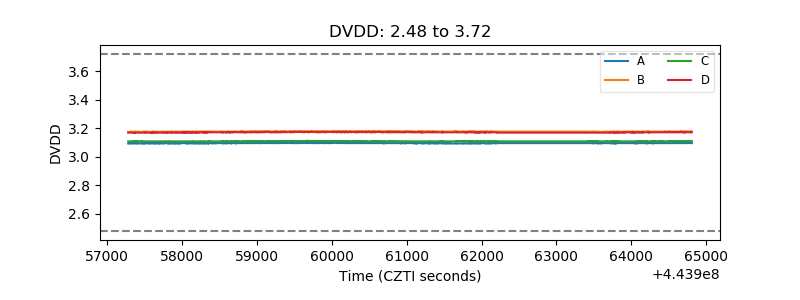 |
| Temperature 1 | 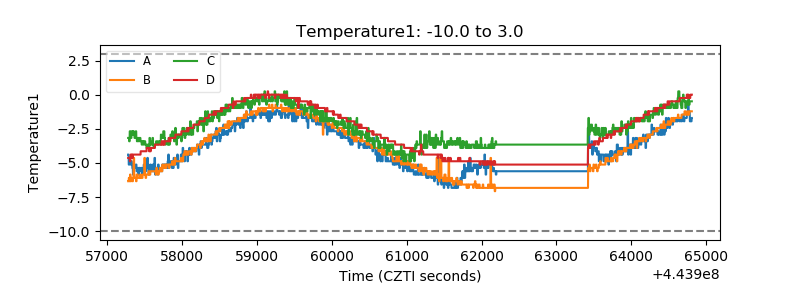 |
| Veto HV Monitor | 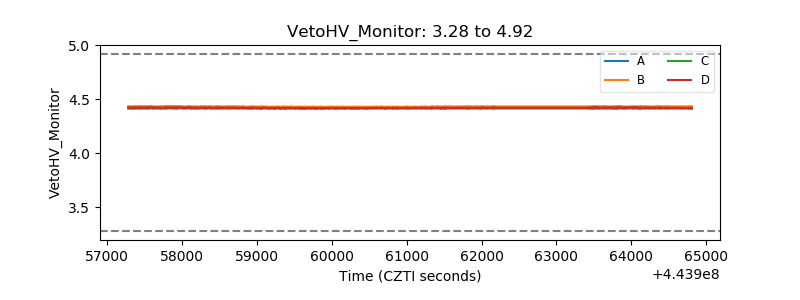 |
| Veto LLD | 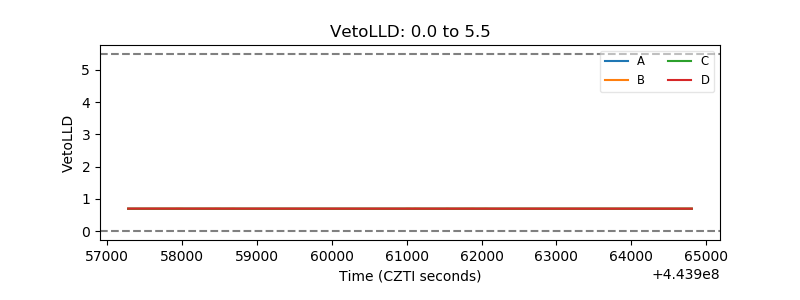 |
| Alpha Counter | 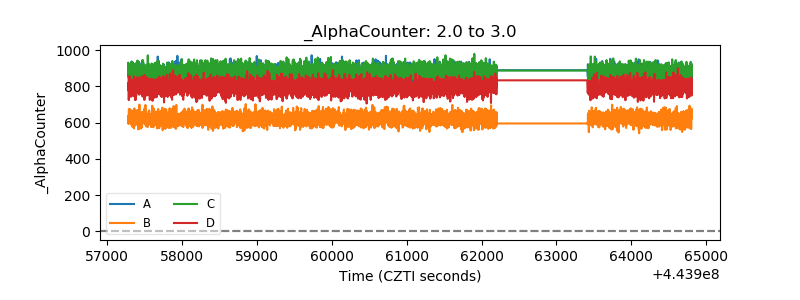 |
| _CPM_Rate | 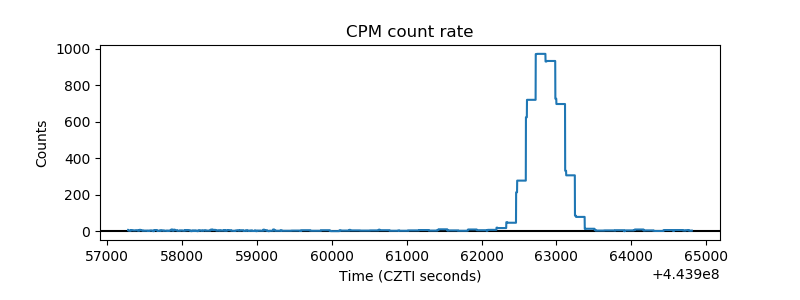 |
| CZT Counter | 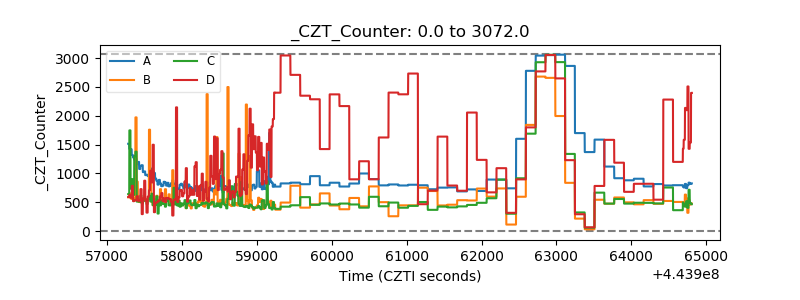 |
| +2.5 Volts monitor | 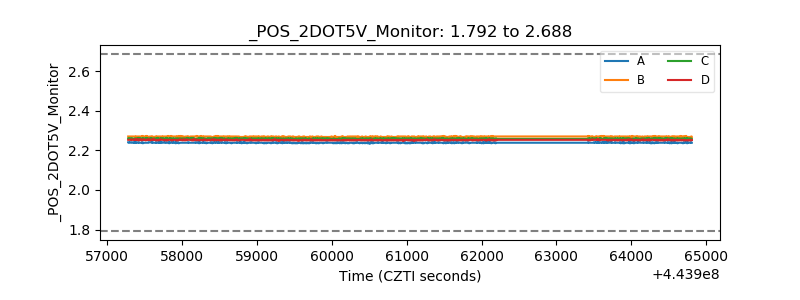 |
| +5 Volts monitor | 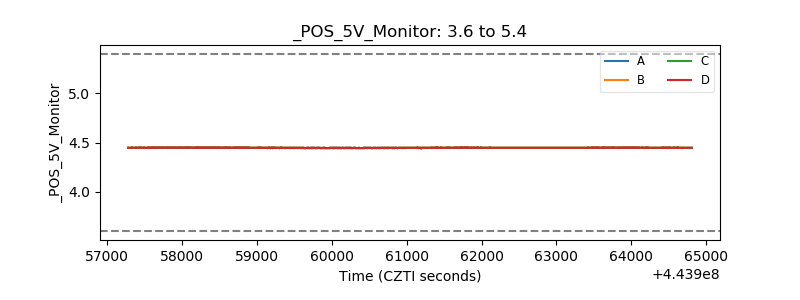 |
| _ROLL_ROT | 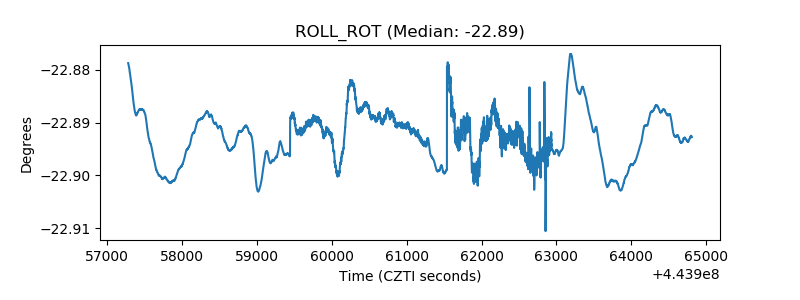 |
| _Roll_DEC | 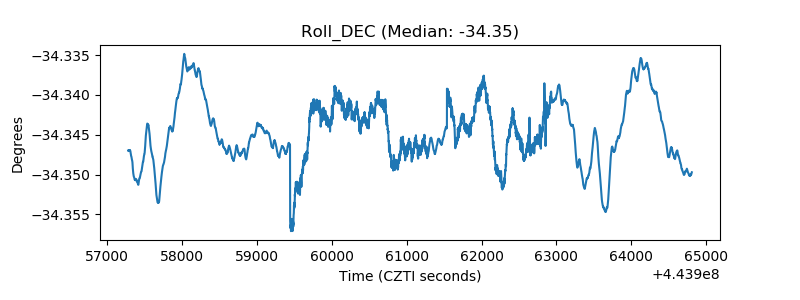 |
| _Roll_RA | 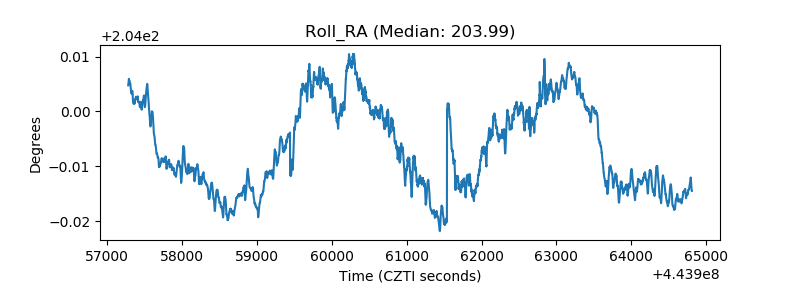 |
| Veto Counter | 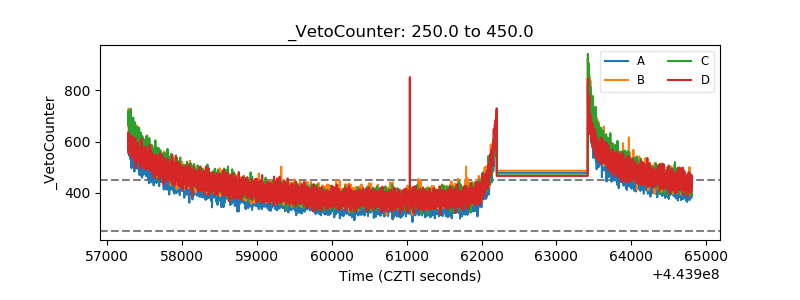 |