| Param | Original file | Final file |
|---|---|---|
| Filename | modeM0/AS1A13_020T01_9000006040_45040cztM0_level2.fits | modeM0/AS1A13_020T01_9000006040_45040cztM0_level2_quad_clean.evt |
| Size (bytes) | 650,842,560 | 111,749,760 |
| Size | 620.7 MB | 106.6 MB |
| Events in quadrant A | 5,680,282 | 779,926 |
| Events in quadrant B | 3,916,399 | 793,323 |
| Events in quadrant C | 3,594,557 | 778,369 |
| Events in quadrant D | 10,386,968 | 568,688 |
| Mode SS | |||
|---|---|---|---|
| Quadrant | BADHDUFLAG | Total packets | Discarded packets |
| A | 0 | 136 | 0 |
| B | 0 | 136 | 0 |
| C | 0 | 136 | 0 |
| D | 0 | 136 | 0 |
| Mode M9 | |||
|---|---|---|---|
| Quadrant | BADHDUFLAG | Total packets | Discarded packets |
| A | 0 | 11 | 0 |
| B | 0 | 11 | 0 |
| C | 0 | 11 | 0 |
| D | 0 | 11 | 0 |
| Mode M0 | |||
|---|---|---|---|
| Quadrant | BADHDUFLAG | Total packets | Discarded packets |
| A | 0 | 21063 | 1 |
| B | 0 | 15815 | 1 |
| C | 0 | 14951 | 1 |
| D | 0 | 35470 | 1 |
| Quadrant | Total seconds | Saturated seconds | Saturation percentage |
|---|---|---|---|
| A | 6641 | 214 | 3.222406% |
| B | 6641 | 307 | 4.622798% |
| C | 6641 | 155 | 2.333986% |
| D | 6641 | 1837 | 27.661497% |
Noise dominated data is calculated using 1-second bins in cleaned event files. If a bin has >2000 counts, and if more than 50% of those come from <1% of pixels, then it is considered to be noise-dominated and hence unusable.
| Quadrant | # 1 sec bins | Bins with >0 counts | Bins with >2000 counts | High rate bins dominated by noise | Noise dominated (total time) | Noise dominated (detector-on time) | Marked lightcurve |
|---|---|---|---|---|---|---|---|
| A | 7781 | 6642 | 6 | 6 | 0.08% | 0.09% | 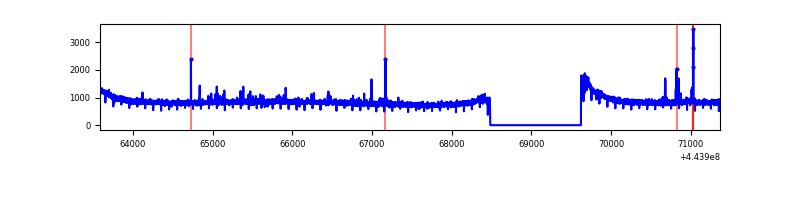 |
| B | 7781 | 6642 | 113 | 113 | 1.45% | 1.70% | 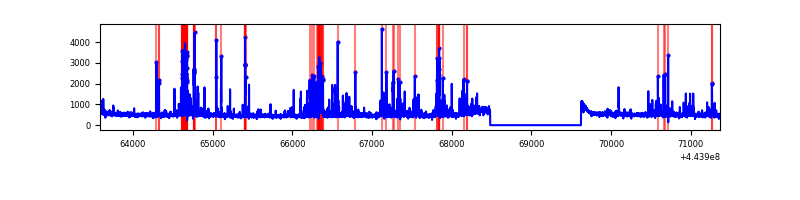 |
| C | 7781 | 6642 | 63 | 63 | 0.81% | 0.95% | 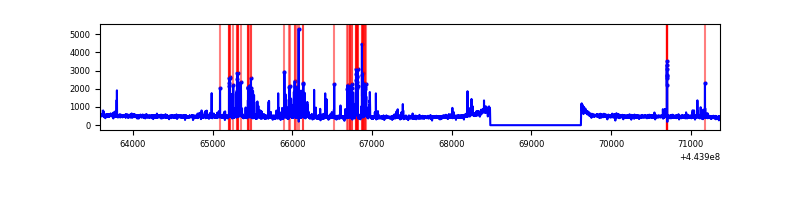 |
| D | 7781 | 6642 | 1546 | 1546 | 19.87% | 23.28% | 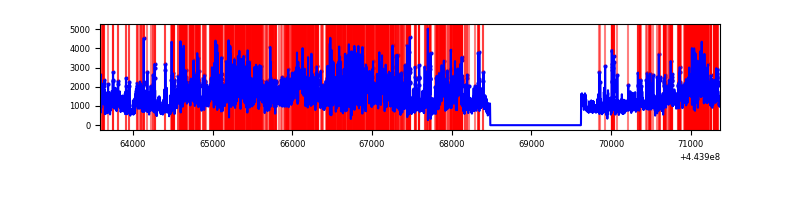 |
Top three noisy pixels from each quadrant. If the there are fewer than three noisy pixels in the level2.evt file, extra rows are filled as -1
| Pixel properties | Quadrant properties | ||||||
|---|---|---|---|---|---|---|---|
| Quadrant | DetID | PixID | Counts | Sigma | Mean | Median | Sigma |
| A | 10 | 83 | 2498176 | 14946.98 | 804 | 786 | 167.1 |
| A | 13 | 248 | 35298 | 206.56 | 804 | 786 | 167.1 |
| A | 0 | 243 | 22298 | 128.75 | 804 | 786 | 167.1 |
| B | 0 | 189 | 383495 | 2498.44 | 793 | 771 | 153.2 |
| B | 5 | 255 | 125230 | 812.48 | 793 | 771 | 153.2 |
| B | 5 | 32 | 105106 | 681.1 | 793 | 771 | 153.2 |
| C | 14 | 254 | 411480 | 2218.47 | 792 | 797 | 185.1 |
| C | 12 | 2 | 65308 | 348.48 | 792 | 797 | 185.1 |
| C | 3 | 233 | 16374 | 84.15 | 792 | 797 | 185.1 |
| D | 13 | 174 | 3220472 | 17625.63 | 730 | 709 | 182.7 |
| D | 13 | 249 | 1373293 | 7513.8 | 730 | 709 | 182.7 |
| D | 11 | 241 | 882712 | 4828.26 | 730 | 709 | 182.7 |
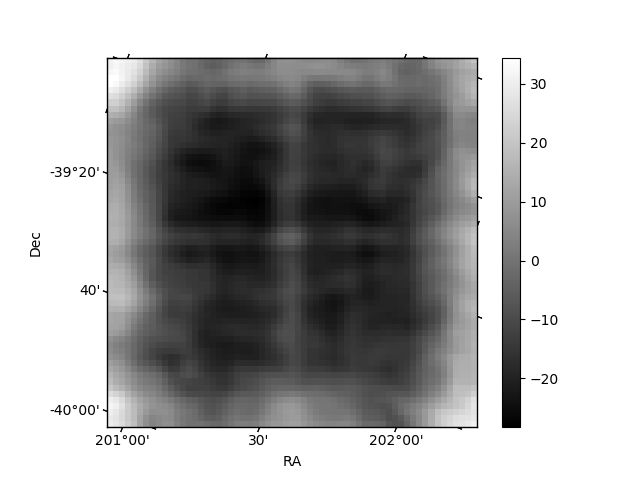
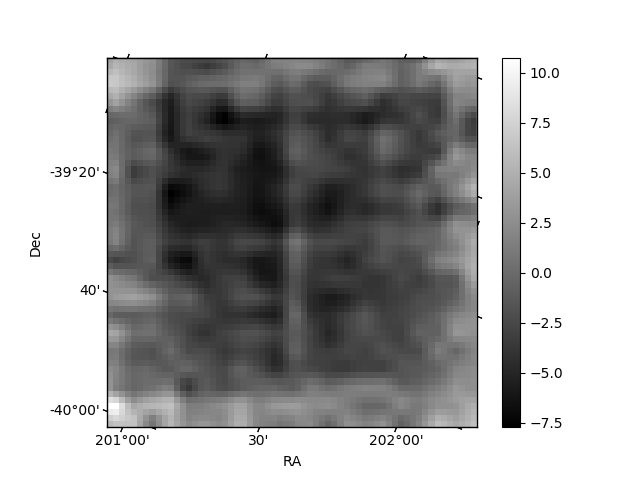
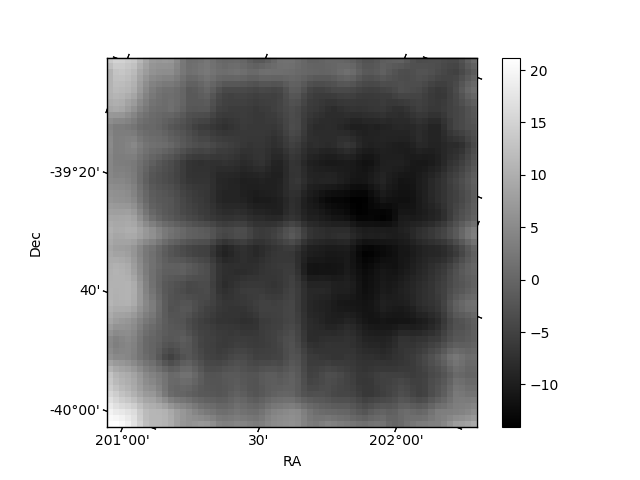
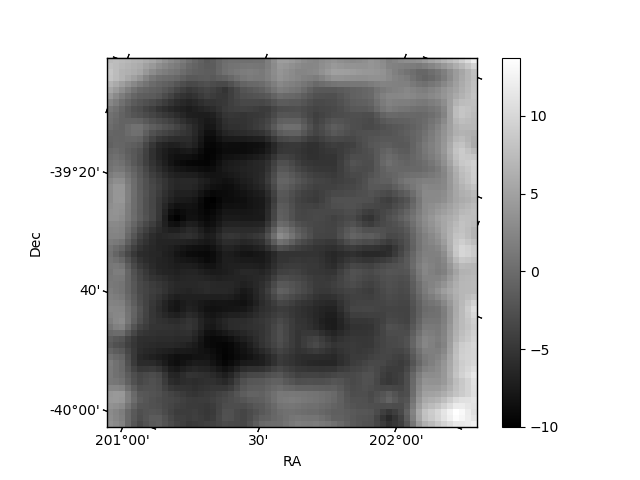
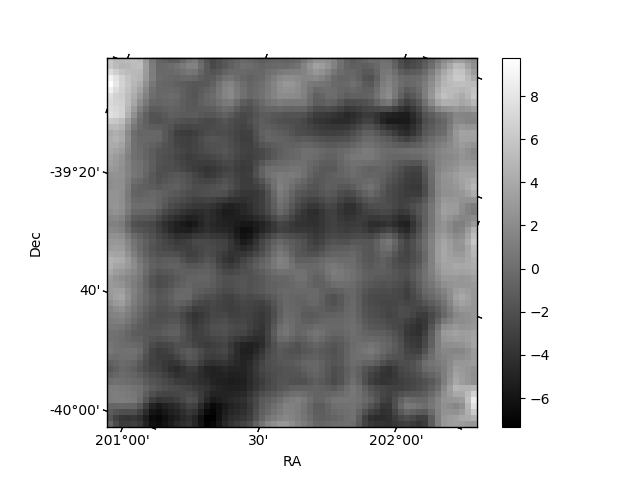
Histogram calculated using DETX and DETY for each event in the final _common_clean file
| Quadrant A | 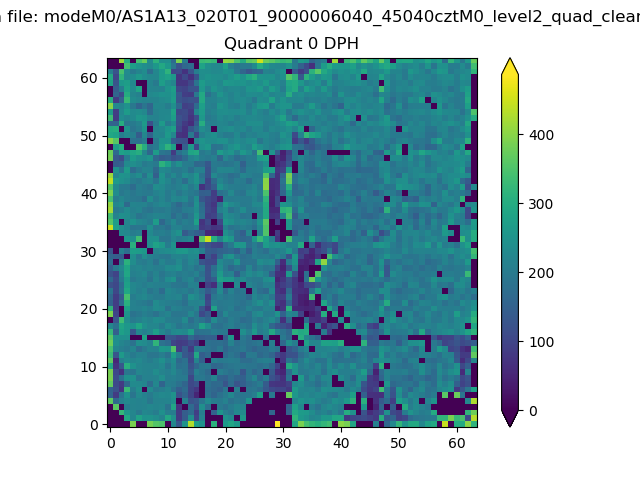 |
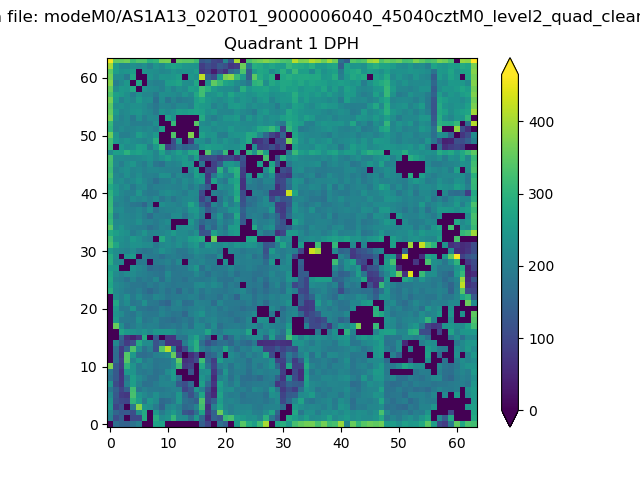 |
Quadrant B |
|---|---|---|---|
| Quadrant D | 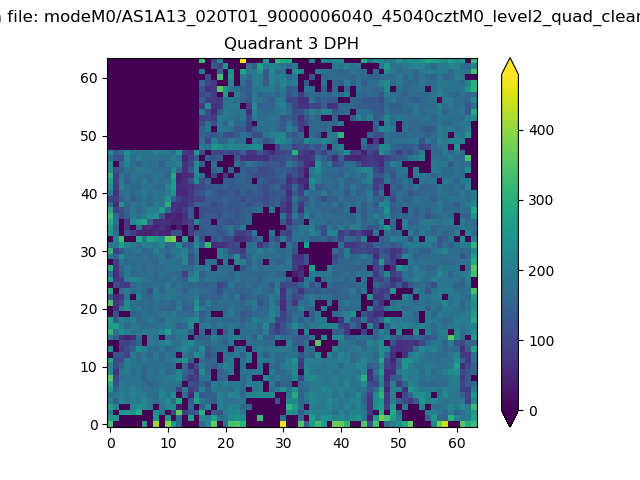 |
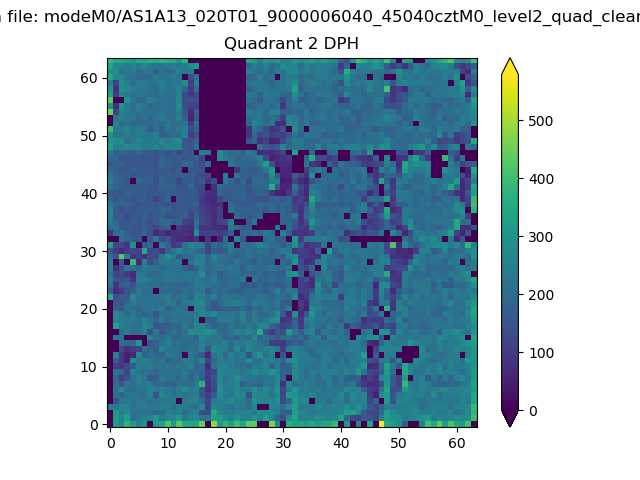 |
Quadrant C |
| Plot type | Count rate plots | Images |
|---|---|---|
| Comparison with Poisson distribution Blue bars denote a histogram of data divided into 1 sec bins. Red curve is a Poisson curve with rate = median count rate of data. |
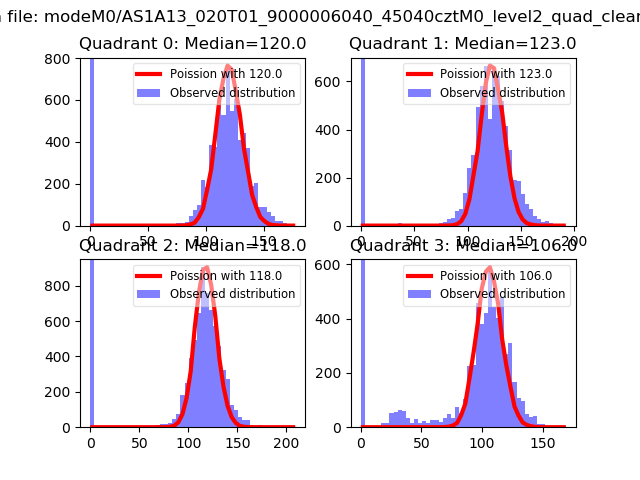 |
 |
| Quadrant-wise count rates Data is divided into 100 sec bins |
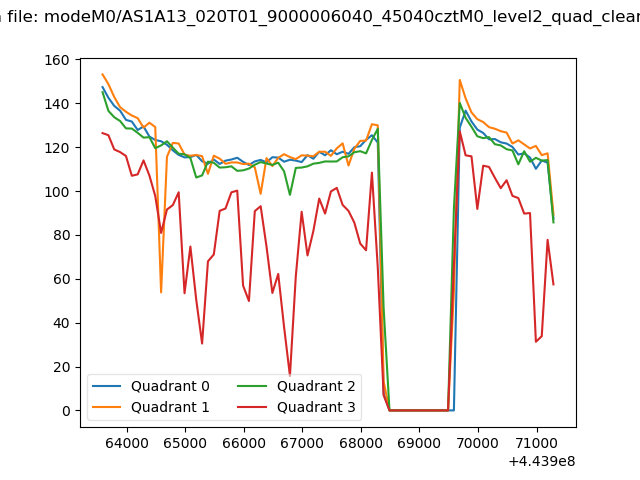 |
|
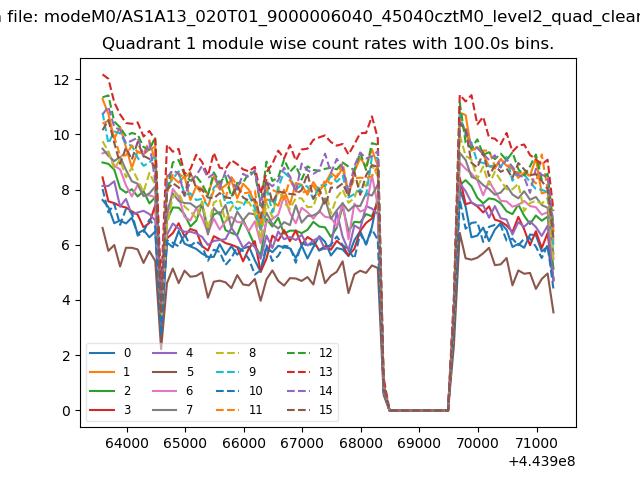
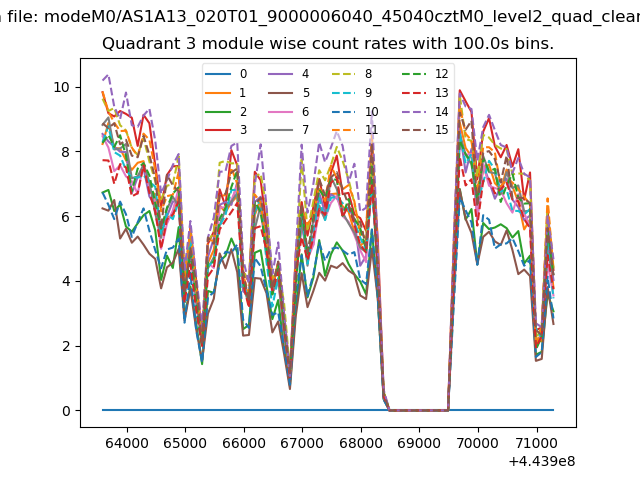
| Module-wise count rates for Quadrant A Data is divided into 100 sec bins |
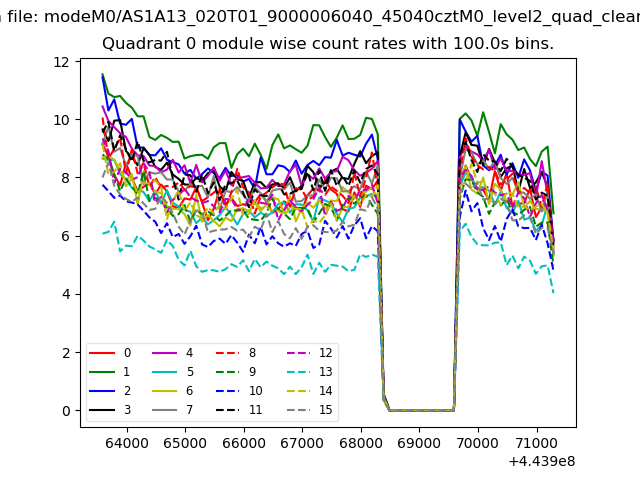 |
 |
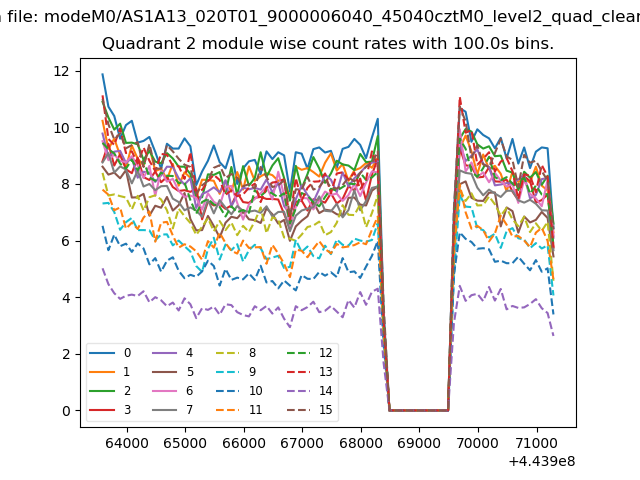
| Module-wise count rates for Quadrant B Data is divided into 100 sec bins |
 |
 |
| Module-wise count rates for Quadrant C Data is divided into 100 sec bins |
 |
 |
| Module-wise count rates for Quadrant D Data is divided into 100 sec bins |
 |
 |
| Parameter | Plot |
|---|---|
| CZT HV Monitor |  |
| D_VDD | 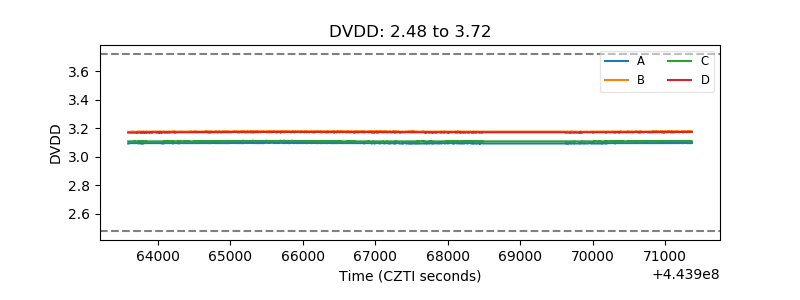 |
| Temperature 1 | 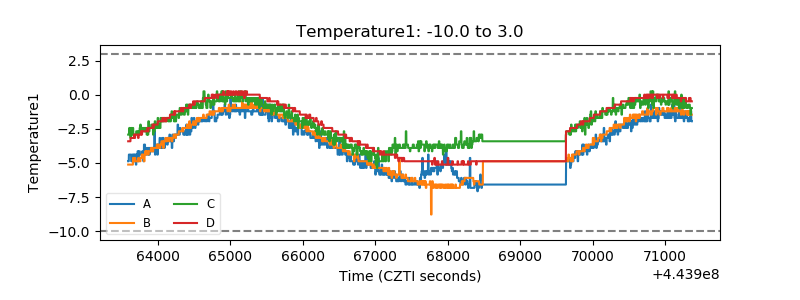 |
| Veto HV Monitor | 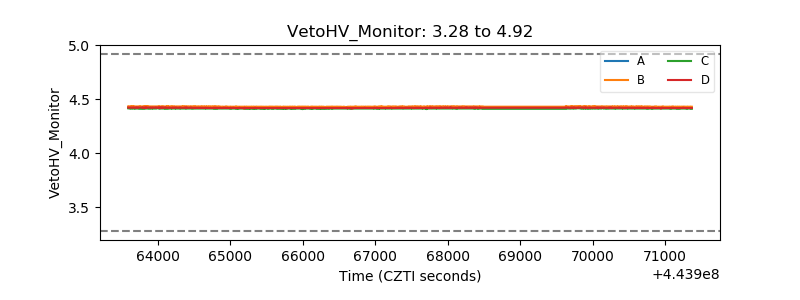 |
| Veto LLD | 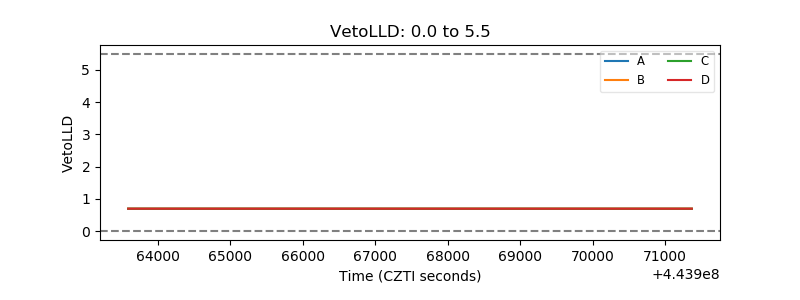 |
| Alpha Counter | 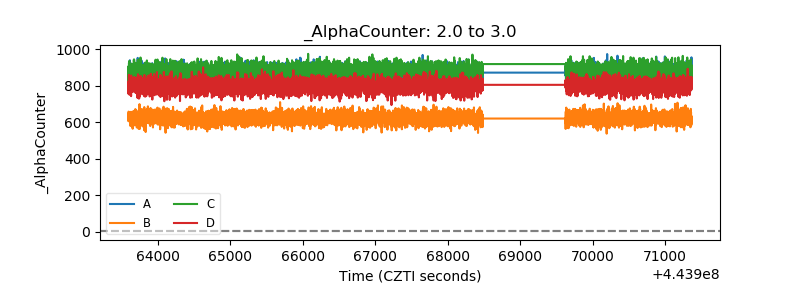 |
| _CPM_Rate | 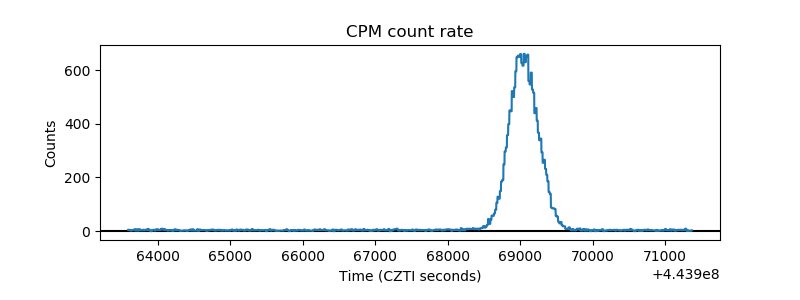 |
| CZT Counter | 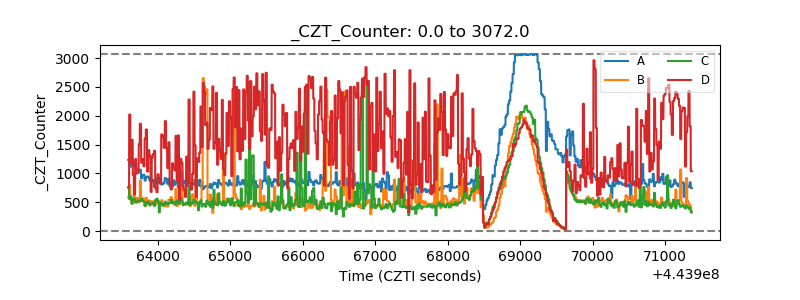 |
| +2.5 Volts monitor | 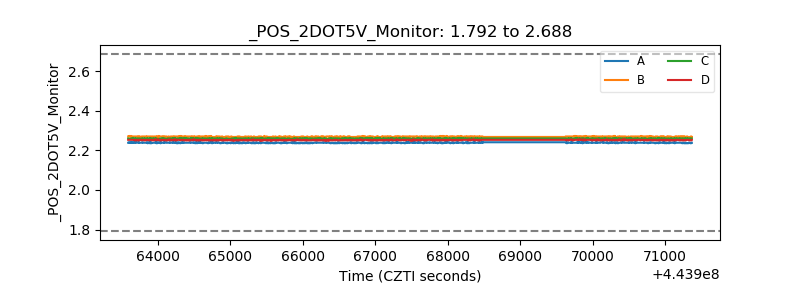 |
| +5 Volts monitor | 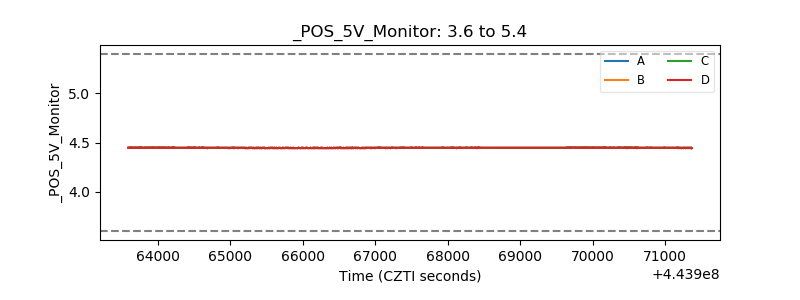 |
| _ROLL_ROT | 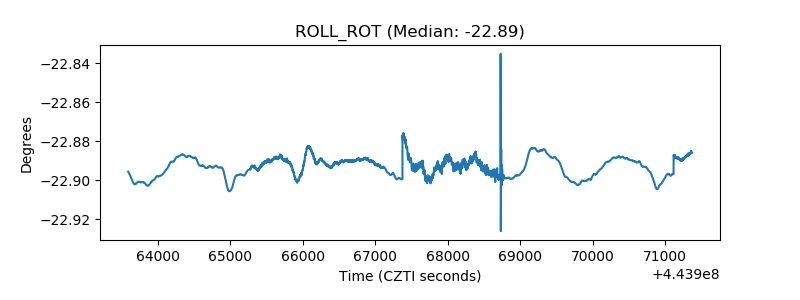 |
| _Roll_DEC | 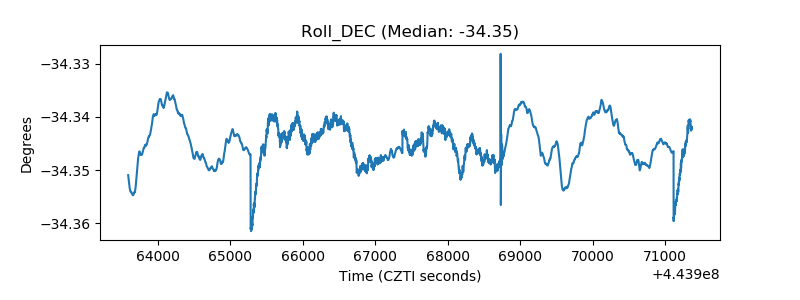 |
| _Roll_RA | 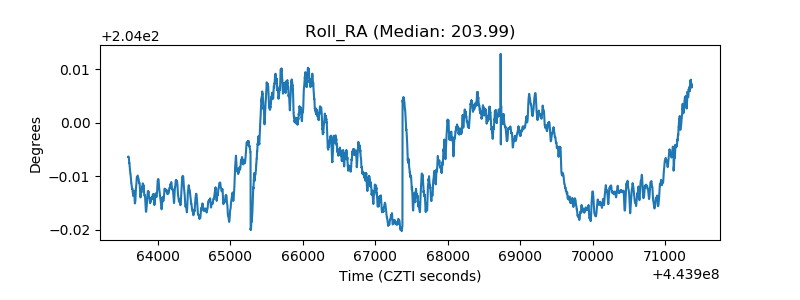 |
| Veto Counter | 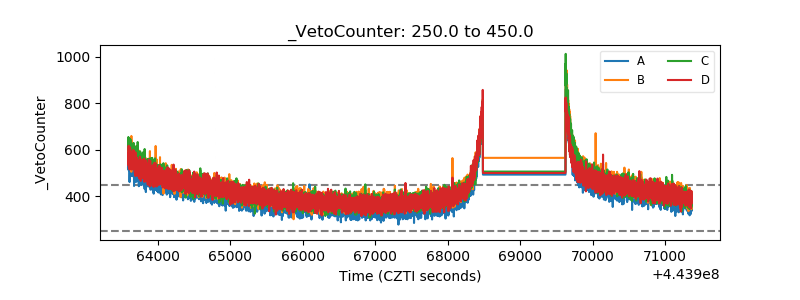 |