| Param | Original file | Final file |
|---|---|---|
| Filename | modeM0/AS1A13_020T01_9000006040_45041cztM0_level2.fits | modeM0/AS1A13_020T01_9000006040_45041cztM0_level2_quad_clean.evt |
| Size (bytes) | 624,867,840 | 112,360,320 |
| Size | 595.9 MB | 107.2 MB |
| Events in quadrant A | 5,782,994 | 767,700 |
| Events in quadrant B | 4,005,653 | 789,127 |
| Events in quadrant C | 3,494,599 | 773,725 |
| Events in quadrant D | 9,317,158 | 593,980 |
| Mode SS | |||
|---|---|---|---|
| Quadrant | BADHDUFLAG | Total packets | Discarded packets |
| A | 0 | 140 | 0 |
| B | 0 | 140 | 0 |
| C | 0 | 140 | 0 |
| D | 0 | 140 | 0 |
| Mode M9 | |||
|---|---|---|---|
| Quadrant | BADHDUFLAG | Total packets | Discarded packets |
| A | 0 | 10 | 0 |
| B | 0 | 10 | 0 |
| C | 0 | 10 | 0 |
| D | 0 | 10 | 0 |
| Mode M0 | |||
|---|---|---|---|
| Quadrant | BADHDUFLAG | Total packets | Discarded packets |
| A | 0 | 21814 | 1 |
| B | 0 | 16295 | 1 |
| C | 0 | 15028 | 1 |
| D | 0 | 32530 | 3 |
| Quadrant | Total seconds | Saturated seconds | Saturation percentage |
|---|---|---|---|
| A | 6850 | 241 | 3.518248% |
| B | 6850 | 274 | 4.000000% |
| C | 6850 | 171 | 2.496350% |
| D | 6849 | 1421 | 20.747554% |
Noise dominated data is calculated using 1-second bins in cleaned event files. If a bin has >2000 counts, and if more than 50% of those come from <1% of pixels, then it is considered to be noise-dominated and hence unusable.
| Quadrant | # 1 sec bins | Bins with >0 counts | Bins with >2000 counts | High rate bins dominated by noise | Noise dominated (total time) | Noise dominated (detector-on time) | Marked lightcurve |
|---|---|---|---|---|---|---|---|
| A | 7865 | 6851 | 8 | 8 | 0.10% | 0.12% | 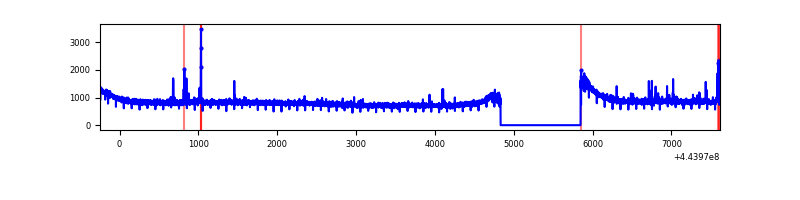 |
| B | 7865 | 6851 | 69 | 69 | 0.88% | 1.01% | 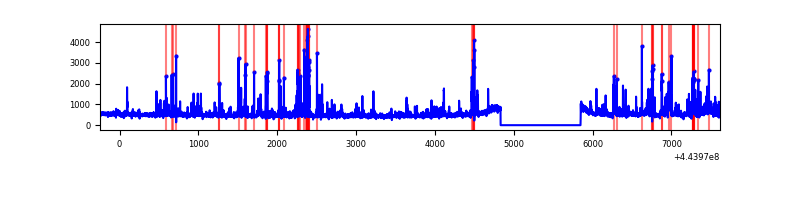 |
| C | 7865 | 6851 | 57 | 57 | 0.72% | 0.83% | 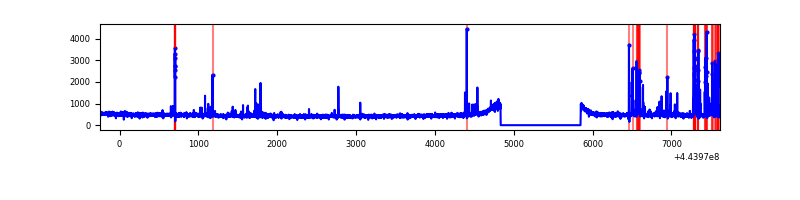 |
| D | 7864 | 6849 | 1211 | 1211 | 15.40% | 17.68% | 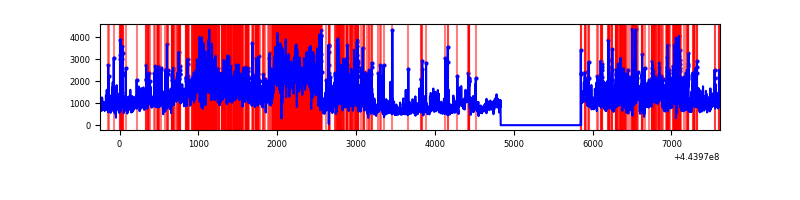 |
Top three noisy pixels from each quadrant. If the there are fewer than three noisy pixels in the level2.evt file, extra rows are filled as -1
| Pixel properties | Quadrant properties | ||||||
|---|---|---|---|---|---|---|---|
| Quadrant | DetID | PixID | Counts | Sigma | Mean | Median | Sigma |
| A | 10 | 83 | 2557315 | 15064.82 | 814 | 796 | 169.7 |
| A | 13 | 248 | 31621 | 181.64 | 814 | 796 | 169.7 |
| A | 10 | 248 | 23017 | 130.94 | 814 | 796 | 169.7 |
| B | 0 | 189 | 373714 | 2358.73 | 810 | 787 | 158.1 |
| B | 12 | 48 | 103836 | 651.78 | 810 | 787 | 158.1 |
| B | 5 | 255 | 83633 | 523.99 | 810 | 787 | 158.1 |
| C | 14 | 254 | 239152 | 1266.61 | 801 | 806 | 188.2 |
| C | 12 | 2 | 88923 | 468.27 | 801 | 806 | 188.2 |
| C | 1 | 3 | 20264 | 103.4 | 801 | 806 | 188.2 |
| D | 13 | 174 | 2242120 | 11809.54 | 758 | 736 | 189.8 |
| D | 13 | 249 | 1162675 | 6122.09 | 758 | 736 | 189.8 |
| D | 11 | 241 | 909279 | 4786.99 | 758 | 736 | 189.8 |
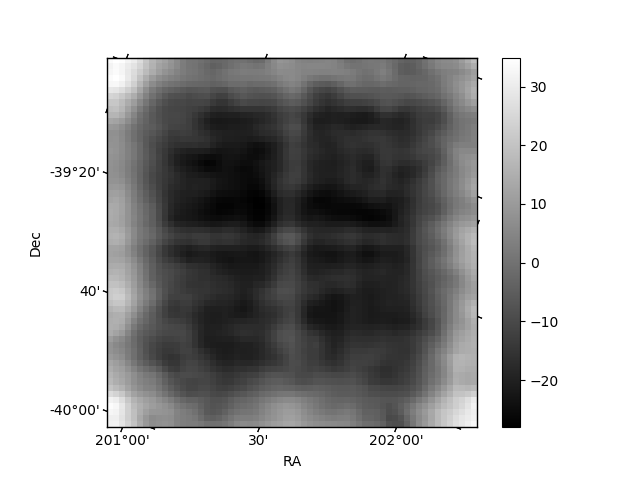
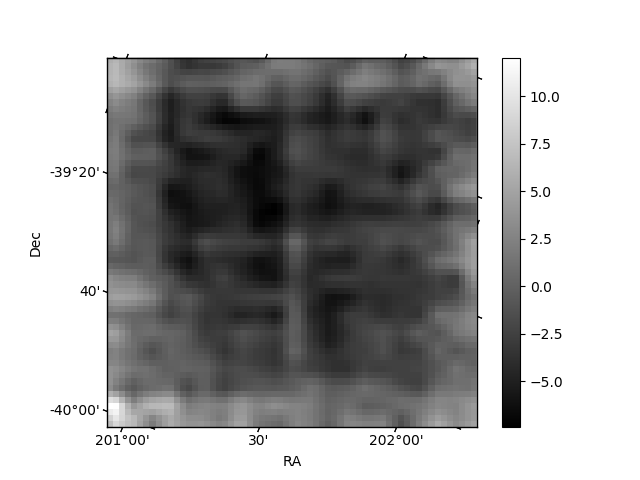
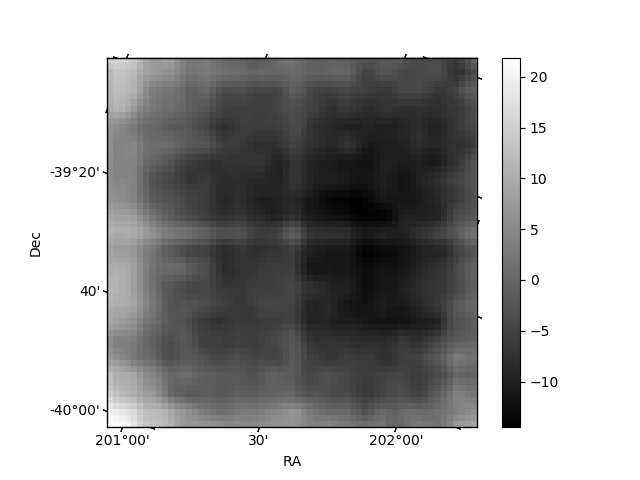
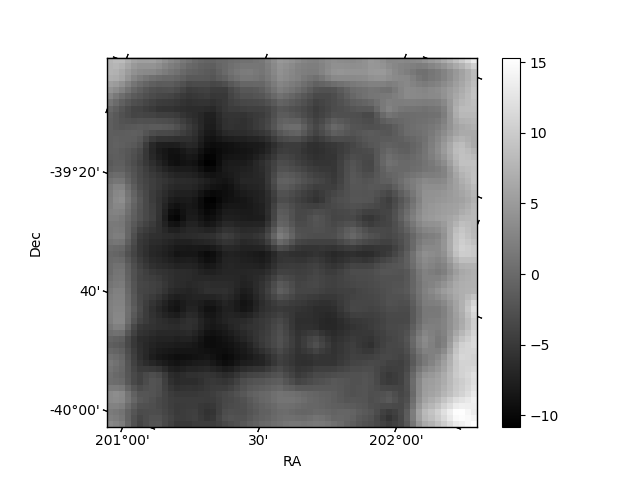
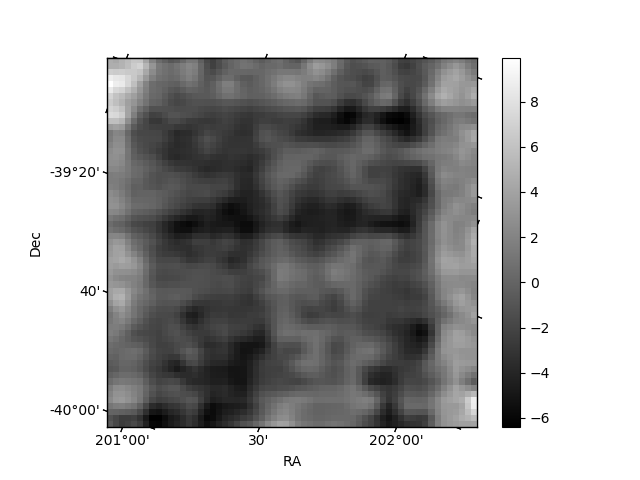
Histogram calculated using DETX and DETY for each event in the final _common_clean file
| Quadrant A | 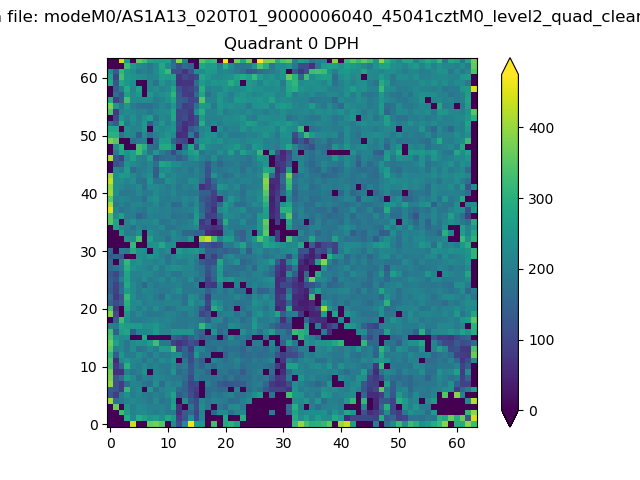 |
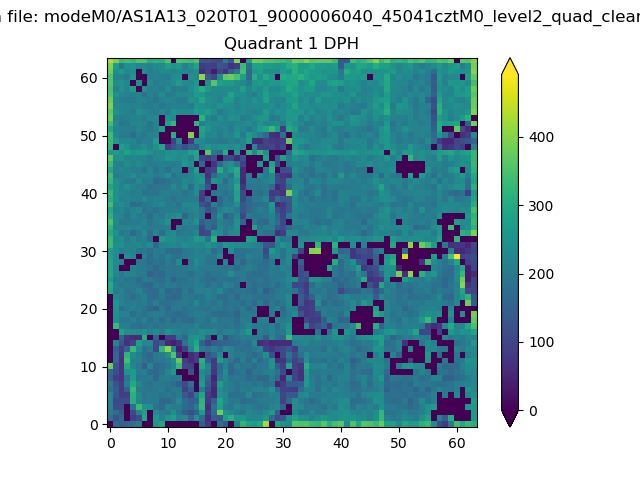 |
Quadrant B |
|---|---|---|---|
| Quadrant D | 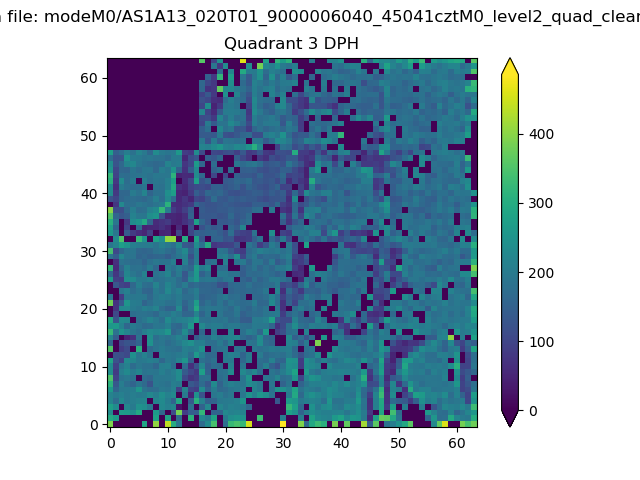 |
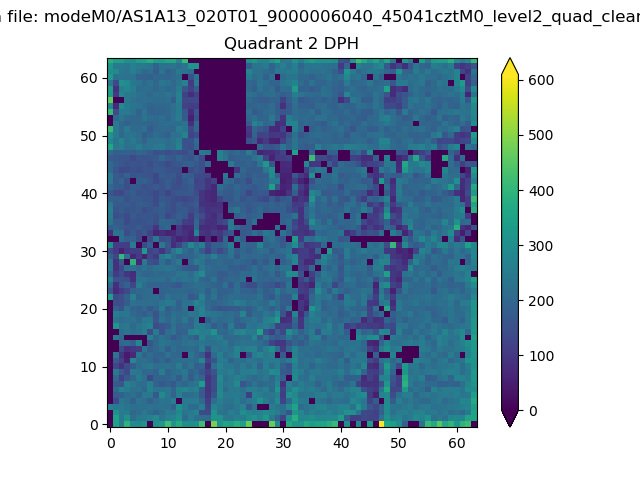 |
Quadrant C |
| Plot type | Count rate plots | Images |
|---|---|---|
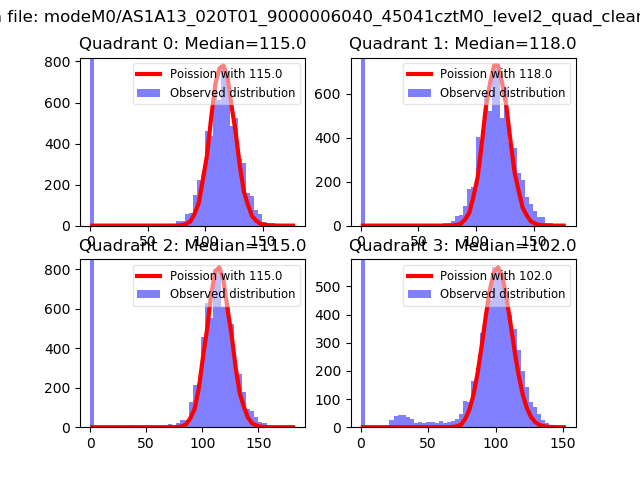
| Comparison with Poisson distribution Blue bars denote a histogram of data divided into 1 sec bins. Red curve is a Poisson curve with rate = median count rate of data. |
 |
 |
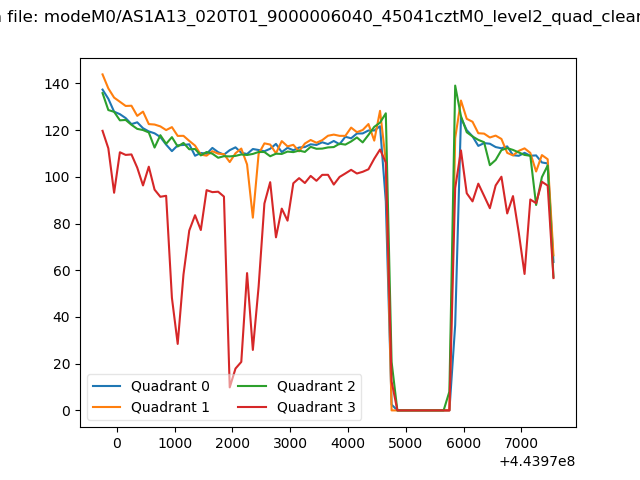
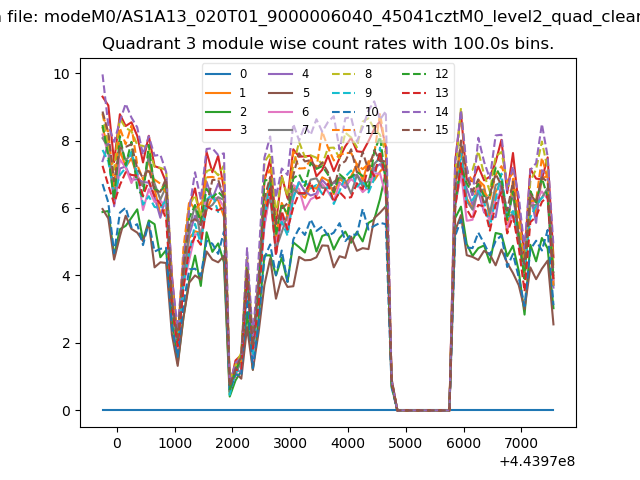
| Quadrant-wise count rates Data is divided into 100 sec bins |
 |
|
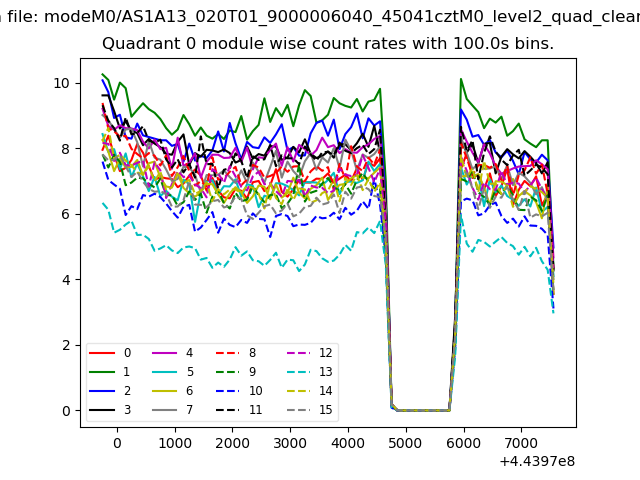
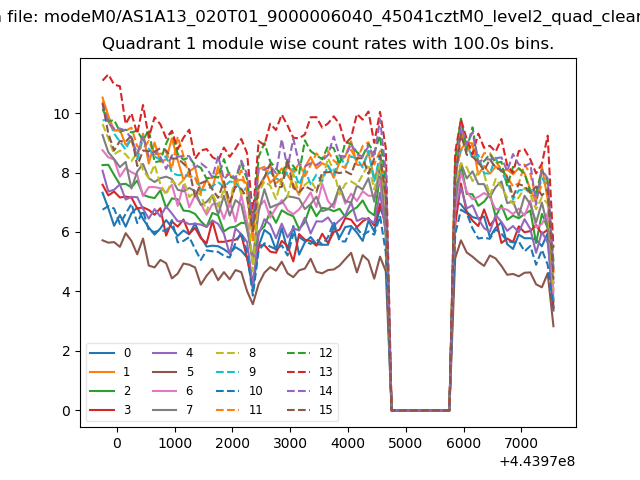
| Module-wise count rates for Quadrant A Data is divided into 100 sec bins |
 |
 |
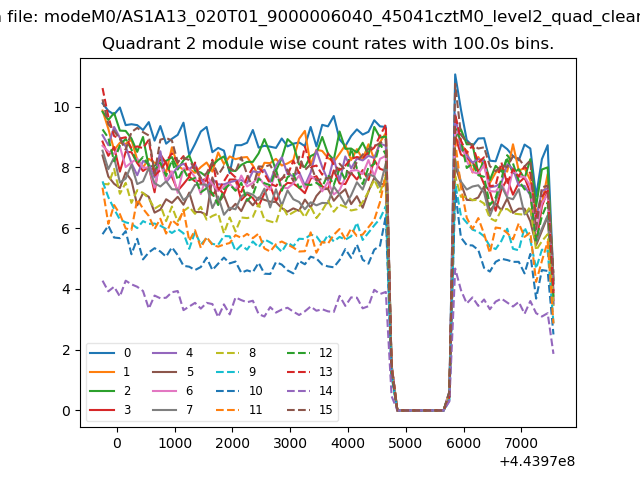
| Module-wise count rates for Quadrant B Data is divided into 100 sec bins |
 |
 |
| Module-wise count rates for Quadrant C Data is divided into 100 sec bins |
 |
 |
| Module-wise count rates for Quadrant D Data is divided into 100 sec bins |
 |
 |
| Parameter | Plot |
|---|---|
| CZT HV Monitor | 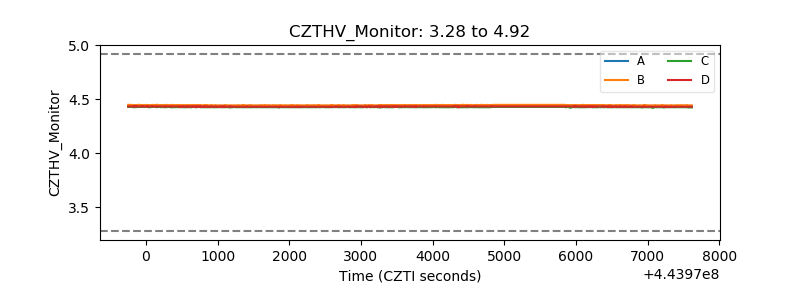 |
| D_VDD | 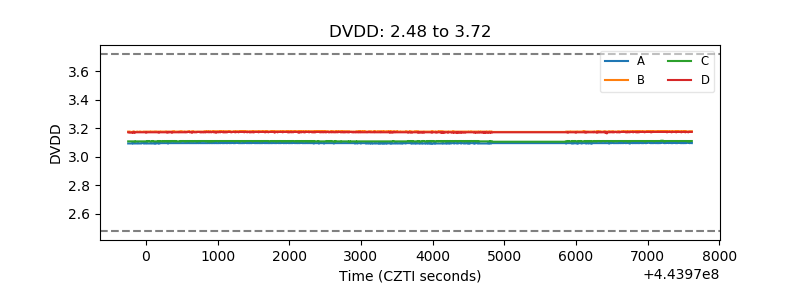 |
| Temperature 1 | 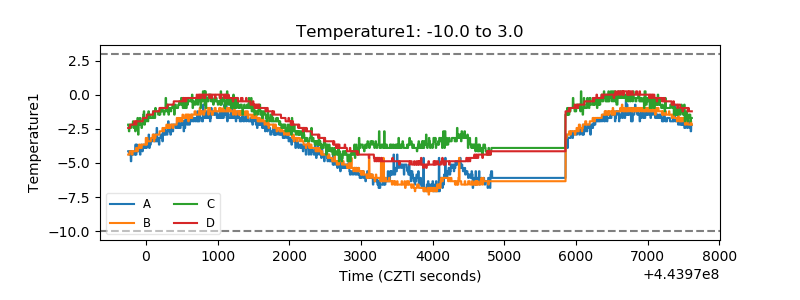 |
| Veto HV Monitor | 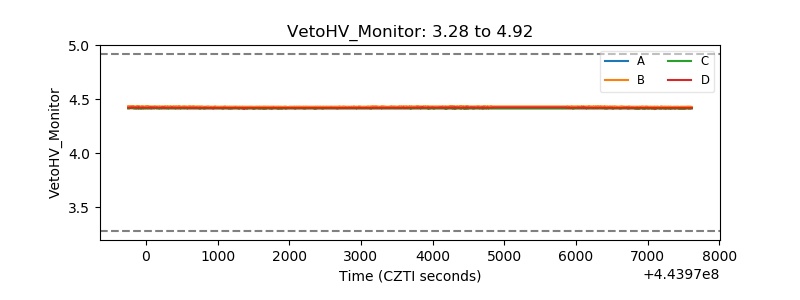 |
| Veto LLD | 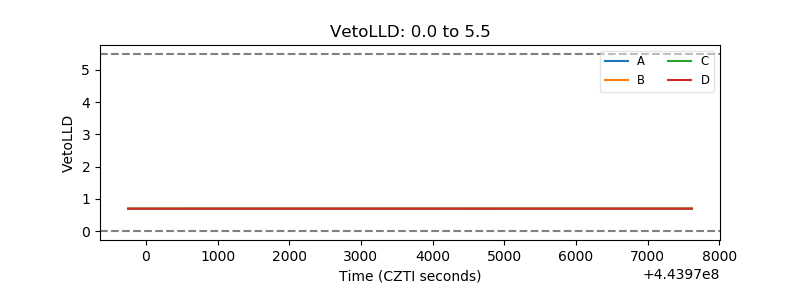 |
| Alpha Counter | 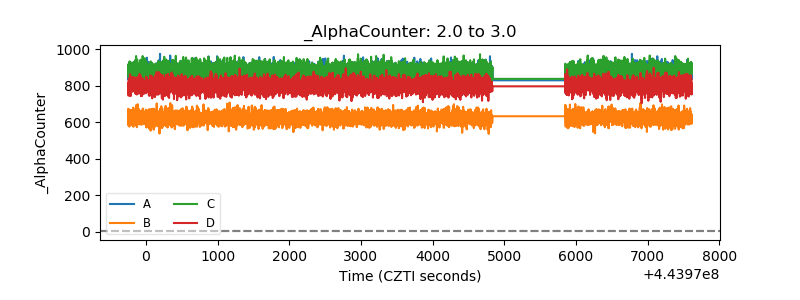 |
| _CPM_Rate | 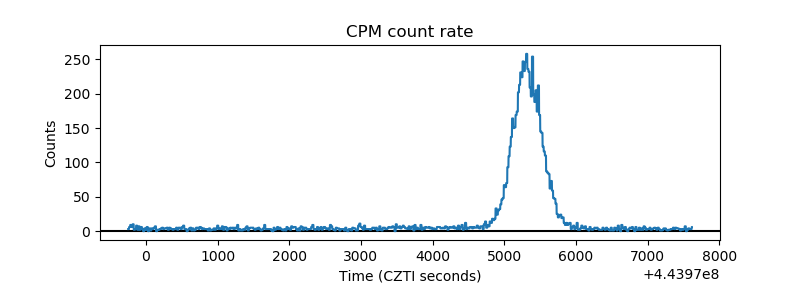 |
| CZT Counter | 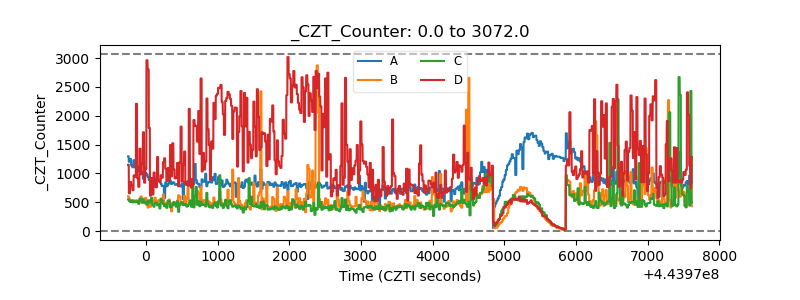 |
| +2.5 Volts monitor | 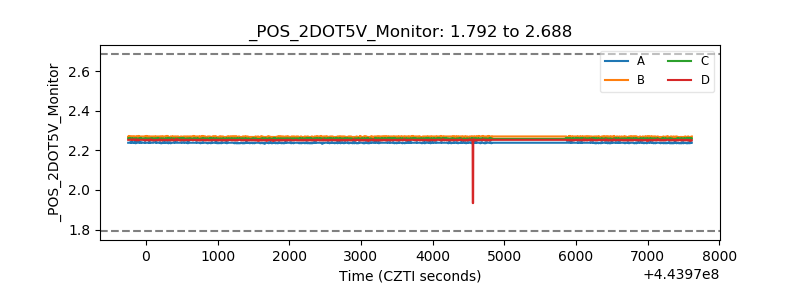 |
| +5 Volts monitor | 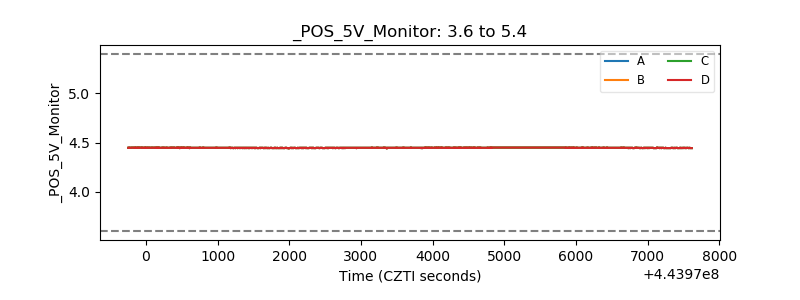 |
| _ROLL_ROT | 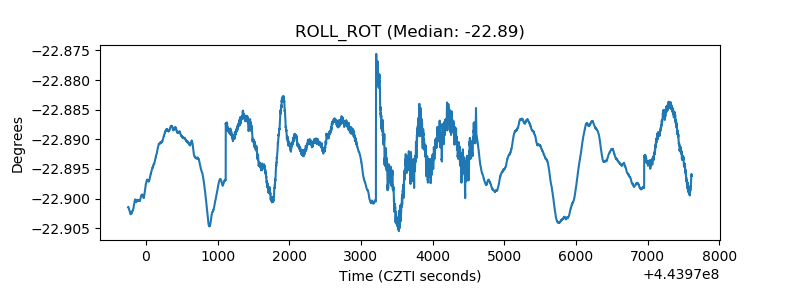 |
| _Roll_DEC | 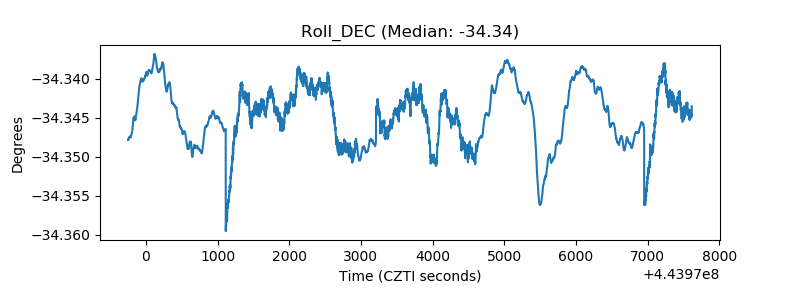 |
| _Roll_RA | 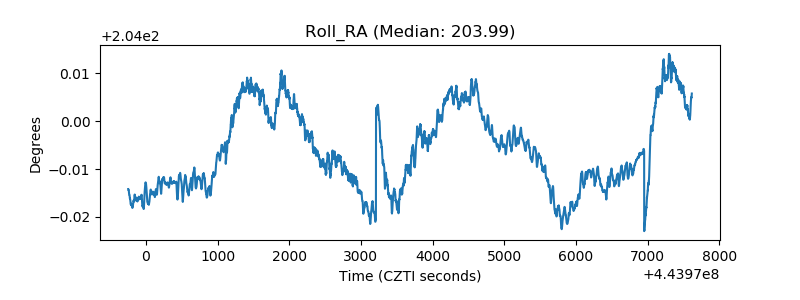 |
| Veto Counter | 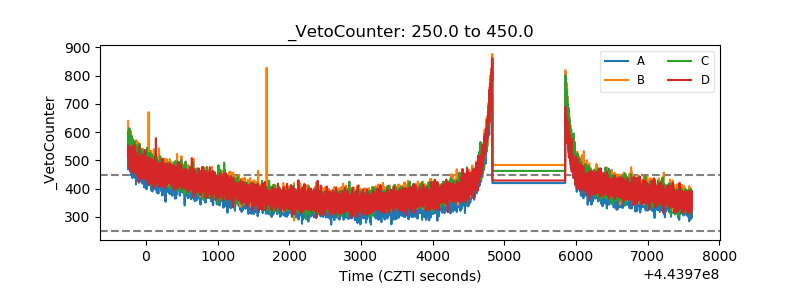 |