| Param | Original file | Final file |
|---|---|---|
| Filename | modeM0/AS1A13_020T01_9000006040_45042cztM0_level2.fits | modeM0/AS1A13_020T01_9000006040_45042cztM0_level2_quad_clean.evt |
| Size (bytes) | 692,297,280 | 108,152,640 |
| Size | 660.2 MB | 103.1 MB |
| Events in quadrant A | 5,741,266 | 751,088 |
| Events in quadrant B | 4,901,713 | 742,070 |
| Events in quadrant C | 4,304,473 | 731,629 |
| Events in quadrant D | 10,141,653 | 565,296 |
| Mode SS | |||
|---|---|---|---|
| Quadrant | BADHDUFLAG | Total packets | Discarded packets |
| A | 0 | 142 | 0 |
| B | 0 | 142 | 0 |
| C | 0 | 142 | 0 |
| D | 0 | 142 | 0 |
| Mode M9 | |||
|---|---|---|---|
| Quadrant | BADHDUFLAG | Total packets | Discarded packets |
| A | 0 | 7 | 0 |
| B | 0 | 7 | 0 |
| C | 0 | 7 | 0 |
| D | 0 | 7 | 0 |
| Mode M0 | |||
|---|---|---|---|
| Quadrant | BADHDUFLAG | Total packets | Discarded packets |
| A | 0 | 21981 | 1 |
| B | 0 | 19182 | 1 |
| C | 0 | 17607 | 1 |
| D | 0 | 35008 | 1 |
| Quadrant | Total seconds | Saturated seconds | Saturation percentage |
|---|---|---|---|
| A | 6948 | 209 | 3.008060% |
| B | 6948 | 498 | 7.167530% |
| C | 6949 | 365 | 5.252554% |
| D | 6949 | 1694 | 24.377608% |
Noise dominated data is calculated using 1-second bins in cleaned event files. If a bin has >2000 counts, and if more than 50% of those come from <1% of pixels, then it is considered to be noise-dominated and hence unusable.
| Quadrant | # 1 sec bins | Bins with >0 counts | Bins with >2000 counts | High rate bins dominated by noise | Noise dominated (total time) | Noise dominated (detector-on time) | Marked lightcurve |
|---|---|---|---|---|---|---|---|
| A | 7708 | 6949 | 7 | 7 | 0.09% | 0.10% | 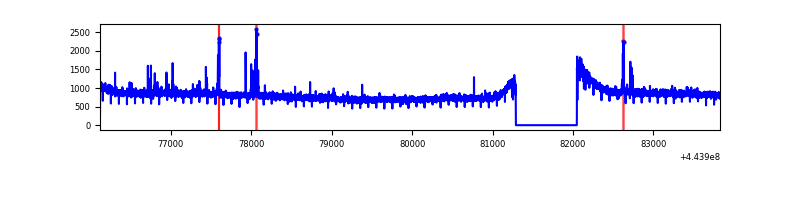 |
| B | 7708 | 6949 | 246 | 246 | 3.19% | 3.54% | 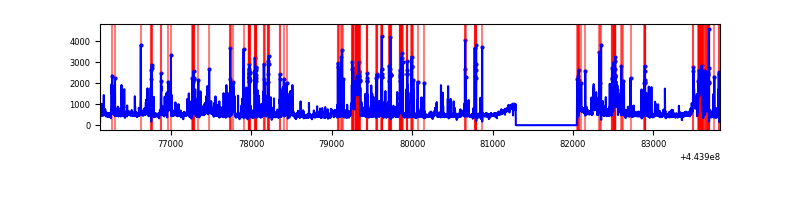 |
| C | 7709 | 6950 | 252 | 252 | 3.27% | 3.63% | 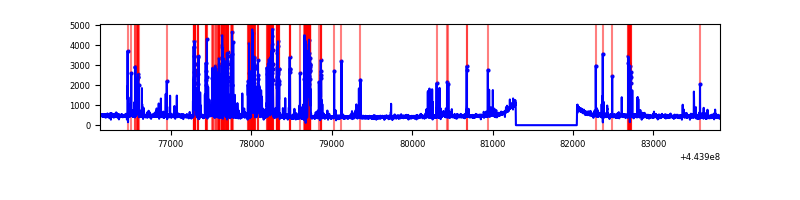 |
| D | 7709 | 6950 | 1327 | 1327 | 17.21% | 19.09% | 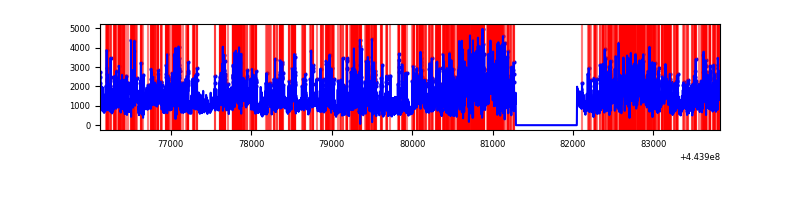 |
Top three noisy pixels from each quadrant. If the there are fewer than three noisy pixels in the level2.evt file, extra rows are filled as -1
| Pixel properties | Quadrant properties | ||||||
|---|---|---|---|---|---|---|---|
| Quadrant | DetID | PixID | Counts | Sigma | Mean | Median | Sigma |
| A | 10 | 83 | 2550046 | 15205.94 | 800 | 782 | 167.6 |
| A | 10 | 248 | 52366 | 307.69 | 800 | 782 | 167.6 |
| A | 13 | 248 | 27233 | 157.78 | 800 | 782 | 167.6 |
| B | 0 | 189 | 1203582 | 7738.11 | 787 | 763 | 155.4 |
| B | 12 | 48 | 136794 | 875.13 | 787 | 763 | 155.4 |
| B | 5 | 255 | 115065 | 735.34 | 787 | 763 | 155.4 |
| C | 14 | 254 | 1172858 | 6392.12 | 774 | 778 | 183.4 |
| C | 12 | 2 | 77067 | 416.05 | 774 | 778 | 183.4 |
| C | 1 | 3 | 22949 | 120.91 | 774 | 778 | 183.4 |
| D | 13 | 174 | 2708839 | 15018.33 | 720 | 699 | 180.3 |
| D | 5 | 235 | 1086890 | 6023.61 | 720 | 699 | 180.3 |
| D | 11 | 241 | 623681 | 3454.82 | 720 | 699 | 180.3 |
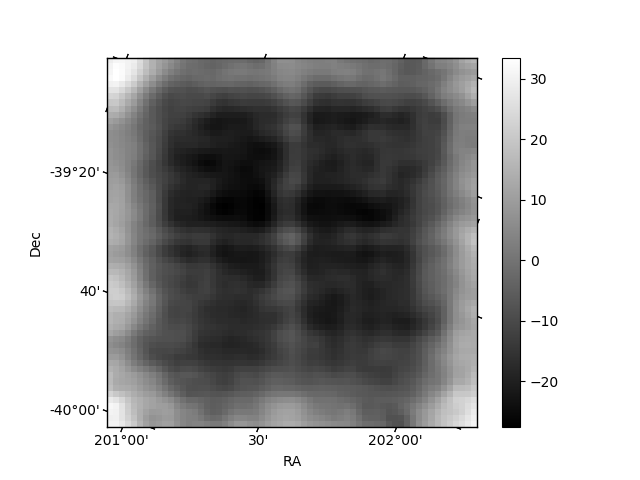
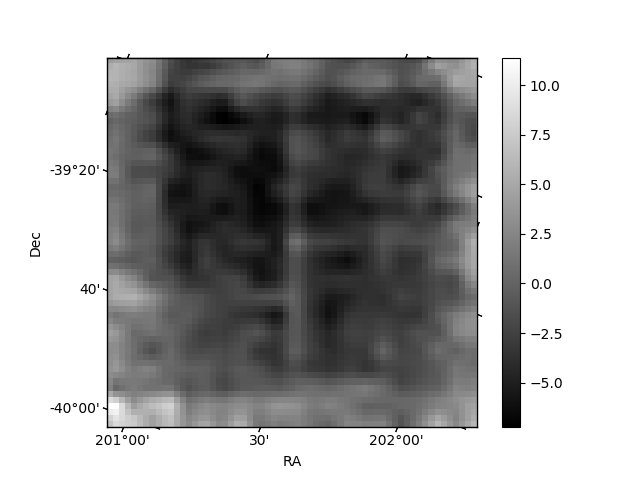
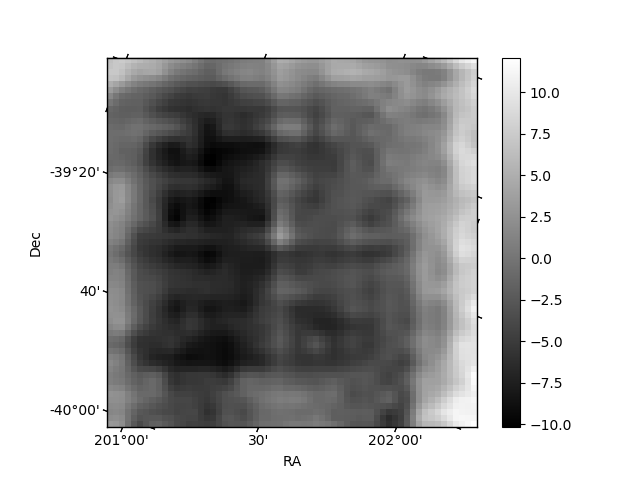
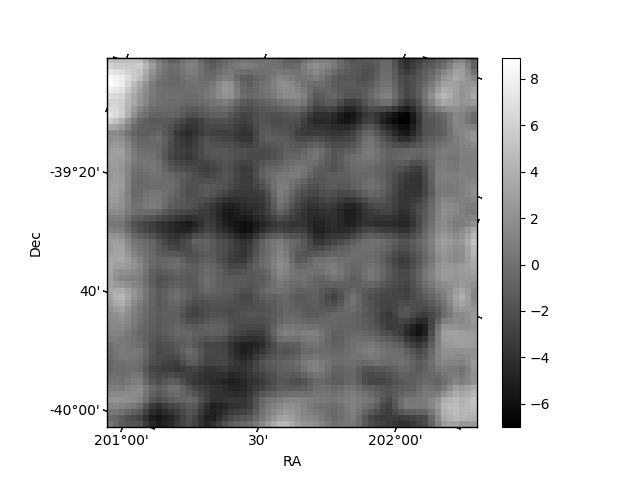
Histogram calculated using DETX and DETY for each event in the final _common_clean file
| Quadrant A | 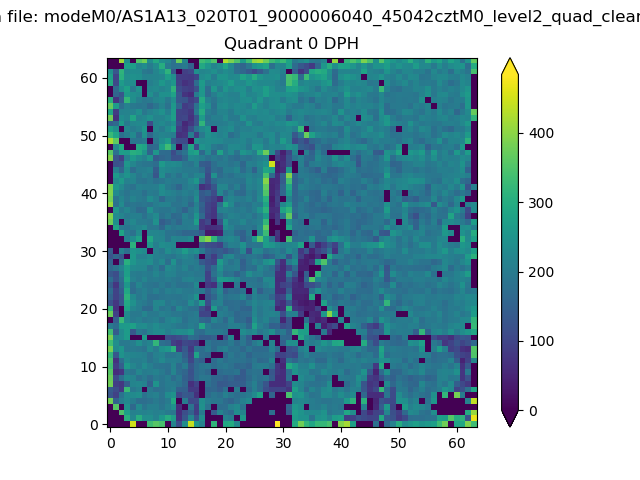 |
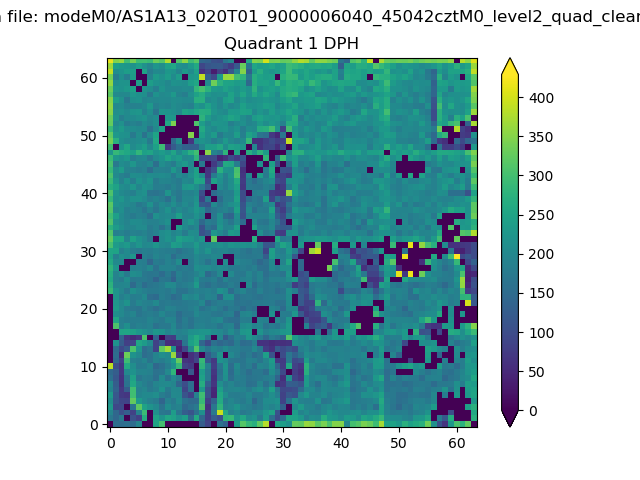 |
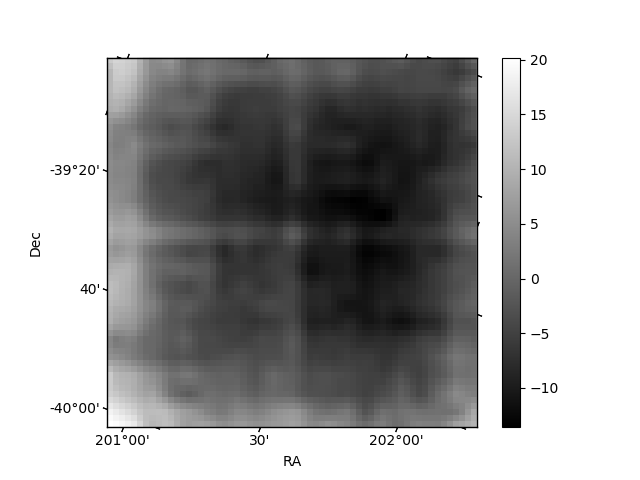
Quadrant B |
|---|---|---|---|
| Quadrant D | 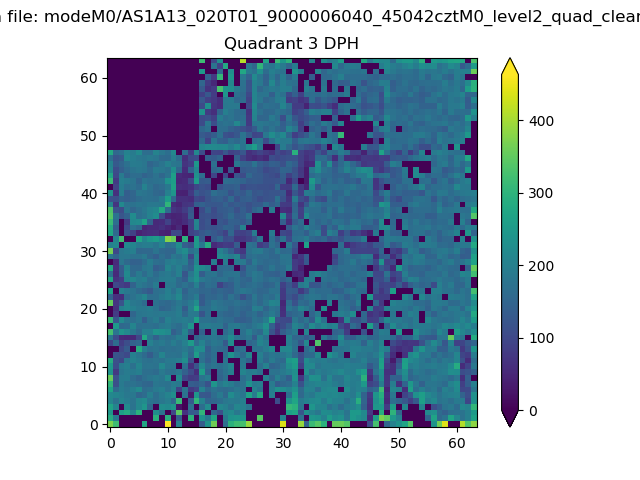 |
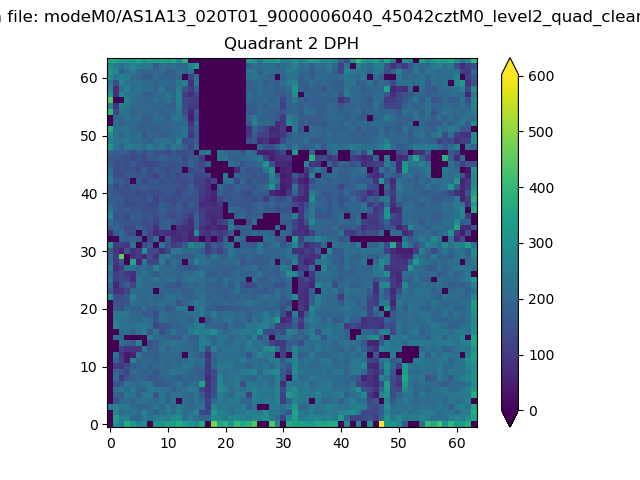 |
Quadrant C |
| Plot type | Count rate plots | Images |
|---|---|---|
| Comparison with Poisson distribution Blue bars denote a histogram of data divided into 1 sec bins. Red curve is a Poisson curve with rate = median count rate of data. |
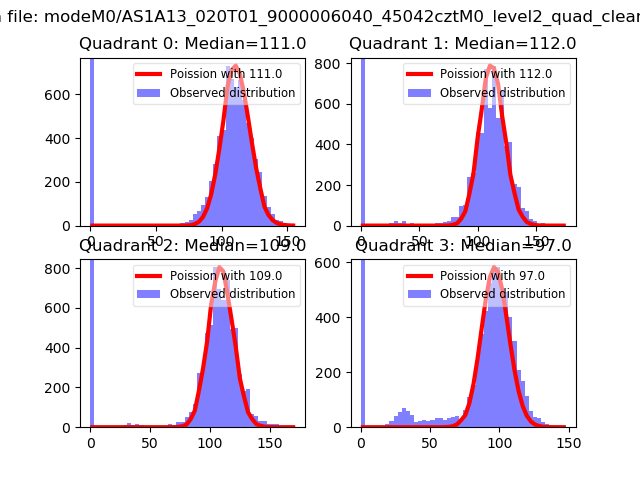 |
 |
| Quadrant-wise count rates Data is divided into 100 sec bins |
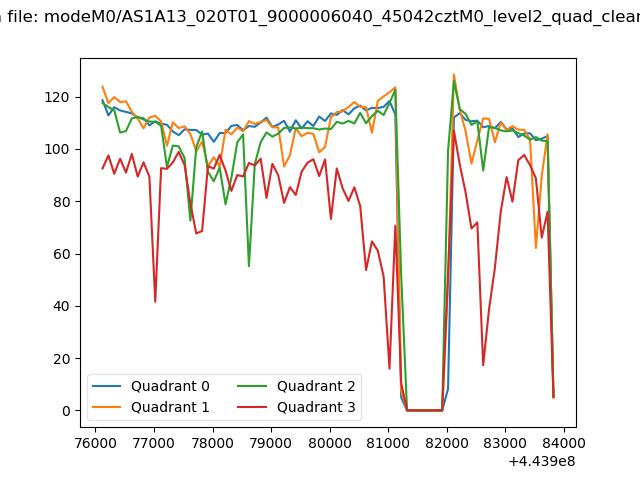 |
|
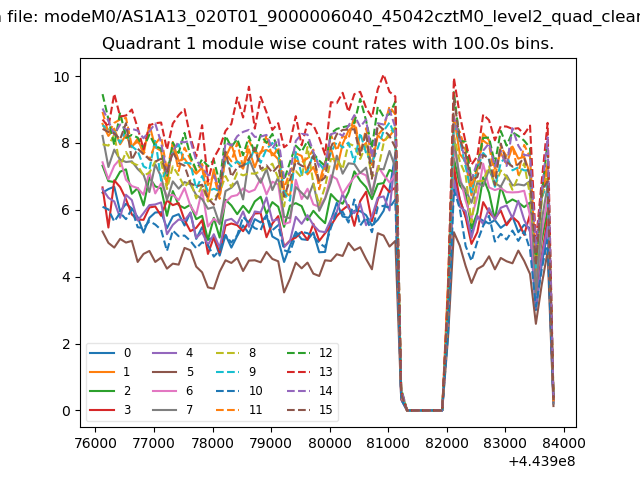
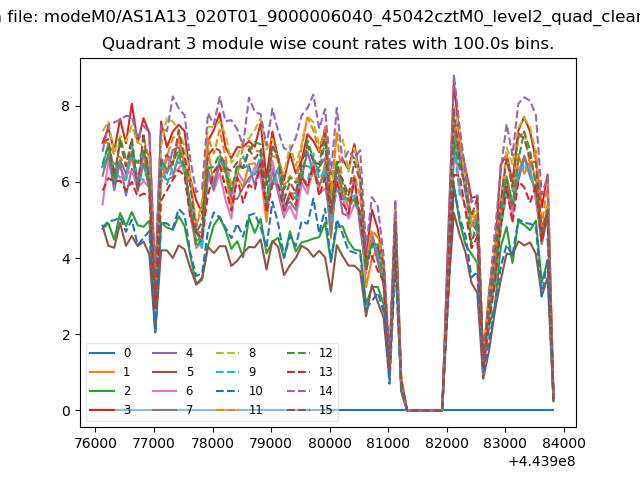
| Module-wise count rates for Quadrant A Data is divided into 100 sec bins |
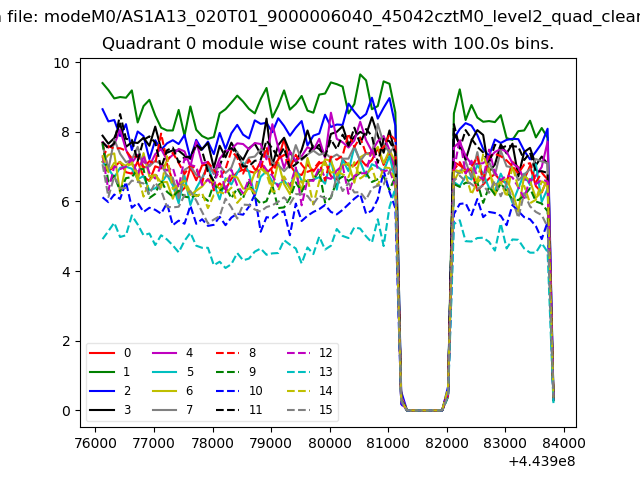 |
 |
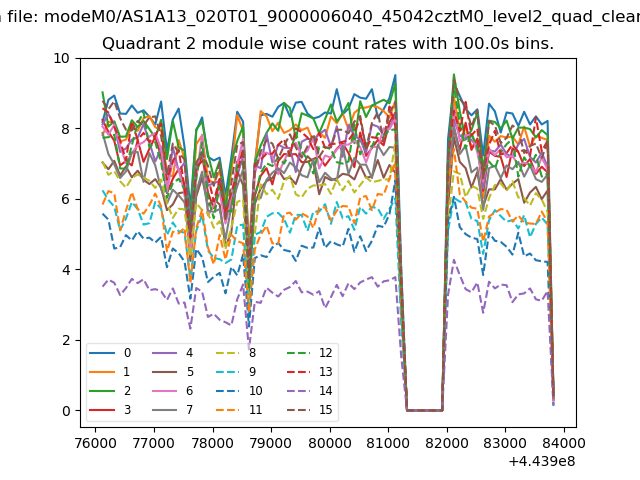
| Module-wise count rates for Quadrant B Data is divided into 100 sec bins |
 |
 |
| Module-wise count rates for Quadrant C Data is divided into 100 sec bins |
 |
 |
| Module-wise count rates for Quadrant D Data is divided into 100 sec bins |
 |
 |
| Parameter | Plot |
|---|---|
| CZT HV Monitor | 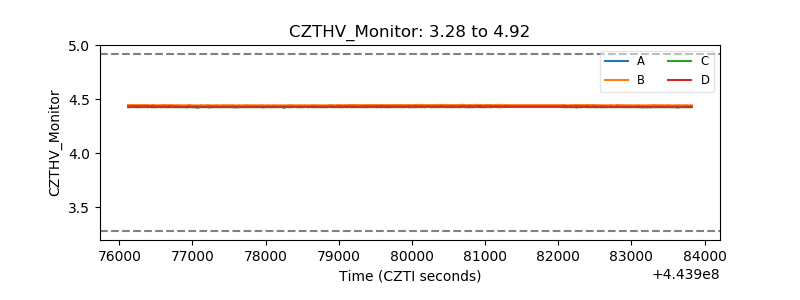 |
| D_VDD | 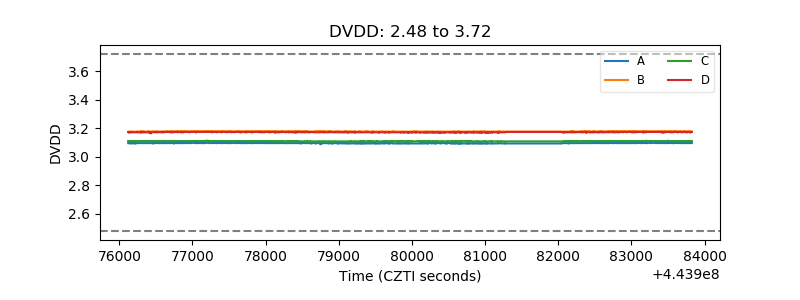 |
| Temperature 1 | 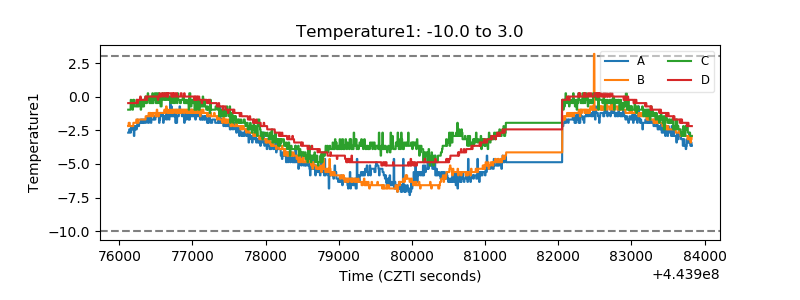 |
| Veto HV Monitor | 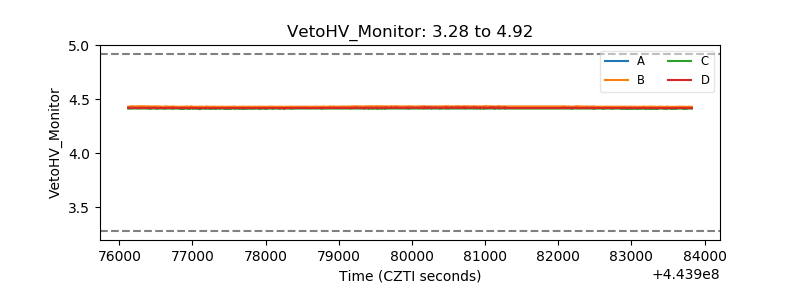 |
| Veto LLD | 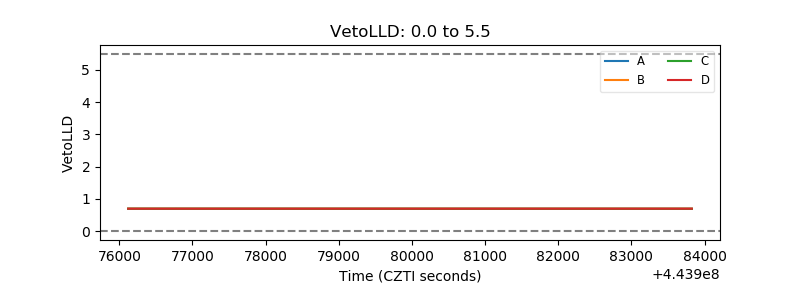 |
| Alpha Counter | 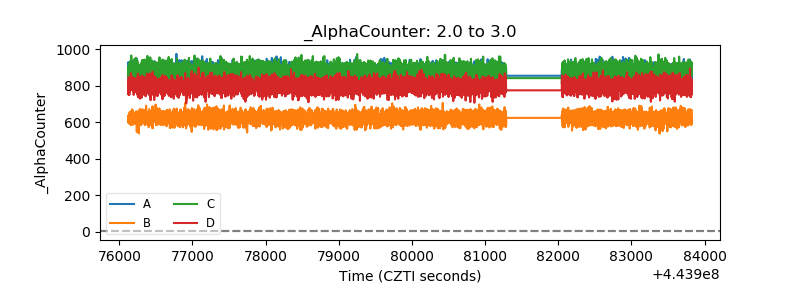 |
| _CPM_Rate | 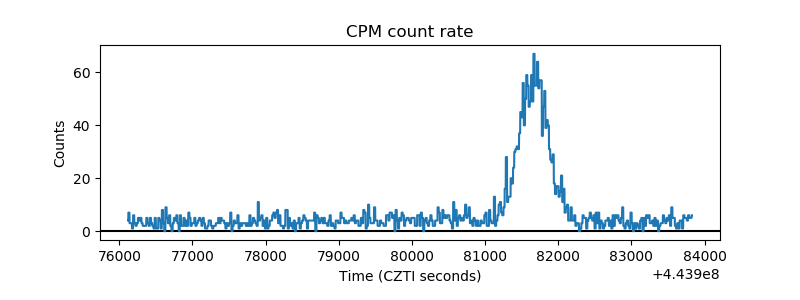 |
| CZT Counter | 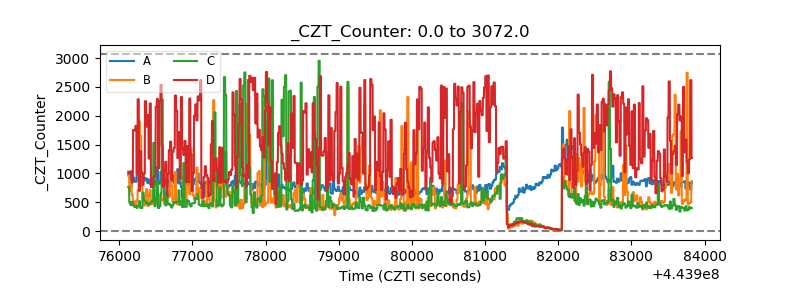 |
| +2.5 Volts monitor | 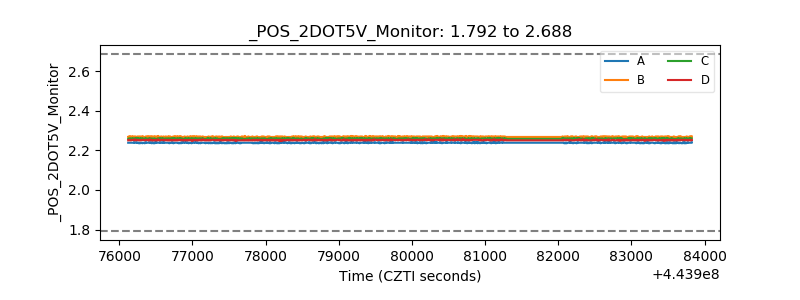 |
| +5 Volts monitor | 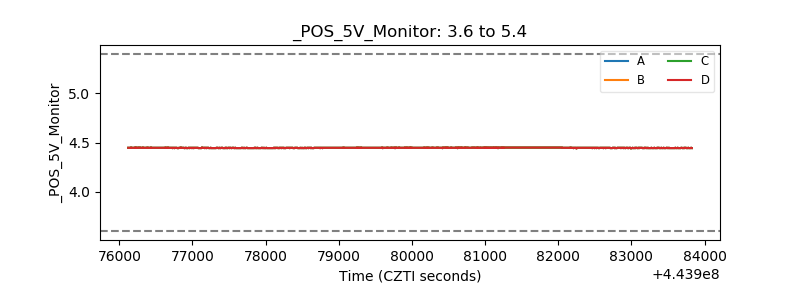 |
| _ROLL_ROT | 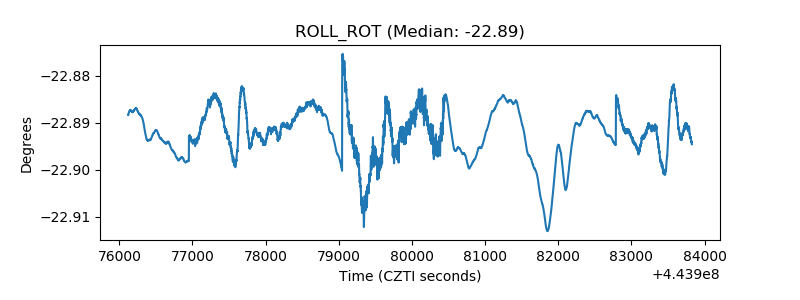 |
| _Roll_DEC | 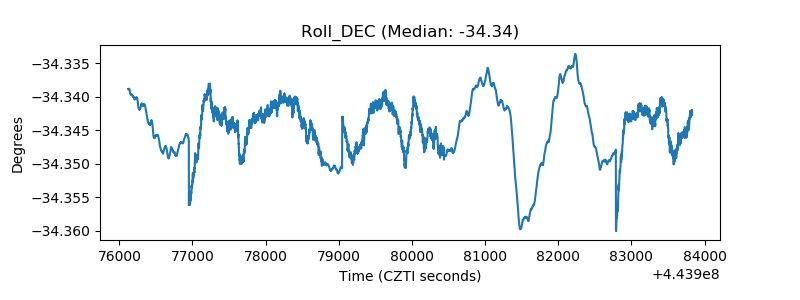 |
| _Roll_RA | 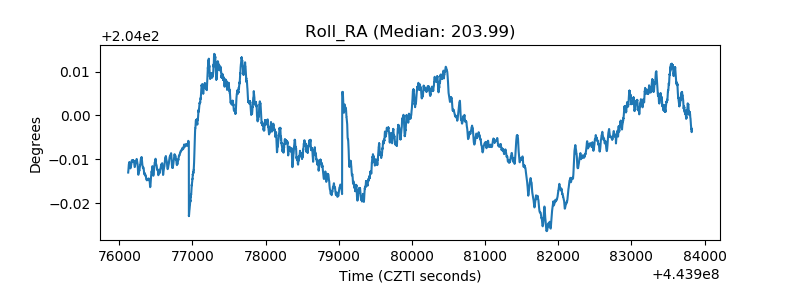 |
| Veto Counter | 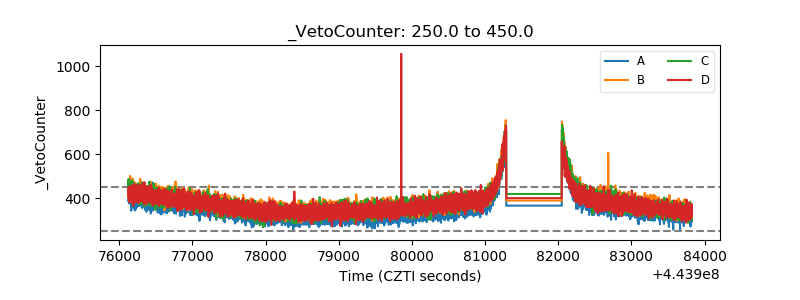 |