| Param | Original file | Final file |
|---|---|---|
| Filename | modeM0/AS1A13_020T01_9000006040_45043cztM0_level2.fits | modeM0/AS1A13_020T01_9000006040_45043cztM0_level2_quad_clean.evt |
| Size (bytes) | 700,050,240 | 105,880,320 |
| Size | 667.6 MB | 101.0 MB |
| Events in quadrant A | 5,860,047 | 741,765 |
| Events in quadrant B | 4,686,020 | 732,217 |
| Events in quadrant C | 3,544,447 | 756,252 |
| Events in quadrant D | 11,271,220 | 479,809 |
| Mode SS | |||
|---|---|---|---|
| Quadrant | BADHDUFLAG | Total packets | Discarded packets |
| A | 0 | 144 | 0 |
| B | 0 | 144 | 0 |
| C | 0 | 144 | 0 |
| D | 0 | 144 | 0 |
| Mode M9 | |||
|---|---|---|---|
| Quadrant | BADHDUFLAG | Total packets | Discarded packets |
| A | 0 | 3 | 0 |
| B | 0 | 3 | 0 |
| C | 0 | 3 | 0 |
| D | 0 | 3 | 0 |
| Mode M0 | |||
|---|---|---|---|
| Quadrant | BADHDUFLAG | Total packets | Discarded packets |
| A | 0 | 22625 | 1 |
| B | 0 | 18725 | 1 |
| C | 0 | 15721 | 1 |
| D | 0 | 38545 | 1 |
| Quadrant | Total seconds | Saturated seconds | Saturation percentage |
|---|---|---|---|
| A | 7123 | 369 | 5.180402% |
| B | 7124 | 597 | 8.380124% |
| C | 7124 | 167 | 2.344189% |
| D | 7124 | 2570 | 36.075239% |
Noise dominated data is calculated using 1-second bins in cleaned event files. If a bin has >2000 counts, and if more than 50% of those come from <1% of pixels, then it is considered to be noise-dominated and hence unusable.
| Quadrant | # 1 sec bins | Bins with >0 counts | Bins with >2000 counts | High rate bins dominated by noise | Noise dominated (total time) | Noise dominated (detector-on time) | Marked lightcurve |
|---|---|---|---|---|---|---|---|
| A | 7288 | 7125 | 31 | 31 | 0.43% | 0.44% | 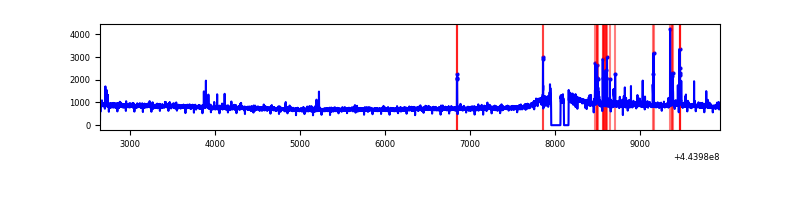 |
| B | 7289 | 7126 | 190 | 190 | 2.61% | 2.67% | 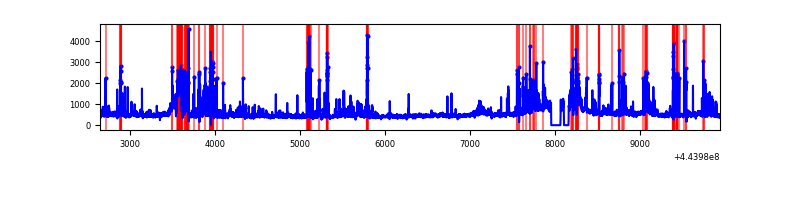 |
| C | 7289 | 7126 | 67 | 67 | 0.92% | 0.94% | 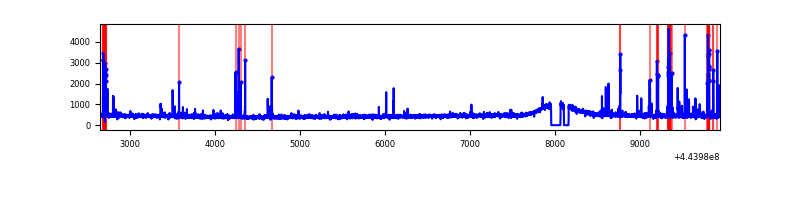 |
| D | 7289 | 7126 | 1976 | 1976 | 27.11% | 27.73% | 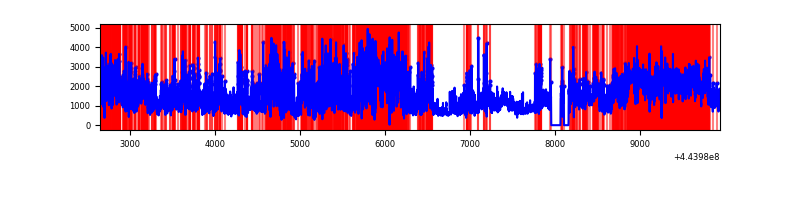 |
Top three noisy pixels from each quadrant. If the there are fewer than three noisy pixels in the level2.evt file, extra rows are filled as -1
| Pixel properties | Quadrant properties | ||||||
|---|---|---|---|---|---|---|---|
| Quadrant | DetID | PixID | Counts | Sigma | Mean | Median | Sigma |
| A | 10 | 83 | 2460571 | 14231.8 | 823 | 804 | 172.8 |
| A | 13 | 248 | 127968 | 735.75 | 823 | 804 | 172.8 |
| A | 0 | 243 | 36296 | 205.35 | 823 | 804 | 172.8 |
| B | 0 | 189 | 800202 | 4971.42 | 804 | 778 | 160.8 |
| B | 0 | 190 | 179234 | 1109.77 | 804 | 778 | 160.8 |
| B | 12 | 48 | 178741 | 1106.71 | 804 | 778 | 160.8 |
| C | 14 | 254 | 262624 | 1361.14 | 811 | 815 | 192.3 |
| C | 1 | 3 | 62893 | 322.74 | 811 | 815 | 192.3 |
| C | 12 | 2 | 42554 | 217.0 | 811 | 815 | 192.3 |
| D | 13 | 174 | 3255650 | 17783.64 | 707 | 683 | 183.0 |
| D | 5 | 235 | 2205670 | 12047.03 | 707 | 683 | 183.0 |
| D | 1 | 52 | 800618 | 4370.48 | 707 | 683 | 183.0 |
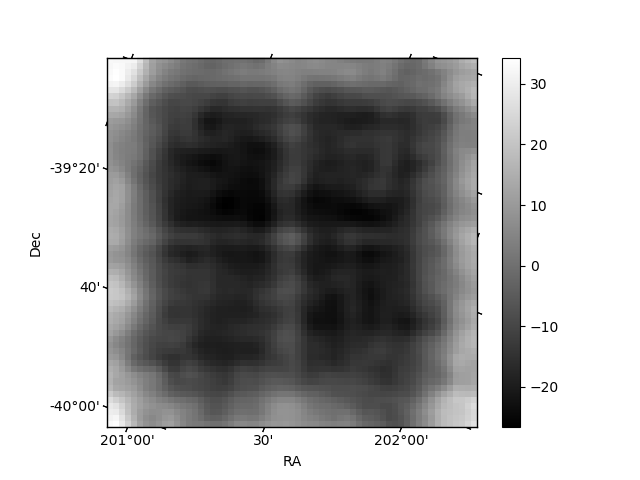
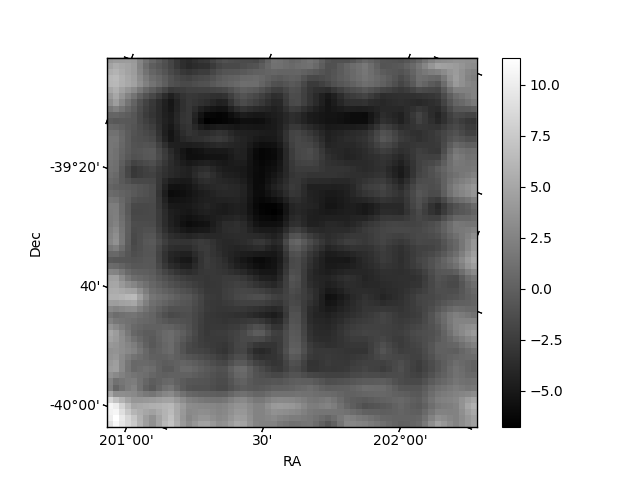
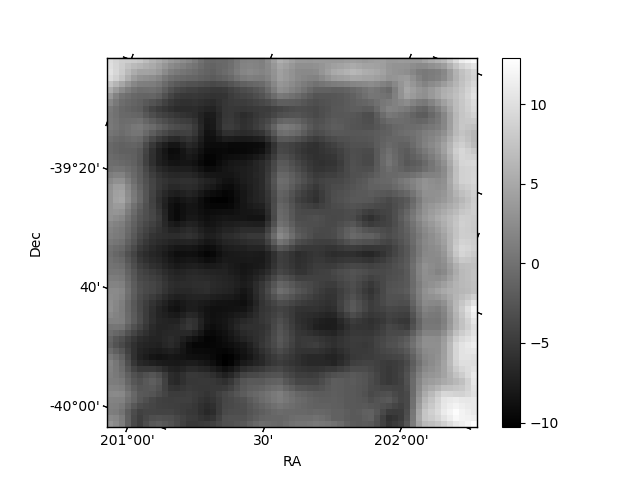
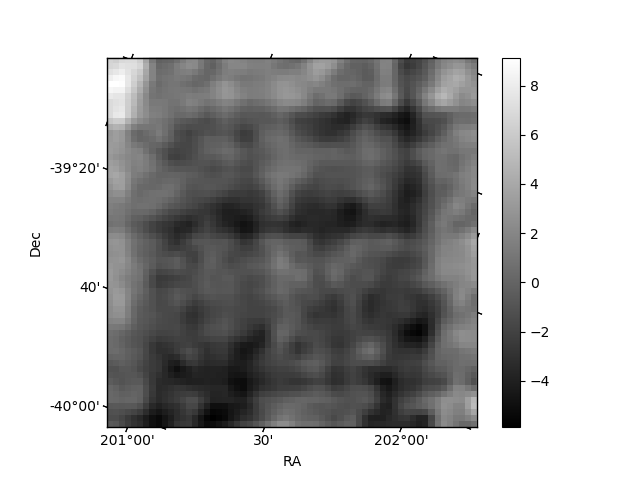
Histogram calculated using DETX and DETY for each event in the final _common_clean file
| Quadrant A | 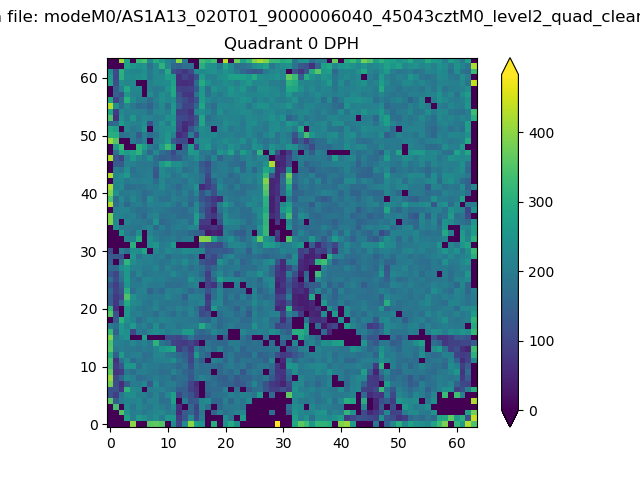 |
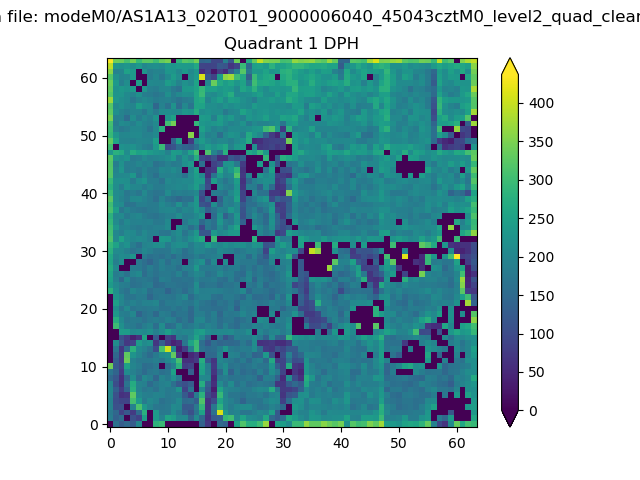 |
Quadrant B |
|---|---|---|---|
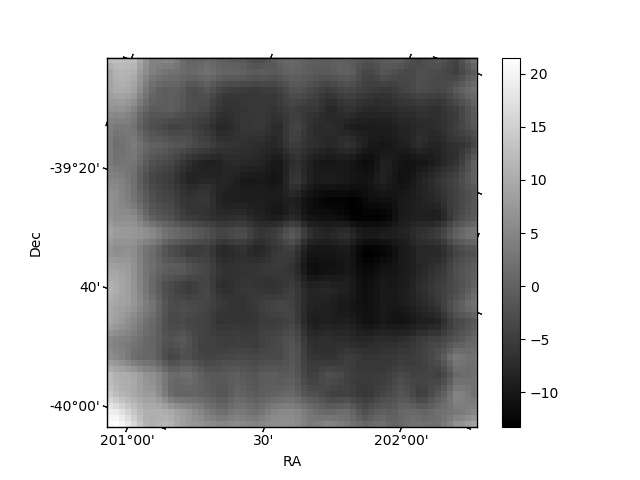
| Quadrant D | 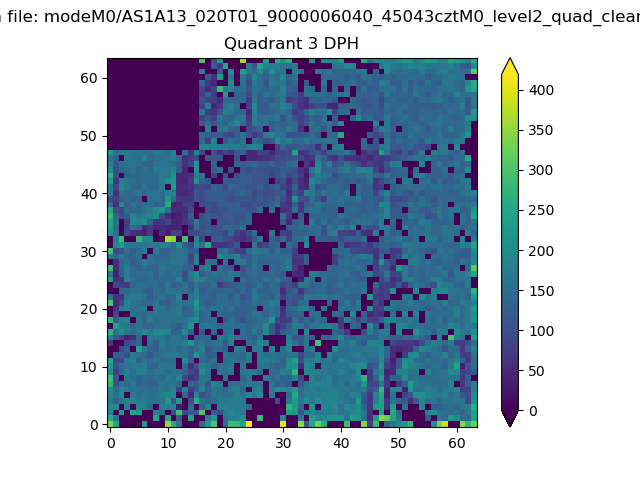 |
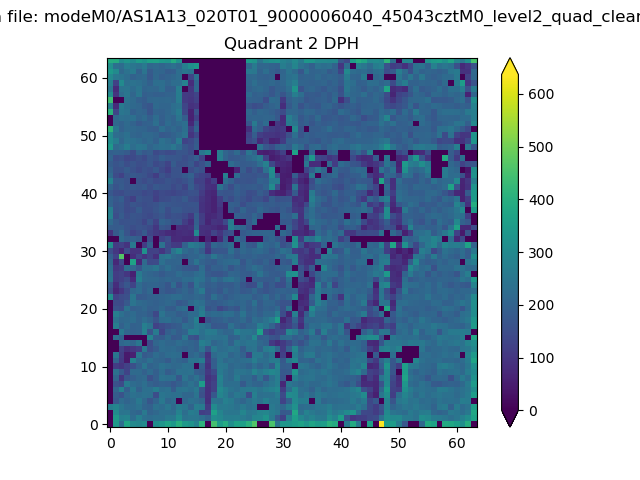 |
Quadrant C |
| Plot type | Count rate plots | Images |
|---|---|---|
| Comparison with Poisson distribution Blue bars denote a histogram of data divided into 1 sec bins. Red curve is a Poisson curve with rate = median count rate of data. |
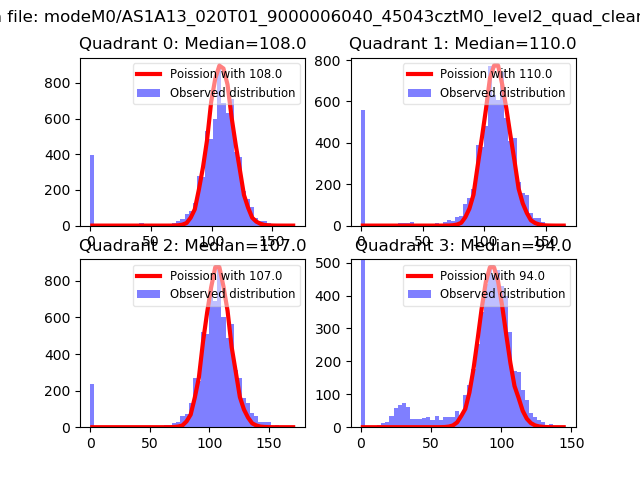 |
 |
| Quadrant-wise count rates Data is divided into 100 sec bins |
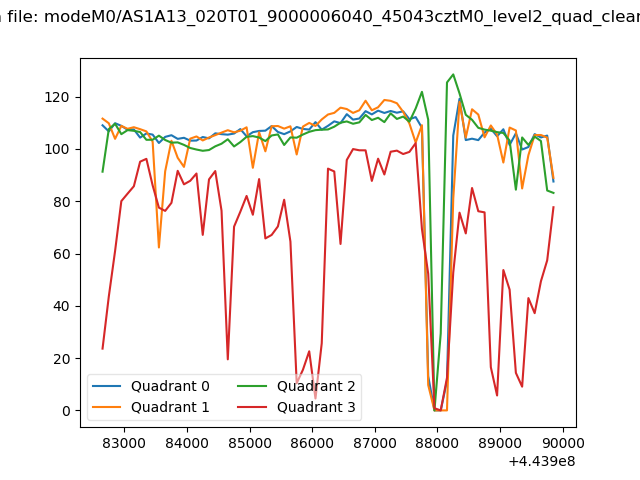 |
|
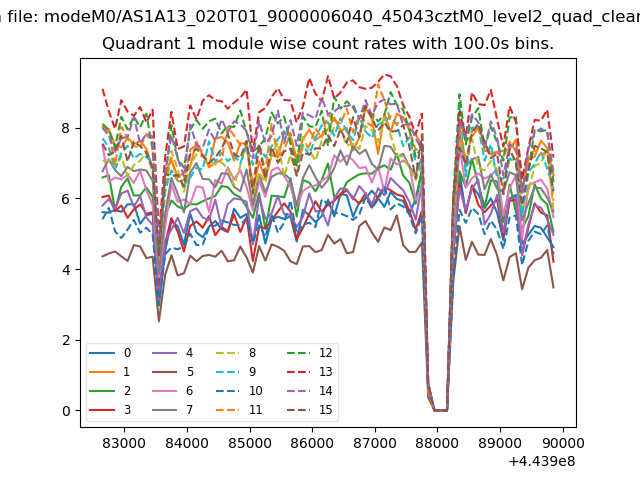
| Module-wise count rates for Quadrant A Data is divided into 100 sec bins |
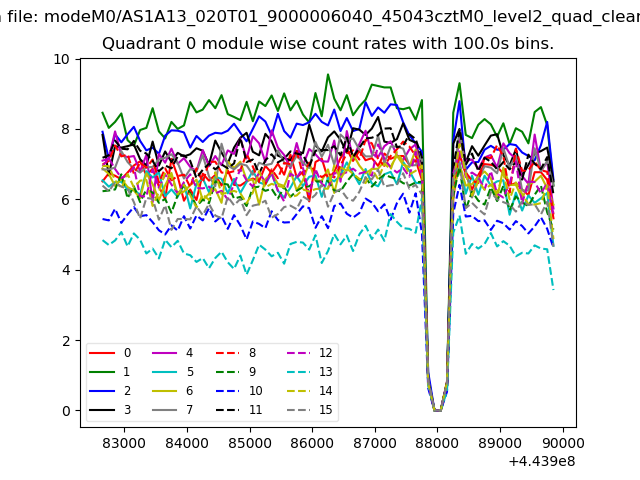 |
 |
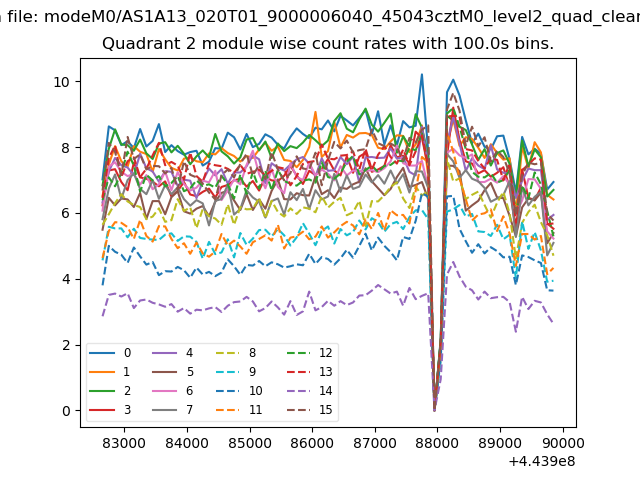
| Module-wise count rates for Quadrant B Data is divided into 100 sec bins |
 |
 |
| Module-wise count rates for Quadrant C Data is divided into 100 sec bins |
 |
 |
| Module-wise count rates for Quadrant D Data is divided into 100 sec bins |
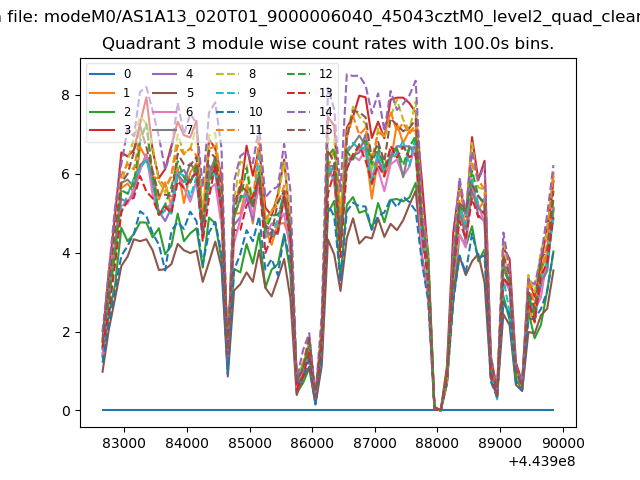 |
 |
| Parameter | Plot |
|---|---|
| CZT HV Monitor | 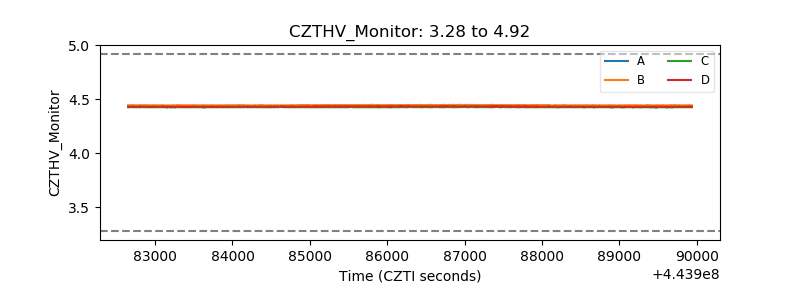 |
| D_VDD | 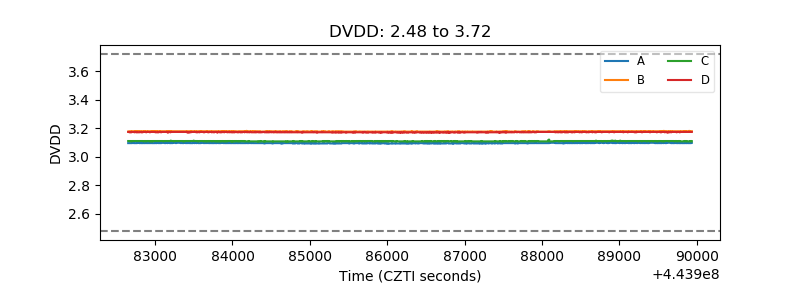 |
| Temperature 1 | 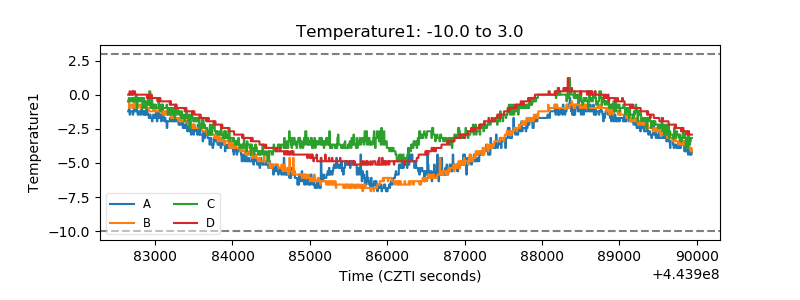 |
| Veto HV Monitor | 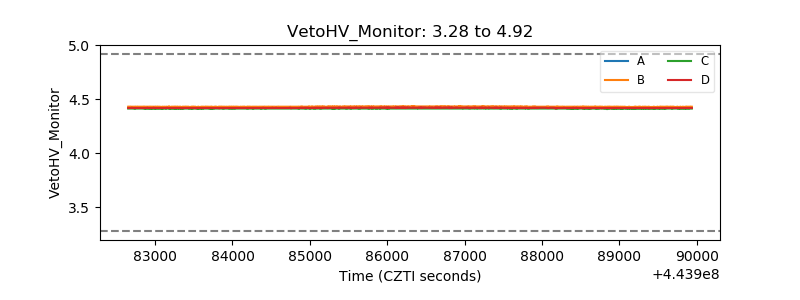 |
| Veto LLD | 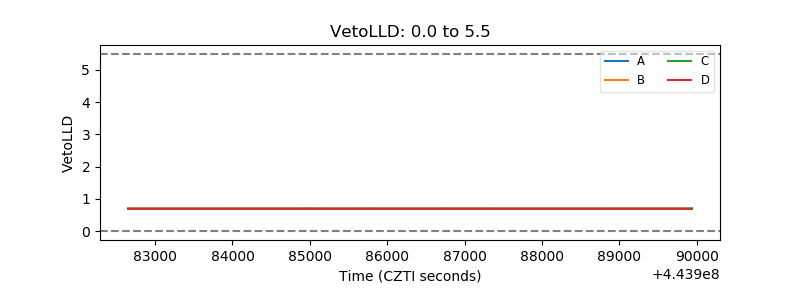 |
| Alpha Counter | 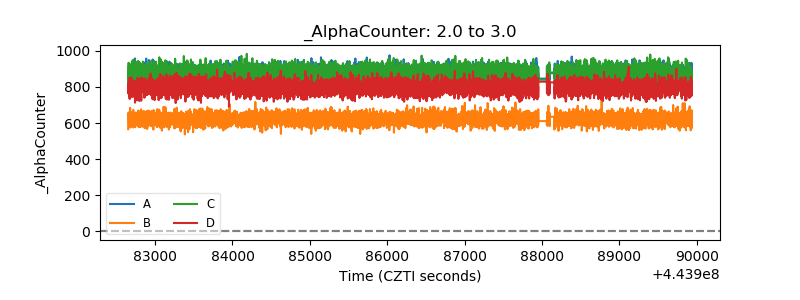 |
| _CPM_Rate | 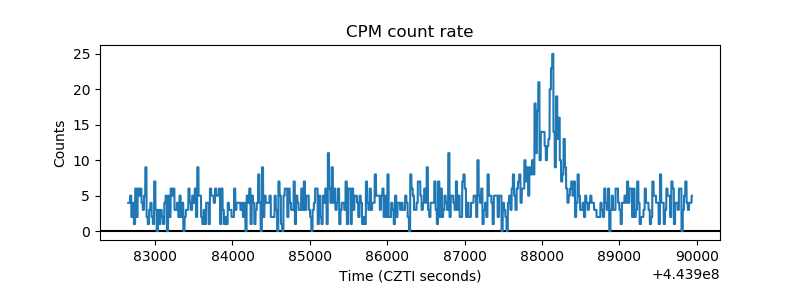 |
| CZT Counter | 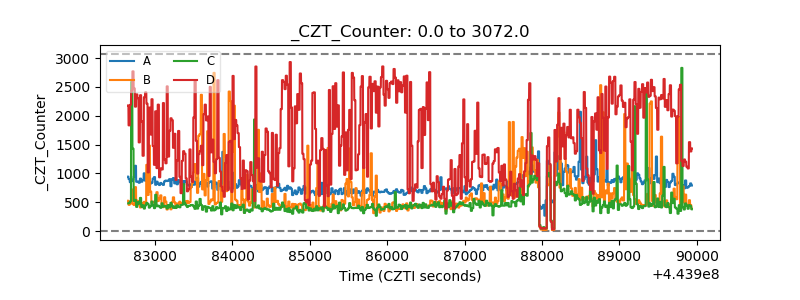 |
| +2.5 Volts monitor | 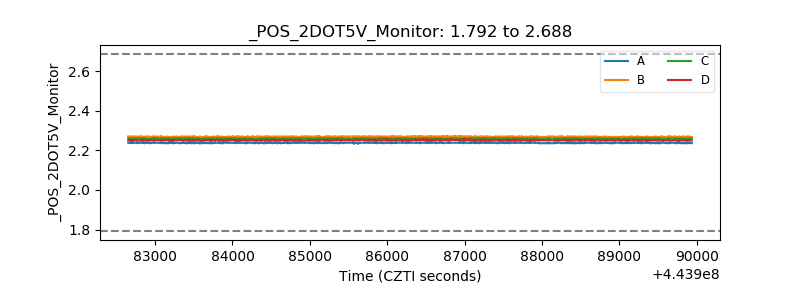 |
| +5 Volts monitor | 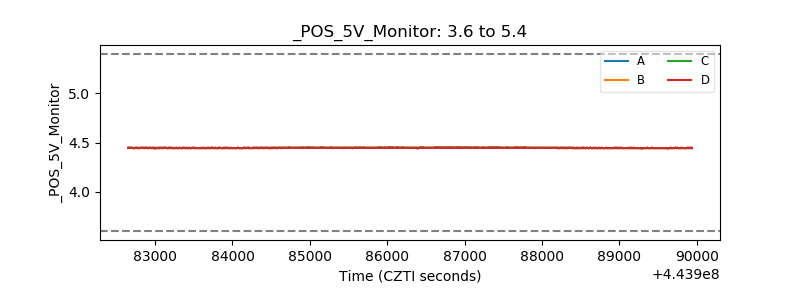 |
| _ROLL_ROT | 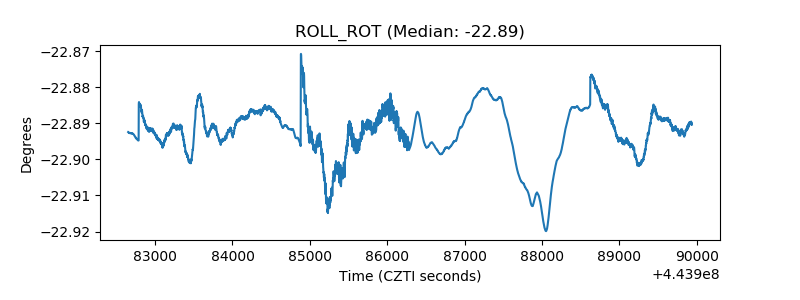 |
| _Roll_DEC | 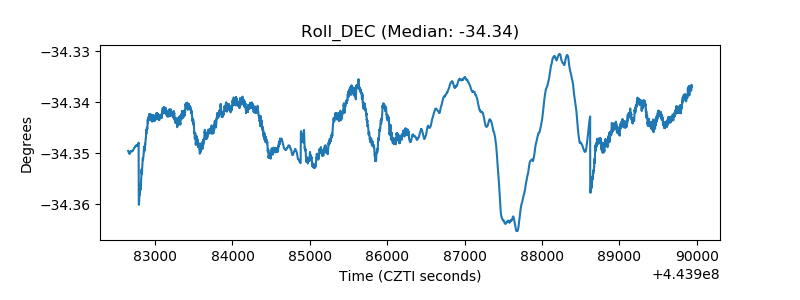 |
| _Roll_RA | 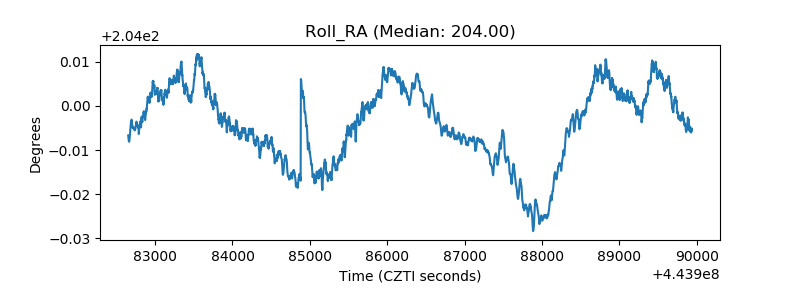 |
| Veto Counter | 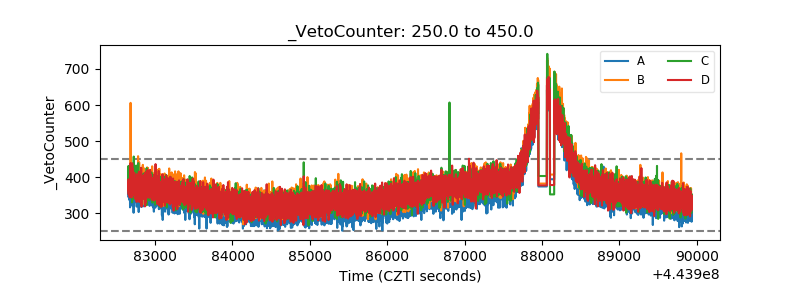 |