| Param | Original file | Final file |
|---|---|---|
| Filename | modeM0/AS1A13_020T01_9000006040_45044cztM0_level2.fits | modeM0/AS1A13_020T01_9000006040_45044cztM0_level2_quad_clean.evt |
| Size (bytes) | 727,632,000 | 112,907,520 |
| Size | 693.9 MB | 107.7 MB |
| Events in quadrant A | 6,040,335 | 800,380 |
| Events in quadrant B | 4,703,358 | 806,655 |
| Events in quadrant C | 4,006,745 | 785,874 |
| Events in quadrant D | 11,603,103 | 503,131 |
| Mode SS | |||
|---|---|---|---|
| Quadrant | BADHDUFLAG | Total packets | Discarded packets |
| A | 0 | 150 | 0 |
| B | 0 | 150 | 0 |
| C | 0 | 150 | 0 |
| D | 0 | 150 | 0 |
| Mode M0 | |||
|---|---|---|---|
| Quadrant | BADHDUFLAG | Total packets | Discarded packets |
| A | 0 | 23452 | 0 |
| B | 0 | 19082 | 0 |
| C | 0 | 17324 | 0 |
| D | 0 | 39810 | 0 |
| Quadrant | Total seconds | Saturated seconds | Saturation percentage |
|---|---|---|---|
| A | 7505 | 152 | 2.025316% |
| B | 7506 | 304 | 4.050093% |
| C | 7506 | 181 | 2.411404% |
| D | 7506 | 2510 | 33.439915% |
Noise dominated data is calculated using 1-second bins in cleaned event files. If a bin has >2000 counts, and if more than 50% of those come from <1% of pixels, then it is considered to be noise-dominated and hence unusable.
| Quadrant | # 1 sec bins | Bins with >0 counts | Bins with >2000 counts | High rate bins dominated by noise | Noise dominated (total time) | Noise dominated (detector-on time) | Marked lightcurve |
|---|---|---|---|---|---|---|---|
| A | 7505 | 7505 | 18 | 18 | 0.24% | 0.24% | 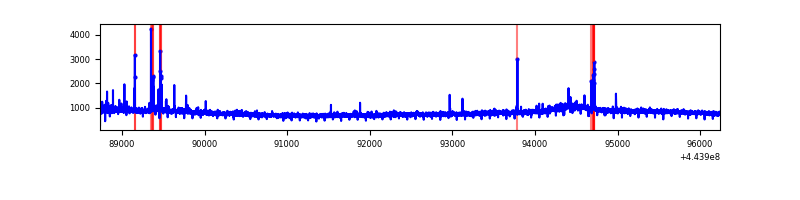 |
| B | 7506 | 7506 | 127 | 127 | 1.69% | 1.69% | 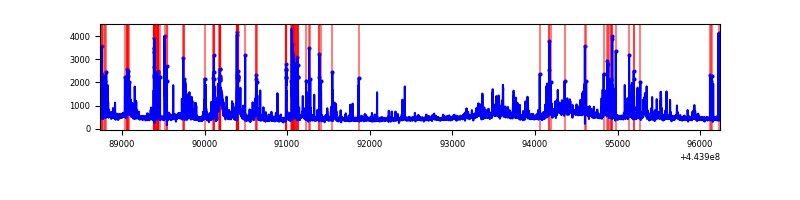 |
| C | 7506 | 7506 | 119 | 119 | 1.59% | 1.59% | 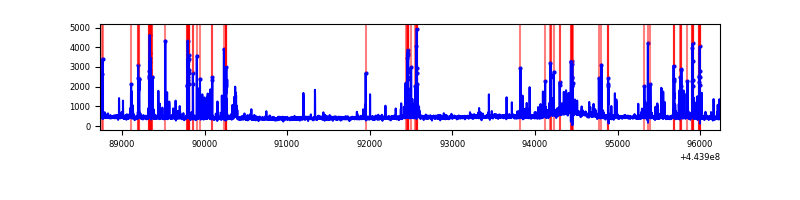 |
| D | 7506 | 7506 | 2080 | 2080 | 27.71% | 27.71% | 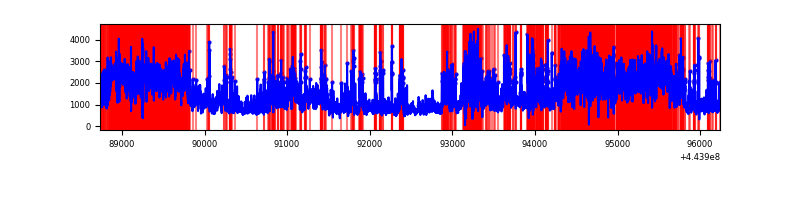 |
Top three noisy pixels from each quadrant. If the there are fewer than three noisy pixels in the level2.evt file, extra rows are filled as -1
| Pixel properties | Quadrant properties | ||||||
|---|---|---|---|---|---|---|---|
| Quadrant | DetID | PixID | Counts | Sigma | Mean | Median | Sigma |
| A | 10 | 83 | 2617327 | 14708.39 | 846 | 826 | 177.9 |
| A | 13 | 248 | 75041 | 417.19 | 846 | 826 | 177.9 |
| A | 0 | 243 | 36392 | 199.93 | 846 | 826 | 177.9 |
| B | 0 | 189 | 485821 | 2914.77 | 836 | 811 | 166.4 |
| B | 12 | 48 | 249554 | 1494.87 | 836 | 811 | 166.4 |
| B | 0 | 190 | 141590 | 846.04 | 836 | 811 | 166.4 |
| C | 14 | 254 | 551434 | 2856.77 | 821 | 827 | 192.7 |
| C | 1 | 3 | 77116 | 395.82 | 821 | 827 | 192.7 |
| C | 12 | 2 | 76573 | 393.0 | 821 | 827 | 192.7 |
| D | 13 | 174 | 3993509 | 21848.94 | 723 | 700 | 182.7 |
| D | 1 | 52 | 1533434 | 8387.23 | 723 | 700 | 182.7 |
| D | 11 | 241 | 1215144 | 6645.53 | 723 | 700 | 182.7 |
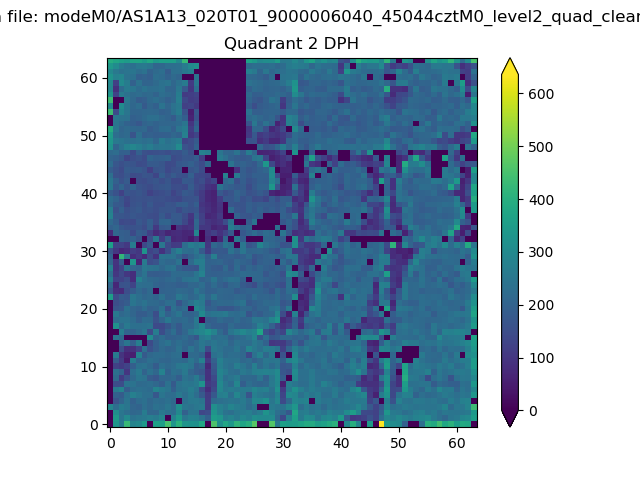
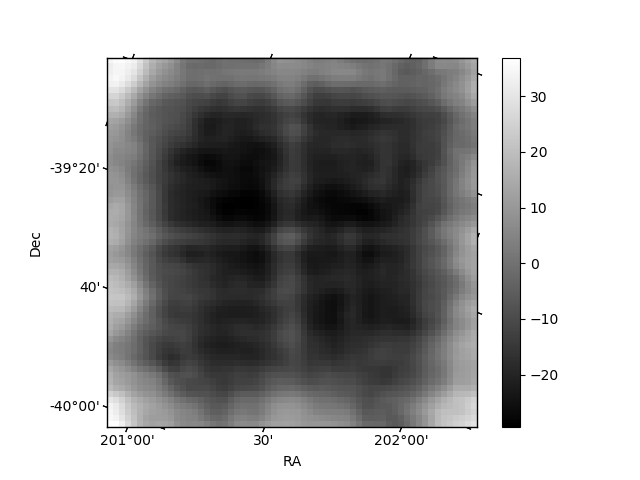
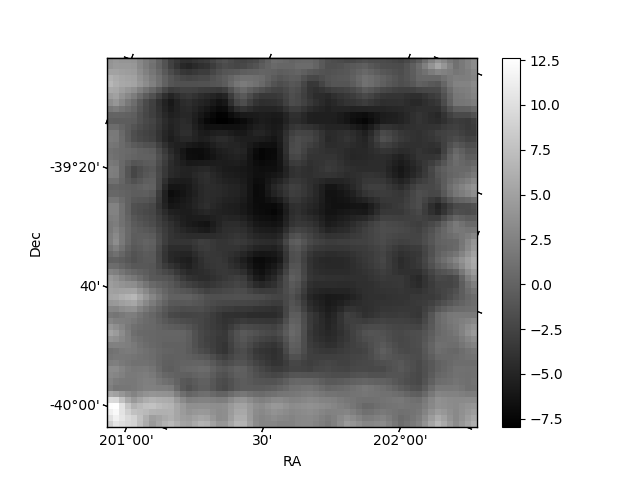
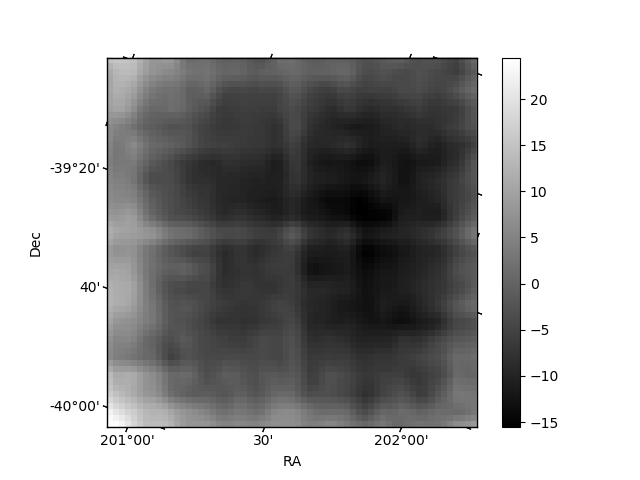
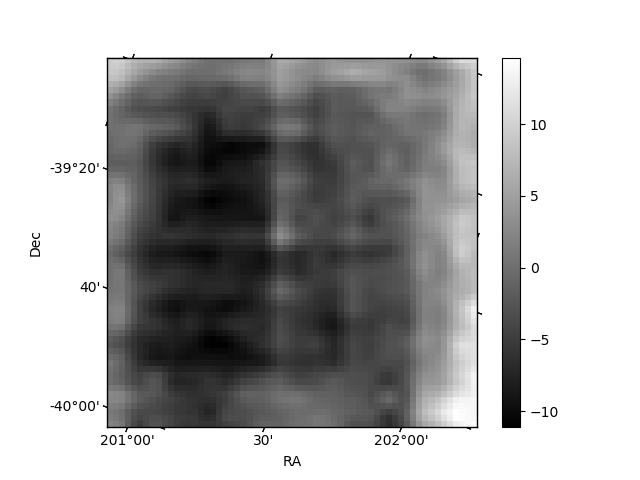
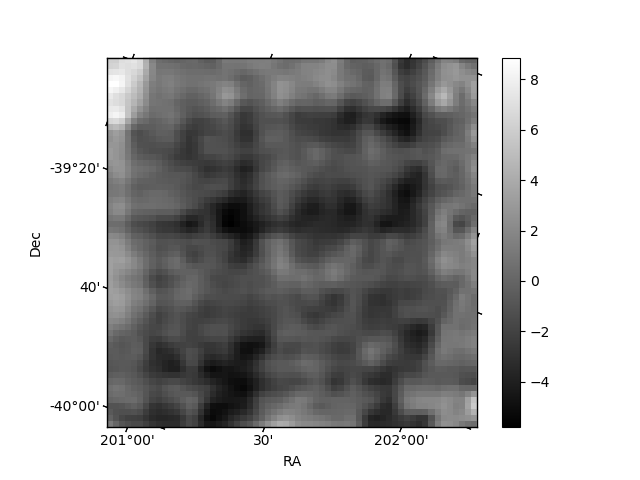
Histogram calculated using DETX and DETY for each event in the final _common_clean file
| Quadrant A | 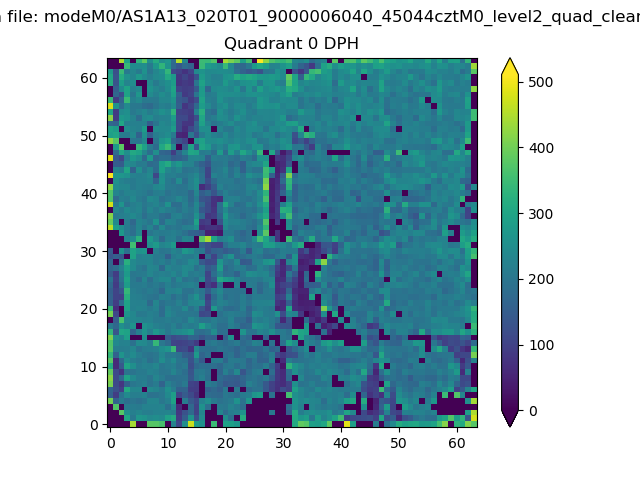 |
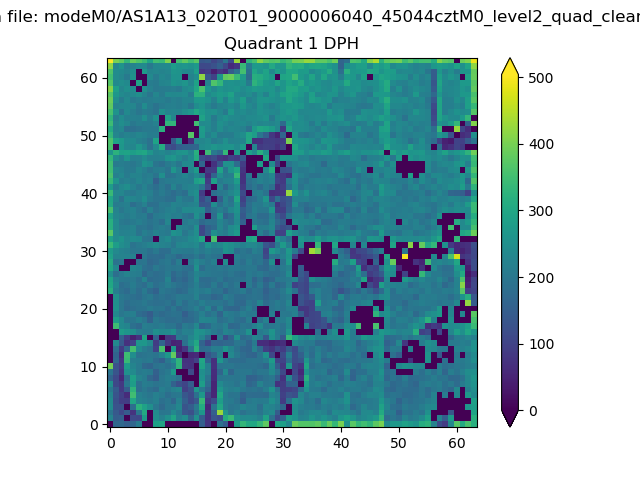 |
Quadrant B |
|---|---|---|---|
| Quadrant D | 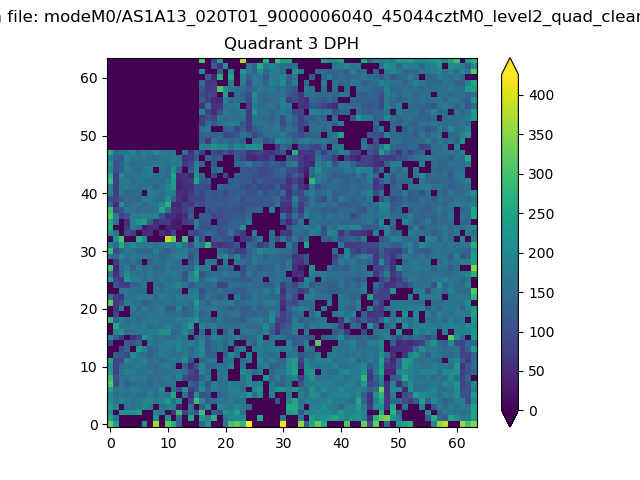 |
 |
Quadrant C |
| Plot type | Count rate plots | Images |
|---|---|---|
| Comparison with Poisson distribution Blue bars denote a histogram of data divided into 1 sec bins. Red curve is a Poisson curve with rate = median count rate of data. |
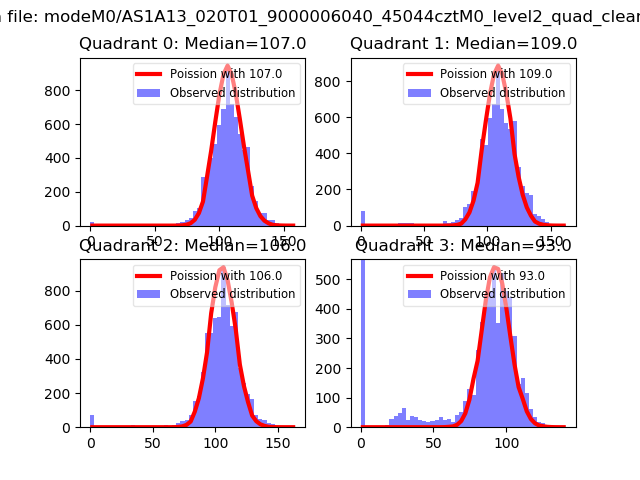 |
 |
| Quadrant-wise count rates Data is divided into 100 sec bins |
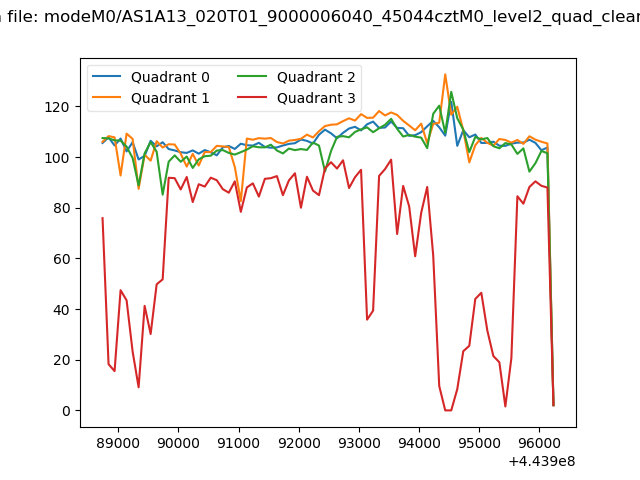 |
|
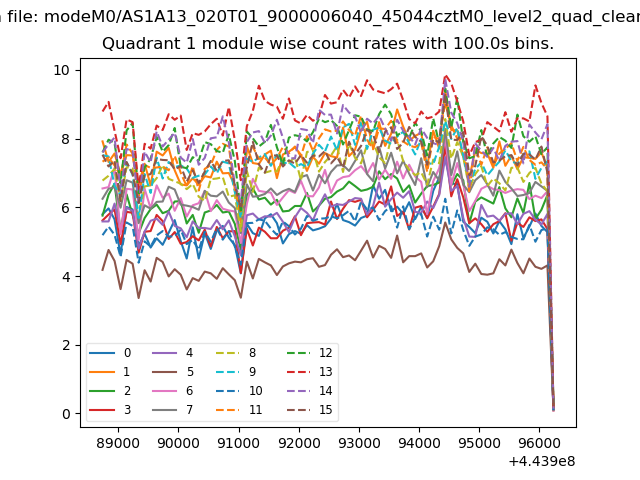
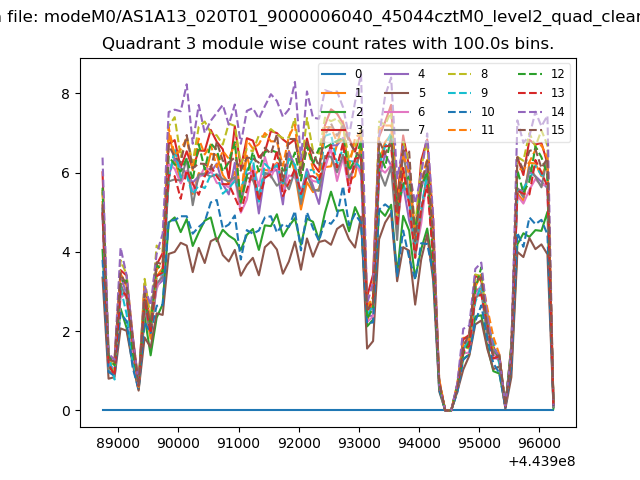
| Module-wise count rates for Quadrant A Data is divided into 100 sec bins |
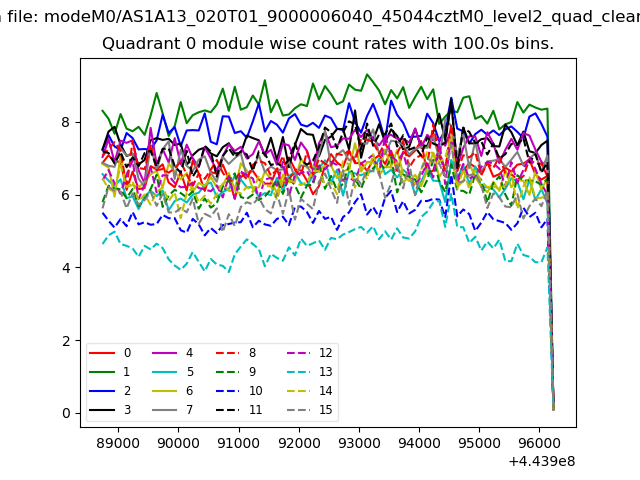 |
 |
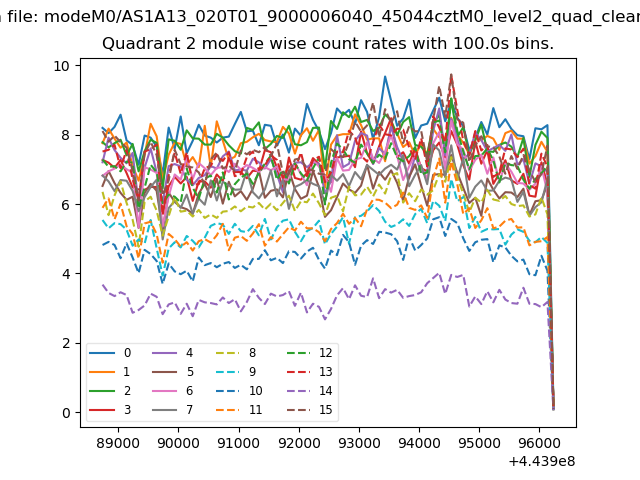
| Module-wise count rates for Quadrant B Data is divided into 100 sec bins |
 |
 |
| Module-wise count rates for Quadrant C Data is divided into 100 sec bins |
 |
 |
| Module-wise count rates for Quadrant D Data is divided into 100 sec bins |
 |
 |
| Parameter | Plot |
|---|---|
| CZT HV Monitor | 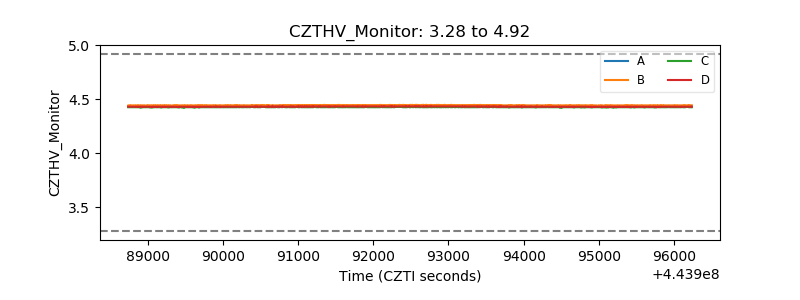 |
| D_VDD | 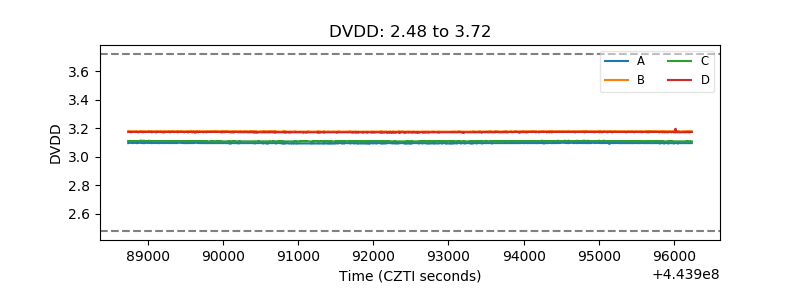 |
| Temperature 1 | 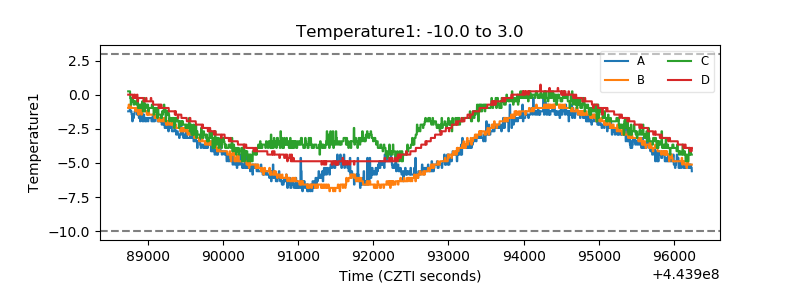 |
| Veto HV Monitor | 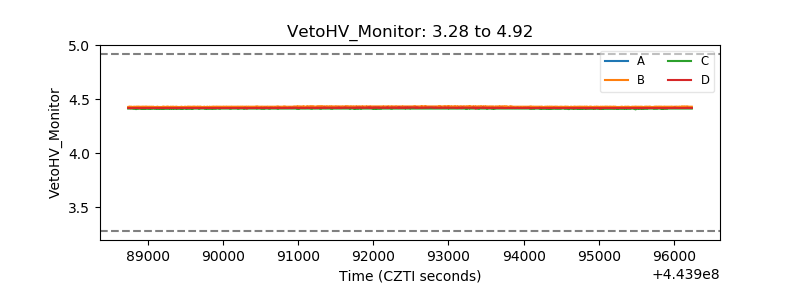 |
| Veto LLD | 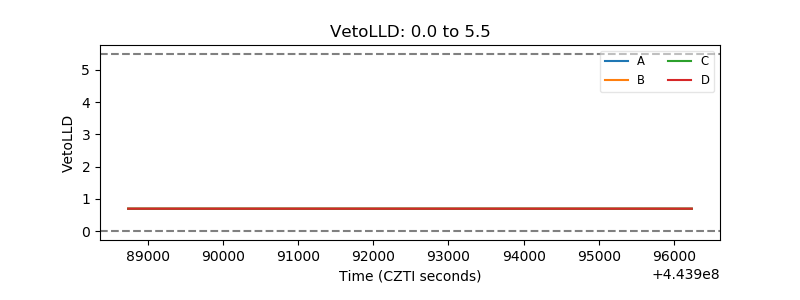 |
| Alpha Counter | 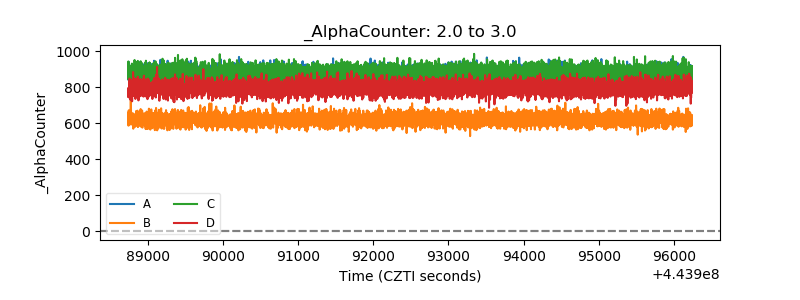 |
| _CPM_Rate | 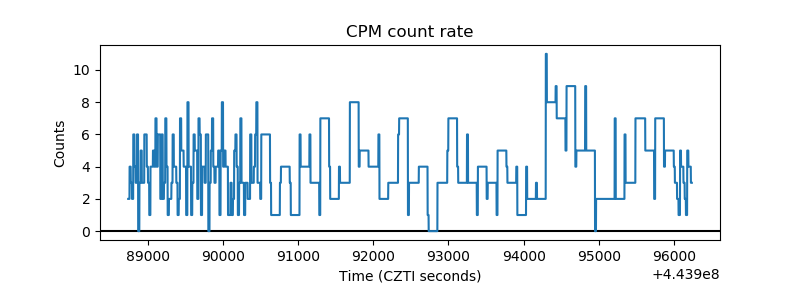 |
| CZT Counter | 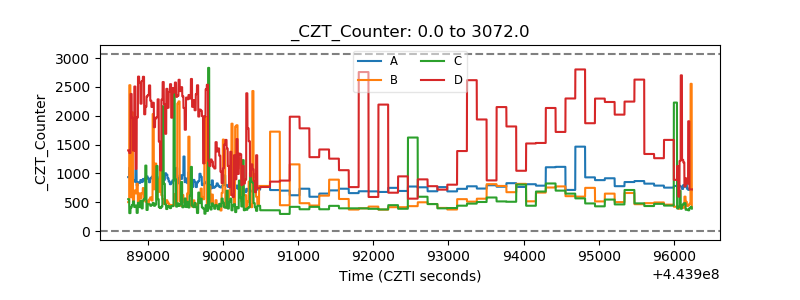 |
| +2.5 Volts monitor | 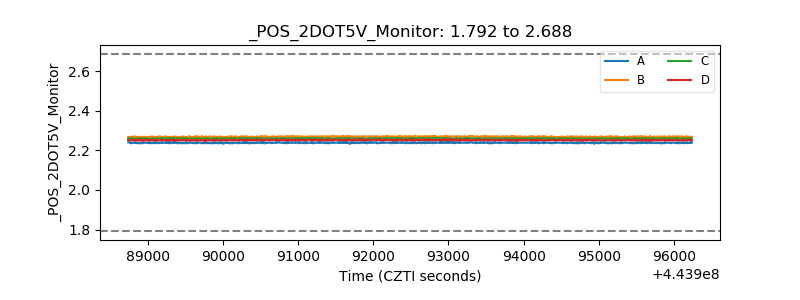 |
| +5 Volts monitor | 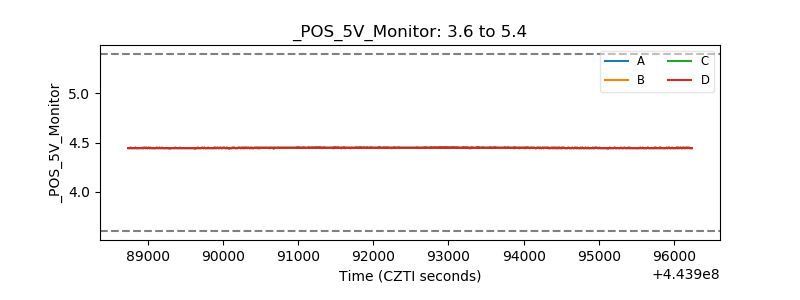 |
| _ROLL_ROT | 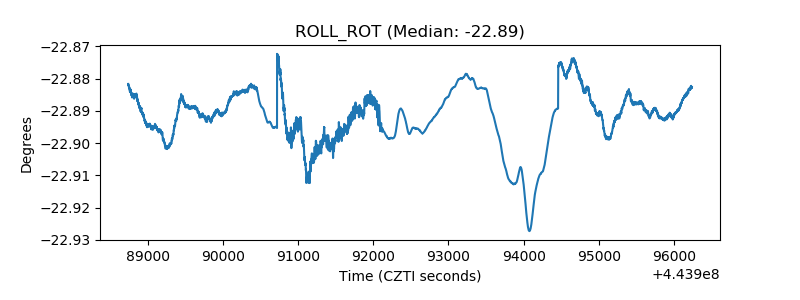 |
| _Roll_DEC | 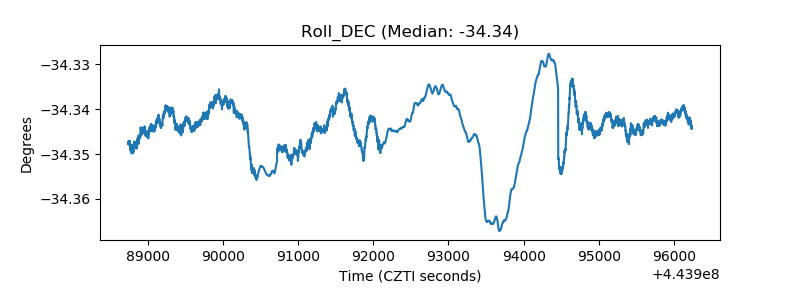 |
| _Roll_RA | 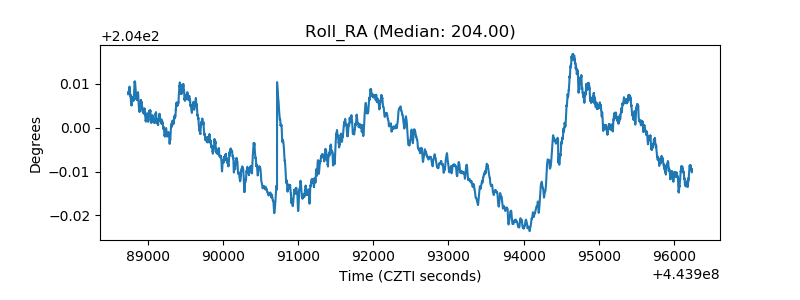 |
| Veto Counter | 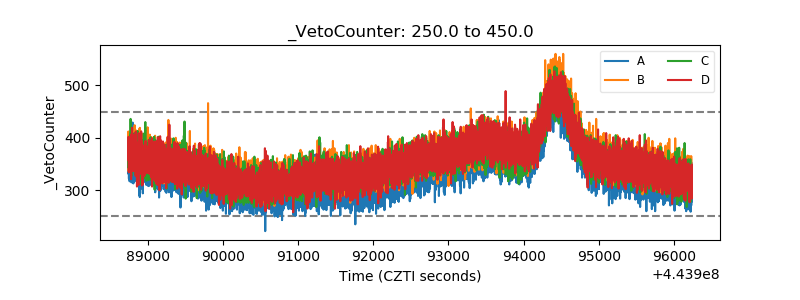 |