| Param | Original file | Final file |
|---|---|---|
| Filename | modeM0/AS1A13_020T01_9000006040_45045cztM0_level2.fits | modeM0/AS1A13_020T01_9000006040_45045cztM0_level2_quad_clean.evt |
| Size (bytes) | 309,939,840 | 52,038,720 |
| Size | 295.6 MB | 49.6 MB |
| Events in quadrant A | 2,675,738 | 362,787 |
| Events in quadrant B | 2,108,445 | 363,157 |
| Events in quadrant C | 1,738,742 | 356,229 |
| Events in quadrant D | 4,678,585 | 246,926 |
| Mode SS | |||
|---|---|---|---|
| Quadrant | BADHDUFLAG | Total packets | Discarded packets |
| A | 0 | 70 | 0 |
| B | 0 | 70 | 0 |
| C | 0 | 70 | 0 |
| D | 0 | 70 | 0 |
| Mode M0 | |||
|---|---|---|---|
| Quadrant | BADHDUFLAG | Total packets | Discarded packets |
| A | 0 | 10662 | 0 |
| B | 0 | 8705 | 0 |
| C | 0 | 7802 | 0 |
| D | 0 | 16390 | 0 |
| Quadrant | Total seconds | Saturated seconds | Saturation percentage |
|---|---|---|---|
| A | 3478 | 29 | 0.833813% |
| B | 3478 | 119 | 3.421507% |
| C | 3478 | 58 | 1.667625% |
| D | 3479 | 968 | 27.824087% |
Noise dominated data is calculated using 1-second bins in cleaned event files. If a bin has >2000 counts, and if more than 50% of those come from <1% of pixels, then it is considered to be noise-dominated and hence unusable.
| Quadrant | # 1 sec bins | Bins with >0 counts | Bins with >2000 counts | High rate bins dominated by noise | Noise dominated (total time) | Noise dominated (detector-on time) | Marked lightcurve |
|---|---|---|---|---|---|---|---|
| A | 3478 | 3478 | 13 | 13 | 0.37% | 0.37% | 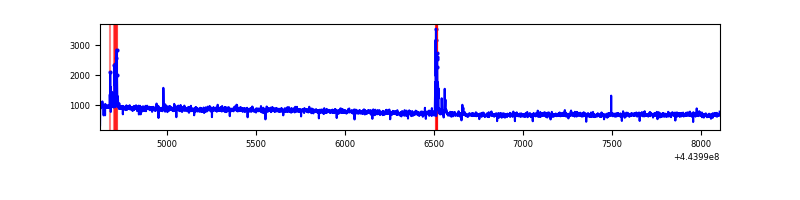 |
| B | 3478 | 3478 | 68 | 68 | 1.96% | 1.96% | 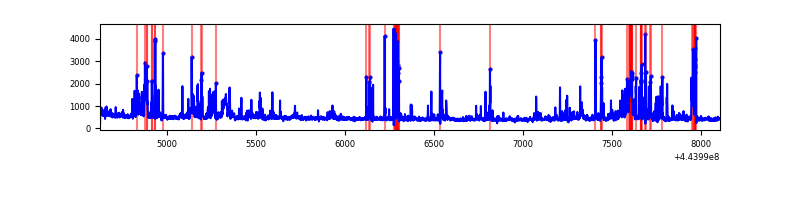 |
| C | 3478 | 3478 | 46 | 46 | 1.32% | 1.32% | 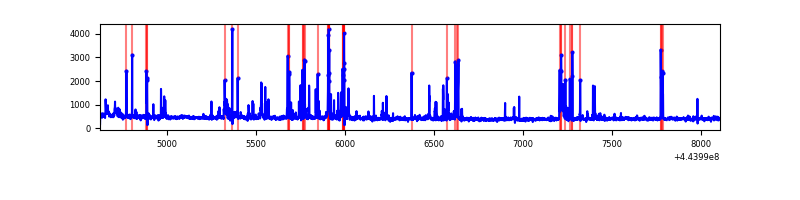 |
| D | 3479 | 3479 | 844 | 844 | 24.26% | 24.26% | 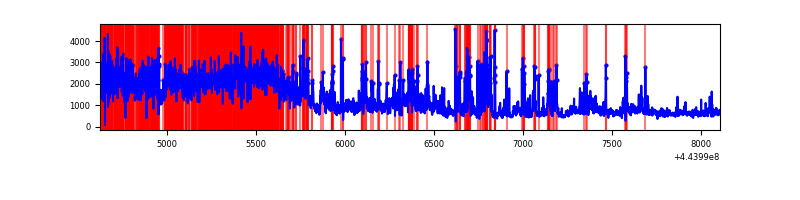 |
Top three noisy pixels from each quadrant. If the there are fewer than three noisy pixels in the level2.evt file, extra rows are filled as -1
| Pixel properties | Quadrant properties | ||||||
|---|---|---|---|---|---|---|---|
| Quadrant | DetID | PixID | Counts | Sigma | Mean | Median | Sigma |
| A | 10 | 83 | 1208373 | 15446.17 | 363 | 355 | 78.2 |
| A | 13 | 248 | 30269 | 382.49 | 363 | 355 | 78.2 |
| A | 0 | 243 | 19588 | 245.92 | 363 | 355 | 78.2 |
| B | 5 | 255 | 273972 | 3757.91 | 362 | 352 | 72.8 |
| B | 0 | 189 | 180202 | 2470.07 | 362 | 352 | 72.8 |
| B | 0 | 190 | 72315 | 988.34 | 362 | 352 | 72.8 |
| C | 14 | 254 | 246081 | 2876.63 | 356 | 358 | 85.4 |
| C | 12 | 2 | 49817 | 579.01 | 356 | 358 | 85.4 |
| C | 15 | 208 | 26359 | 304.39 | 356 | 358 | 85.4 |
| D | 13 | 174 | 991490 | 12075.4 | 319 | 309 | 82.1 |
| D | 1 | 52 | 804729 | 9800.12 | 319 | 309 | 82.1 |
| D | 11 | 241 | 754042 | 9182.61 | 319 | 309 | 82.1 |
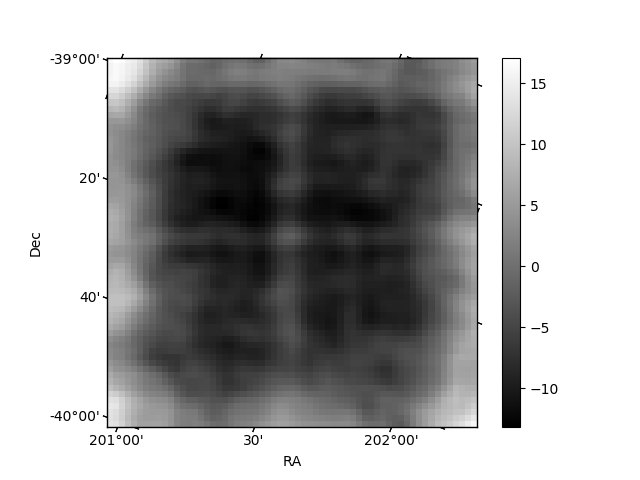
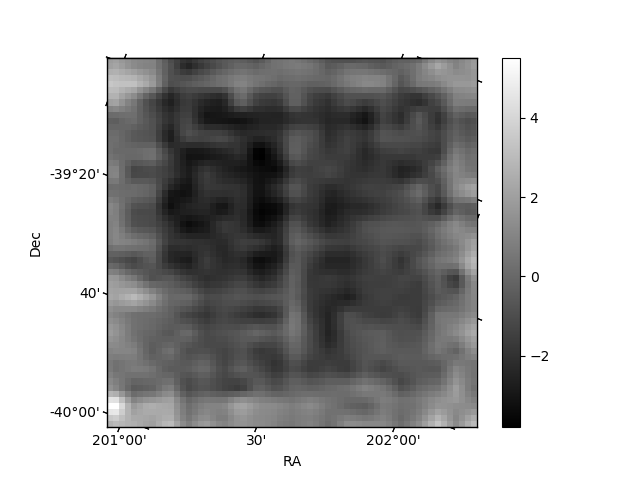
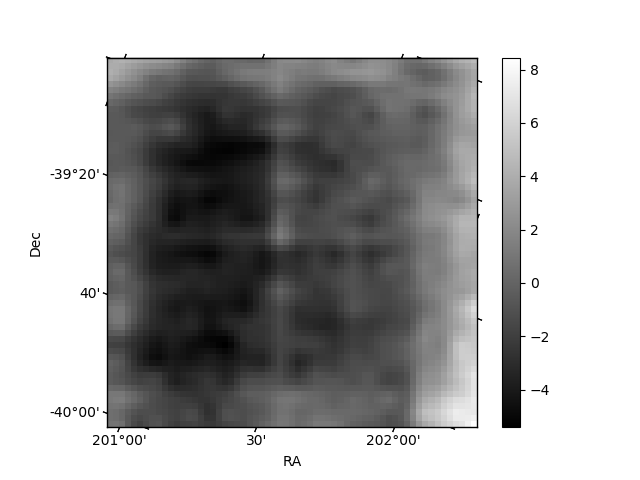
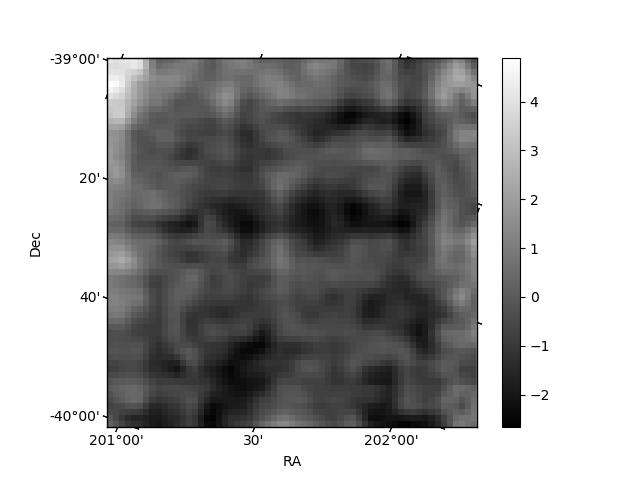
Histogram calculated using DETX and DETY for each event in the final _common_clean file
| Quadrant A | 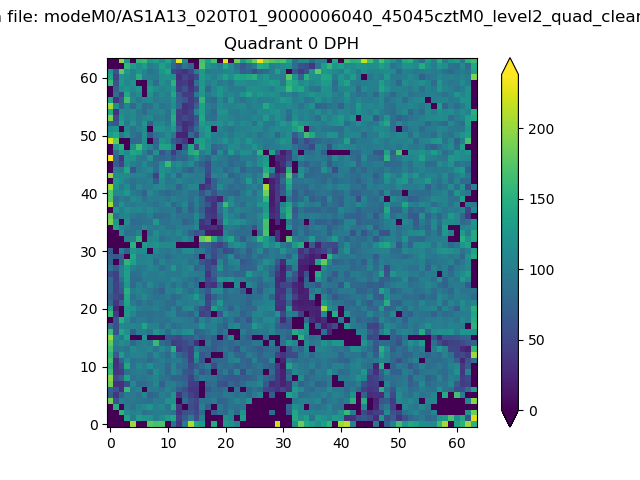 |
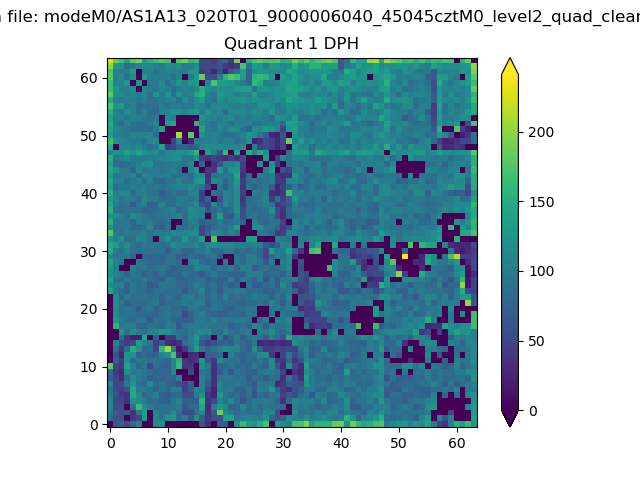 |
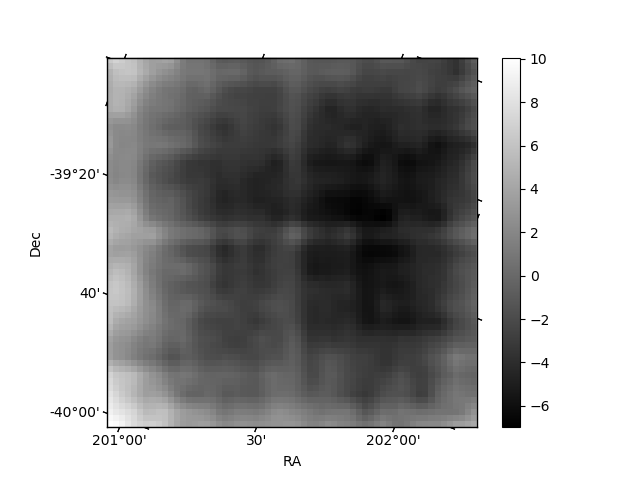
Quadrant B |
|---|---|---|---|
| Quadrant D | 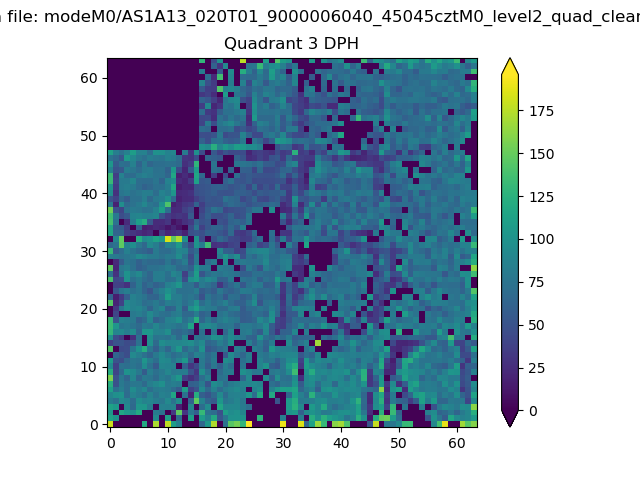 |
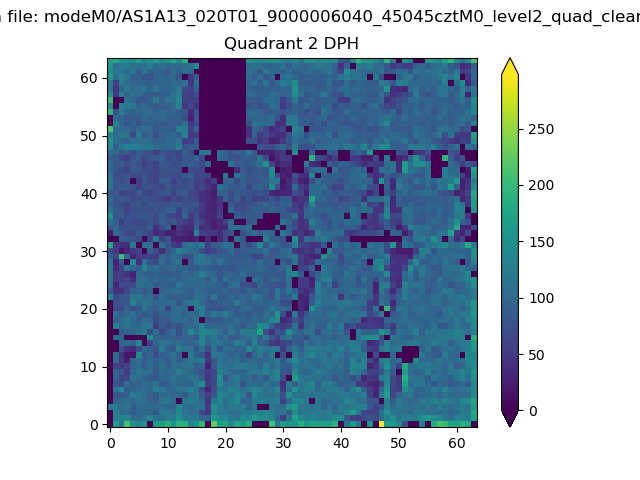 |
Quadrant C |
| Plot type | Count rate plots | Images |
|---|---|---|
| Comparison with Poisson distribution Blue bars denote a histogram of data divided into 1 sec bins. Red curve is a Poisson curve with rate = median count rate of data. |
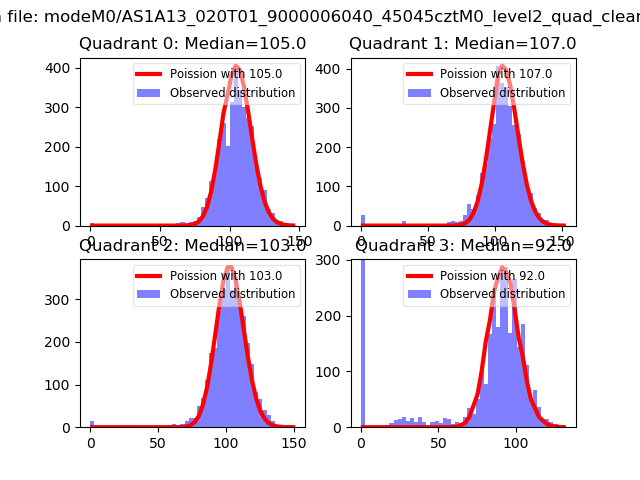 |
 |
| Quadrant-wise count rates Data is divided into 100 sec bins |
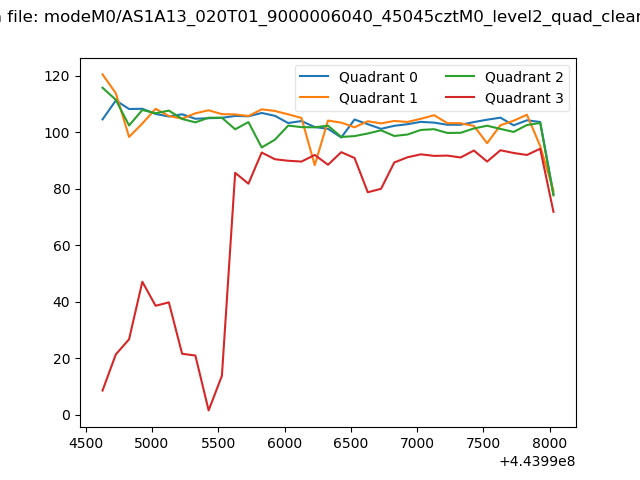 |
|
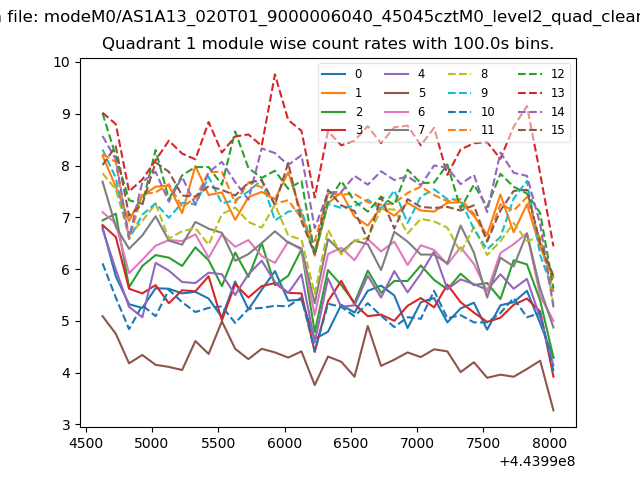
| Module-wise count rates for Quadrant A Data is divided into 100 sec bins |
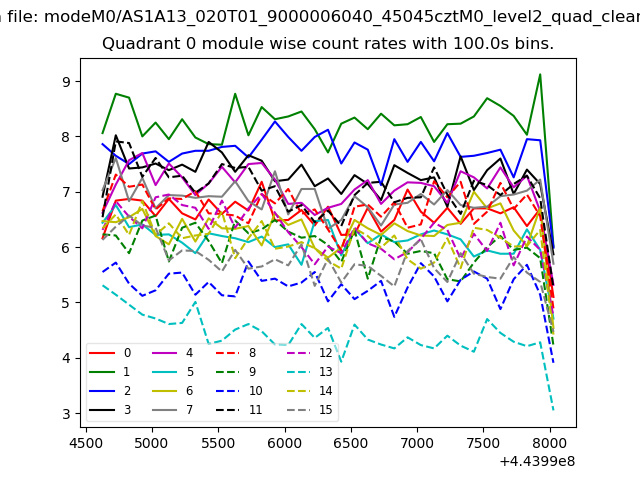 |
 |
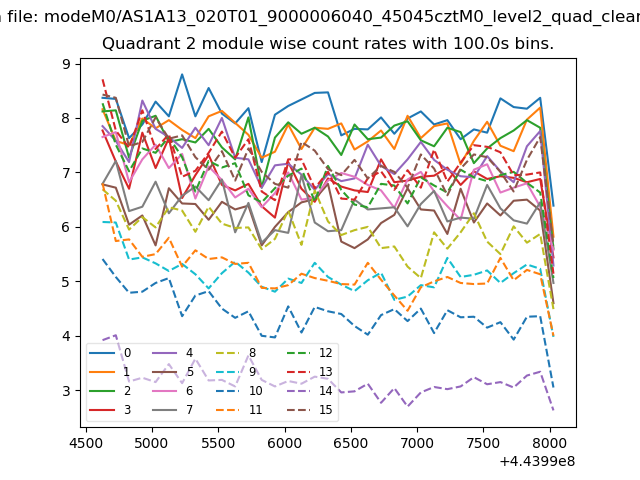
| Module-wise count rates for Quadrant B Data is divided into 100 sec bins |
 |
 |
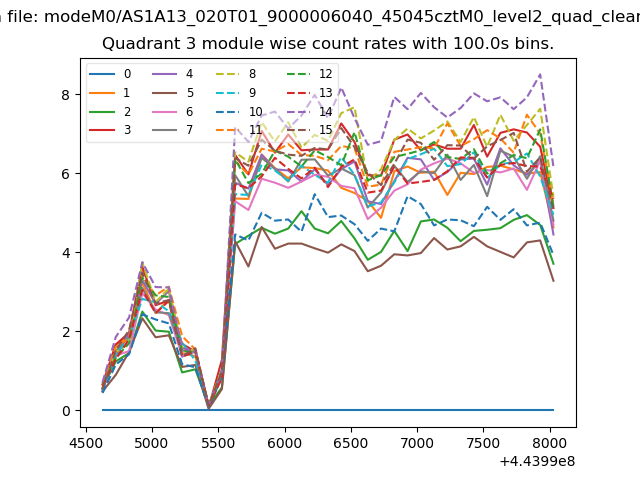
| Module-wise count rates for Quadrant C Data is divided into 100 sec bins |
 |
 |
| Module-wise count rates for Quadrant D Data is divided into 100 sec bins |
 |
 |
| Parameter | Plot |
|---|---|
| CZT HV Monitor | 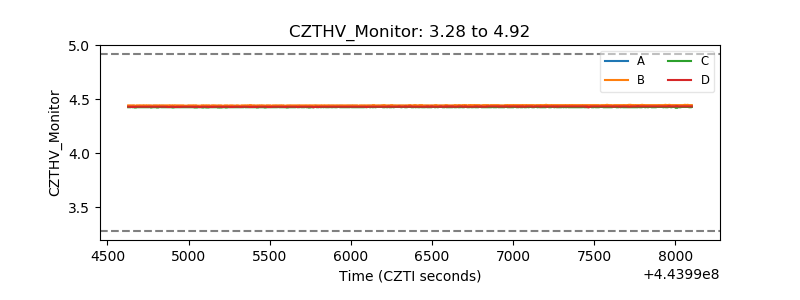 |
| D_VDD | 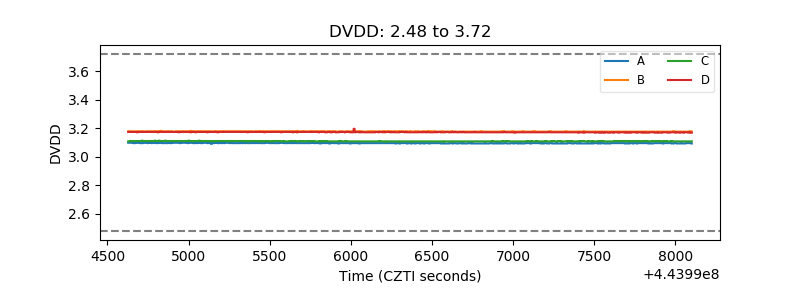 |
| Temperature 1 | 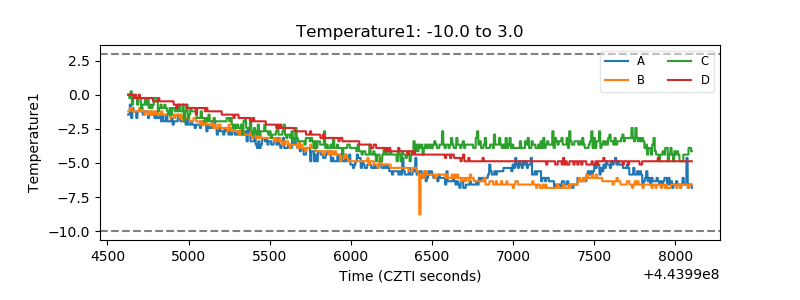 |
| Veto HV Monitor | 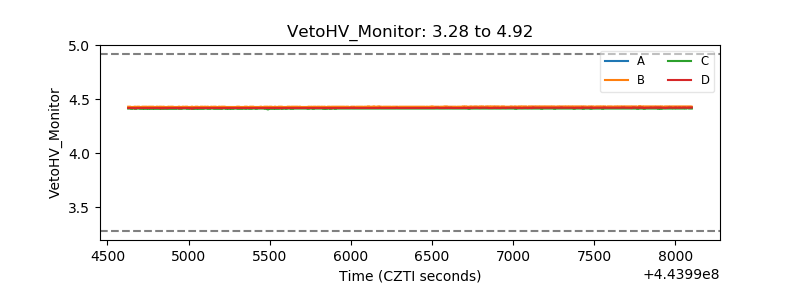 |
| Veto LLD | 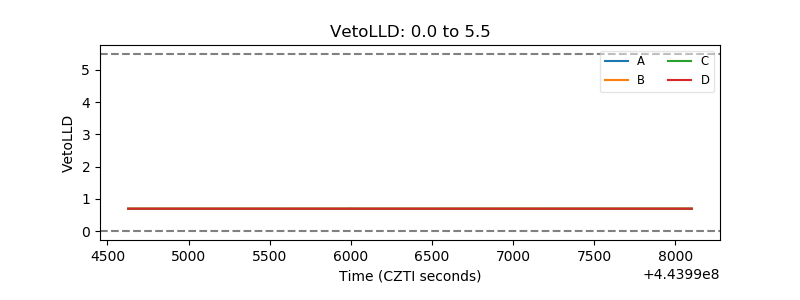 |
| Alpha Counter | 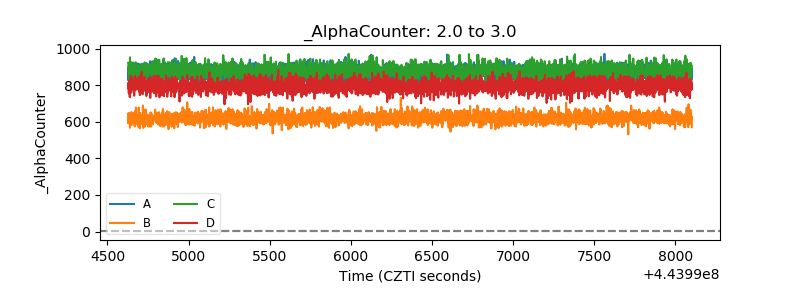 |
| _CPM_Rate | 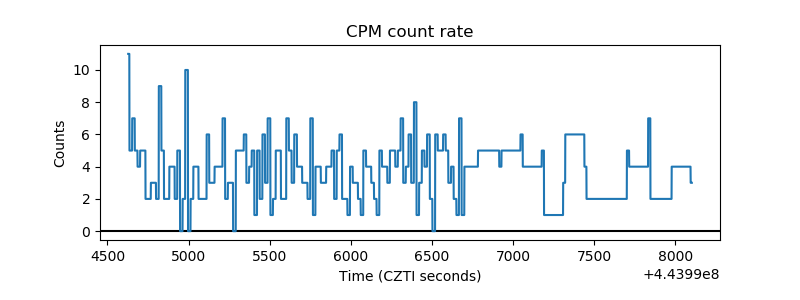 |
| CZT Counter | 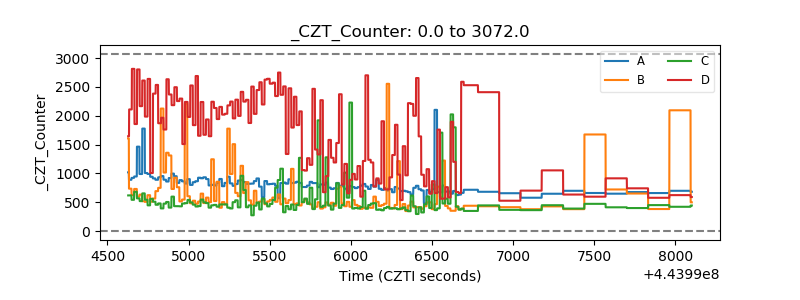 |
| +2.5 Volts monitor | 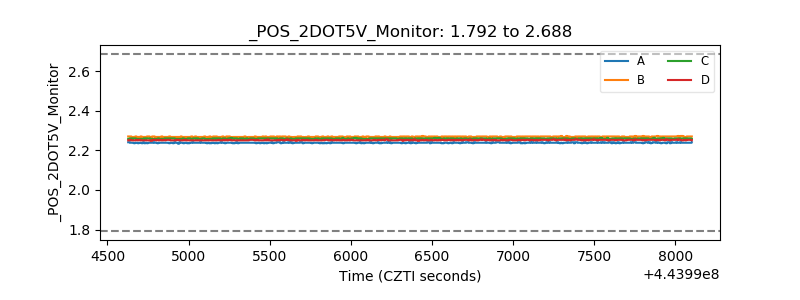 |
| +5 Volts monitor | 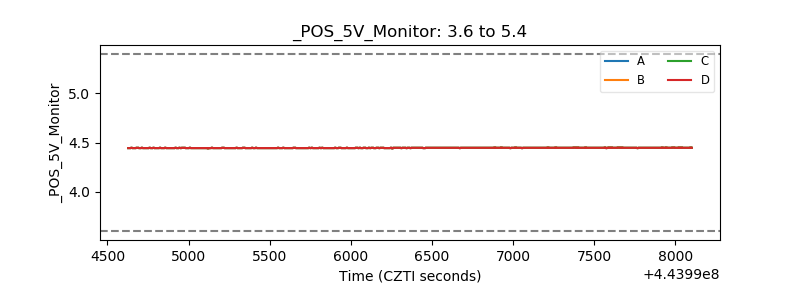 |
| _ROLL_ROT | 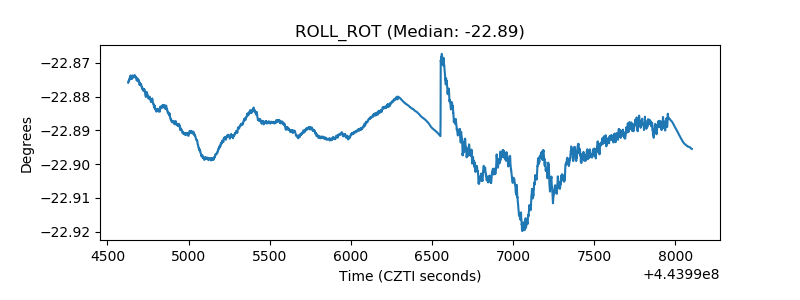 |
| _Roll_DEC | 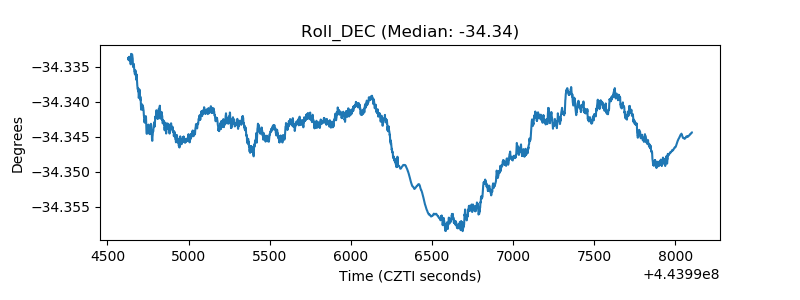 |
| _Roll_RA |  |
| Veto Counter | 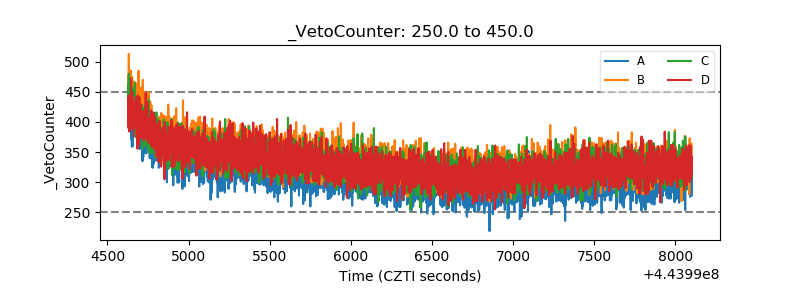 |