| Param | Original file | Final file |
|---|---|---|
| Filename | modeM0/AS1A13_020T01_9000006040_45048cztM0_level2.fits | modeM0/AS1A13_020T01_9000006040_45048cztM0_level2_quad_clean.evt |
| Size (bytes) | 721,146,240 | 138,384,000 |
| Size | 687.7 MB | 132.0 MB |
| Events in quadrant A | 6,969,573 | 940,670 |
| Events in quadrant B | 5,331,398 | 946,153 |
| Events in quadrant C | 4,472,937 | 933,153 |
| Events in quadrant D | 9,237,612 | 757,266 |
| Mode SS | |||
|---|---|---|---|
| Quadrant | BADHDUFLAG | Total packets | Discarded packets |
| A | 0 | 176 | 0 |
| B | 0 | 176 | 0 |
| C | 0 | 176 | 0 |
| D | 0 | 176 | 0 |
| Mode M0 | |||
|---|---|---|---|
| Quadrant | BADHDUFLAG | Total packets | Discarded packets |
| A | 0 | 27477 | 7 |
| B | 0 | 21940 | 0 |
| C | 0 | 19615 | 0 |
| D | 0 | 33631 | 19 |
| Quadrant | Total seconds | Saturated seconds | Saturation percentage |
|---|---|---|---|
| A | 8823 | 183 | 2.074124% |
| B | 8827 | 394 | 4.463578% |
| C | 8827 | 132 | 1.495412% |
| D | 8822 | 1185 | 13.432328% |
Noise dominated data is calculated using 1-second bins in cleaned event files. If a bin has >2000 counts, and if more than 50% of those come from <1% of pixels, then it is considered to be noise-dominated and hence unusable.
| Quadrant | # 1 sec bins | Bins with >0 counts | Bins with >2000 counts | High rate bins dominated by noise | Noise dominated (total time) | Noise dominated (detector-on time) | Marked lightcurve |
|---|---|---|---|---|---|---|---|
| A | 8826 | 8825 | 32 | 32 | 0.36% | 0.36% | 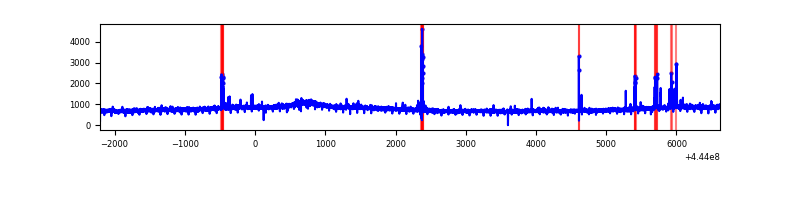 |
| B | 8827 | 8827 | 168 | 168 | 1.90% | 1.90% | 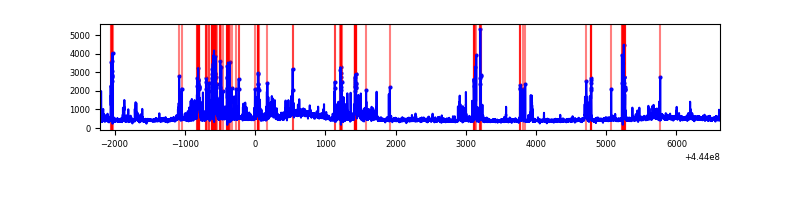 |
| C | 8827 | 8827 | 79 | 79 | 0.89% | 0.89% | 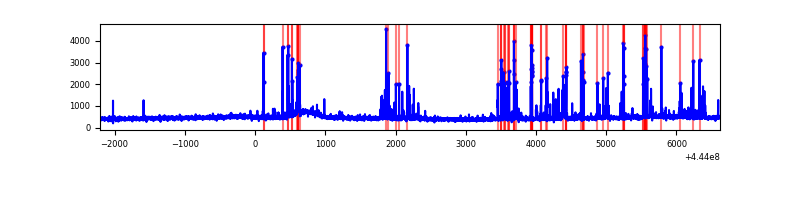 |
| D | 8827 | 8825 | 910 | 910 | 10.31% | 10.31% | 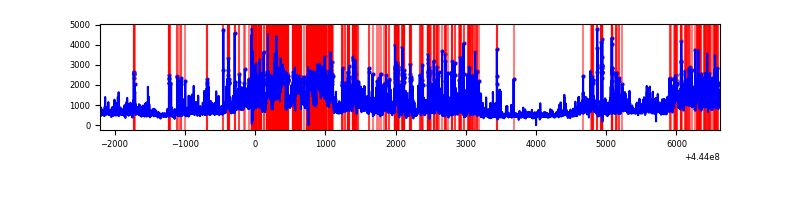 |
Top three noisy pixels from each quadrant. If the there are fewer than three noisy pixels in the level2.evt file, extra rows are filled as -1
| Pixel properties | Quadrant properties | ||||||
|---|---|---|---|---|---|---|---|
| Quadrant | DetID | PixID | Counts | Sigma | Mean | Median | Sigma |
| A | 10 | 83 | 2904763 | 13752.49 | 1004 | 981 | 211.1 |
| A | 15 | 174 | 104192 | 488.81 | 1004 | 981 | 211.1 |
| A | 13 | 248 | 33904 | 155.93 | 1004 | 981 | 211.1 |
| B | 12 | 48 | 557884 | 2879.45 | 986 | 957 | 193.4 |
| B | 0 | 189 | 233943 | 1204.59 | 986 | 957 | 193.4 |
| B | 5 | 255 | 159534 | 819.88 | 986 | 957 | 193.4 |
| C | 14 | 254 | 475643 | 2058.06 | 986 | 994 | 230.6 |
| C | 12 | 250 | 120188 | 516.82 | 986 | 994 | 230.6 |
| C | 1 | 3 | 8946 | 34.48 | 986 | 994 | 230.6 |
| D | 13 | 174 | 1612274 | 6852.08 | 940 | 914 | 235.2 |
| D | 13 | 187 | 643585 | 2732.87 | 940 | 914 | 235.2 |
| D | 11 | 241 | 537522 | 2281.85 | 940 | 914 | 235.2 |
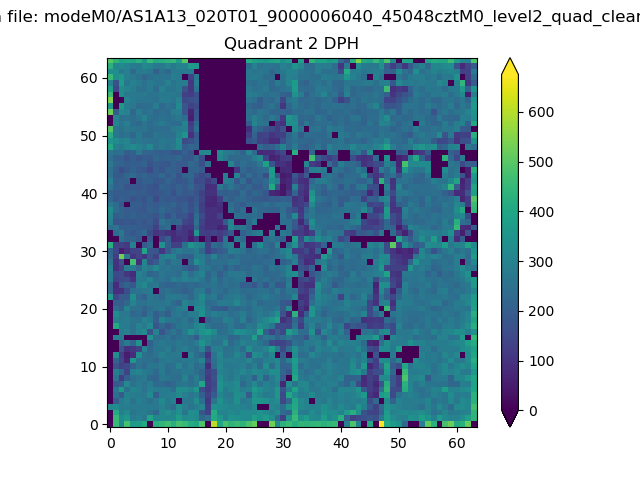
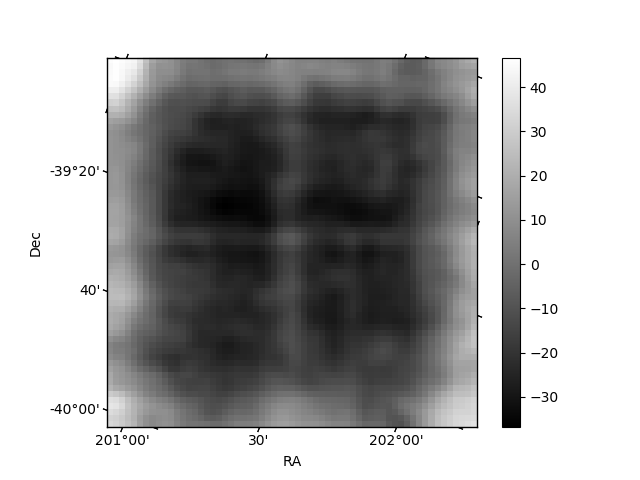
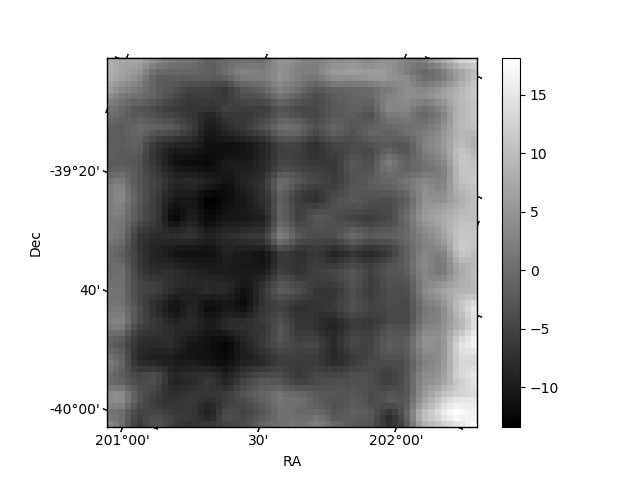
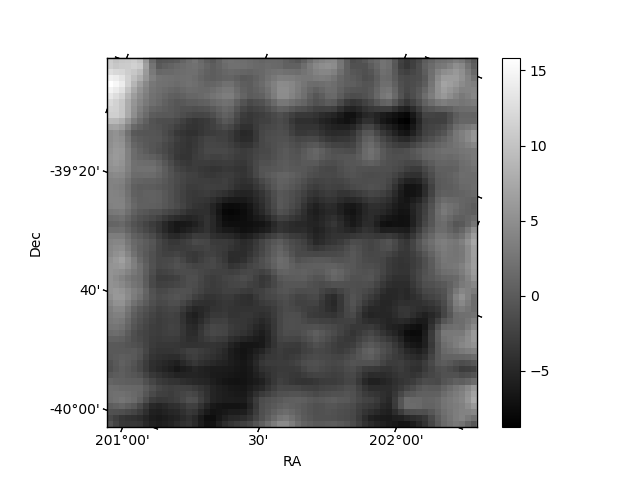
Histogram calculated using DETX and DETY for each event in the final _common_clean file
| Quadrant A | 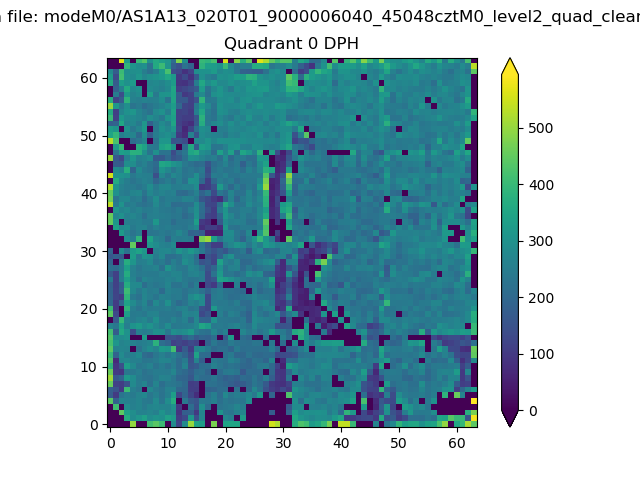 |
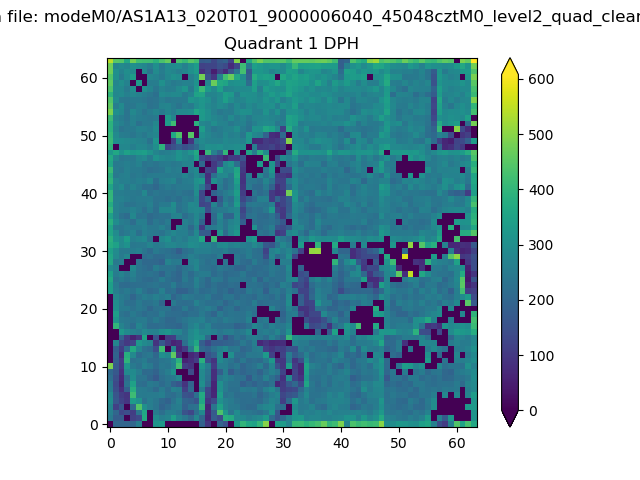 |
Quadrant B |
|---|---|---|---|
| Quadrant D | 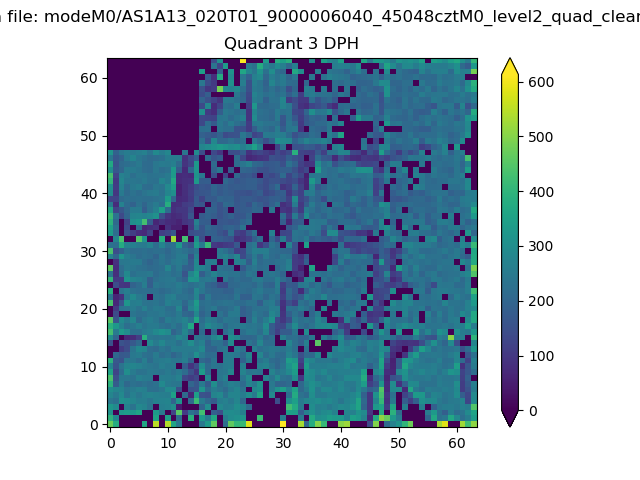 |
 |
Quadrant C |
| Plot type | Count rate plots | Images |
|---|---|---|
| Comparison with Poisson distribution Blue bars denote a histogram of data divided into 1 sec bins. Red curve is a Poisson curve with rate = median count rate of data. |
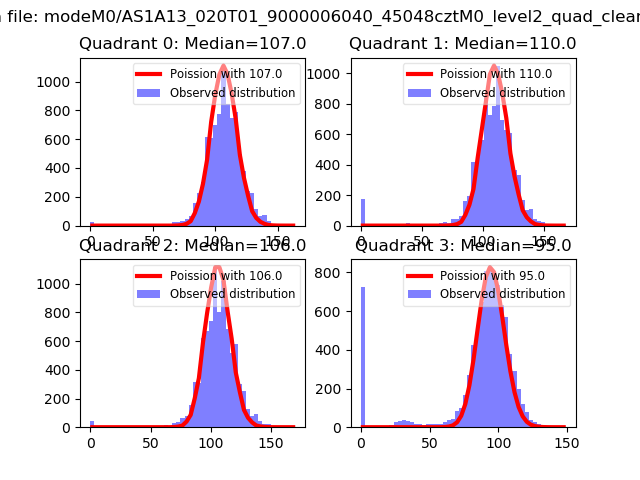 |
 |
| Quadrant-wise count rates Data is divided into 100 sec bins |
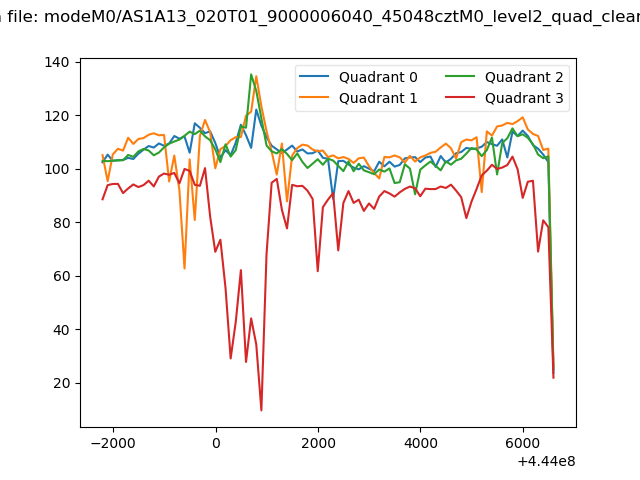 |
|
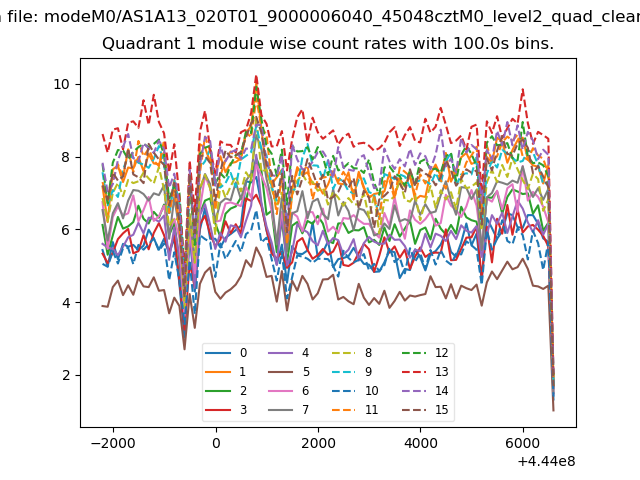
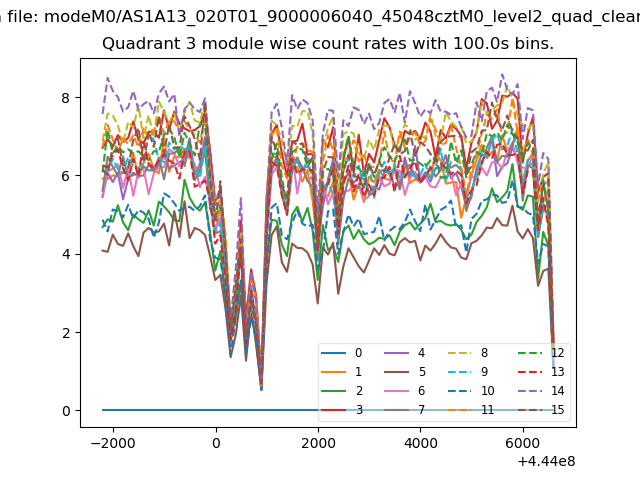
| Module-wise count rates for Quadrant A Data is divided into 100 sec bins |
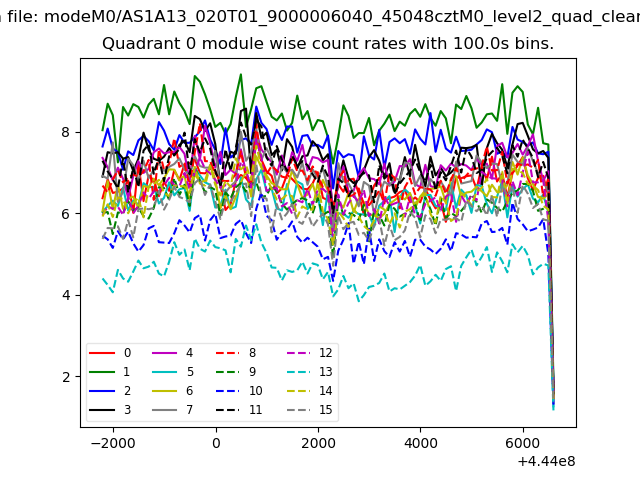 |
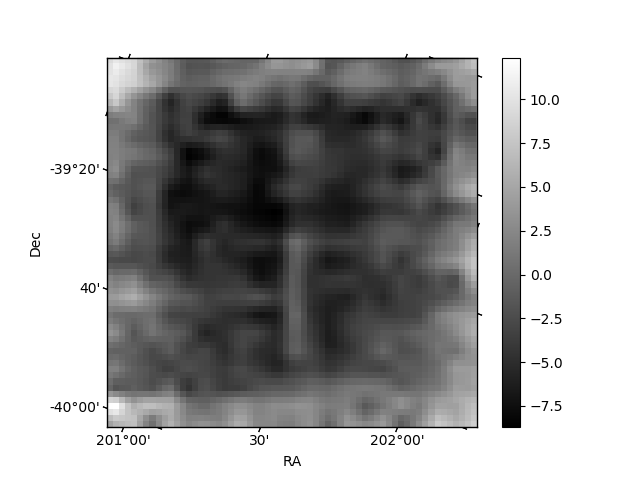 |
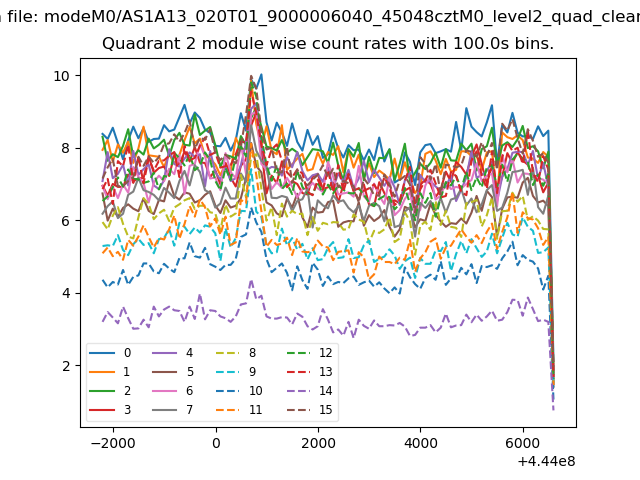
| Module-wise count rates for Quadrant B Data is divided into 100 sec bins |
 |
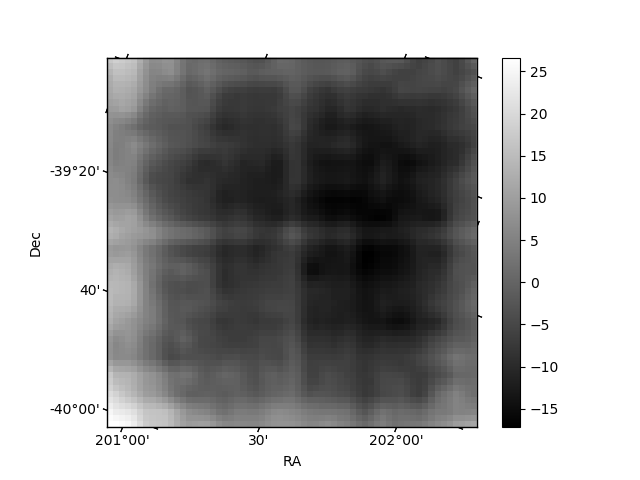 |
| Module-wise count rates for Quadrant C Data is divided into 100 sec bins |
 |
 |
| Module-wise count rates for Quadrant D Data is divided into 100 sec bins |
 |
 |
| Parameter | Plot |
|---|---|
| CZT HV Monitor | 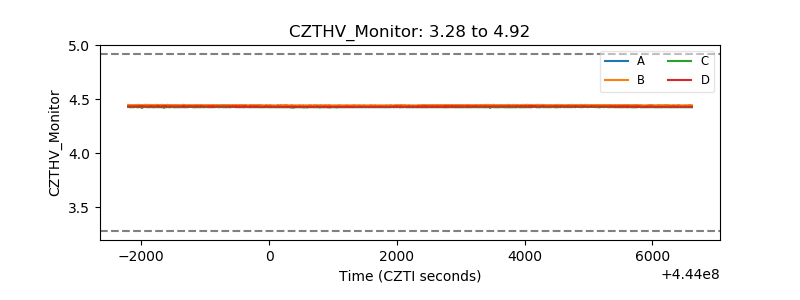 |
| D_VDD | 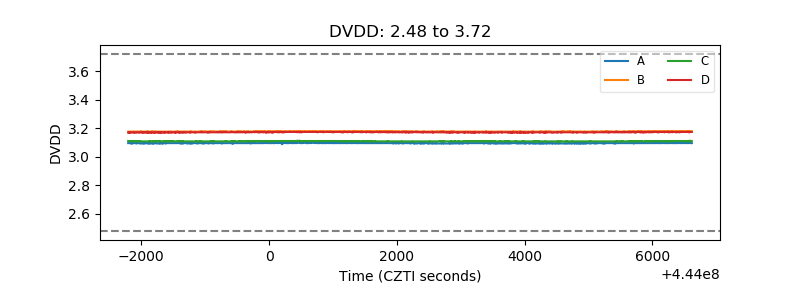 |
| Temperature 1 | 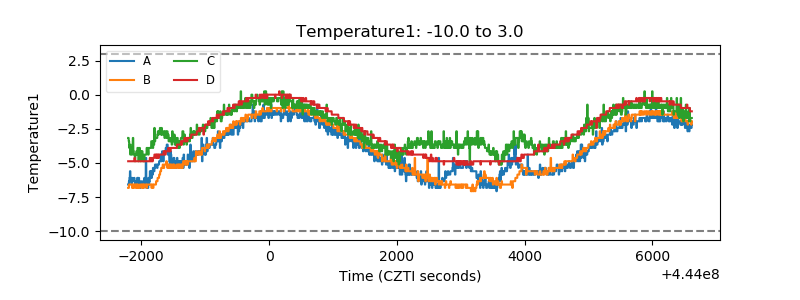 |
| Veto HV Monitor | 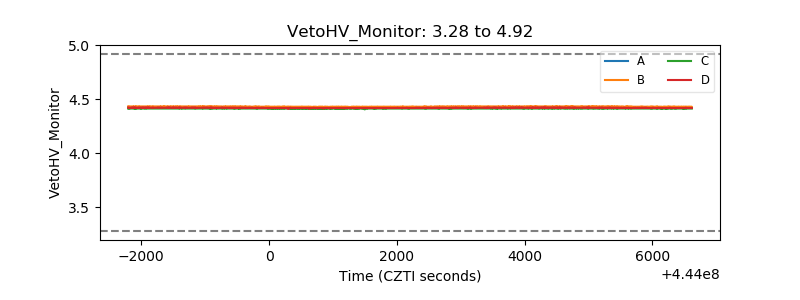 |
| Veto LLD | 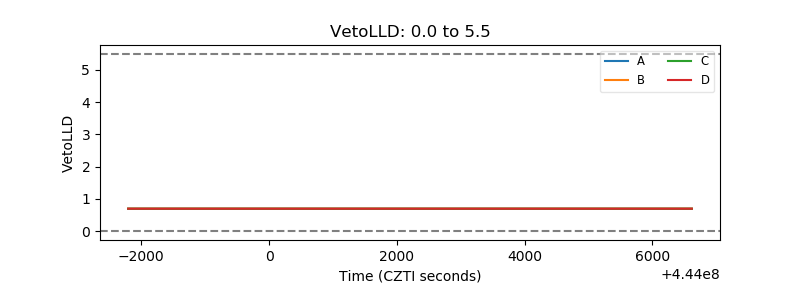 |
| Alpha Counter | 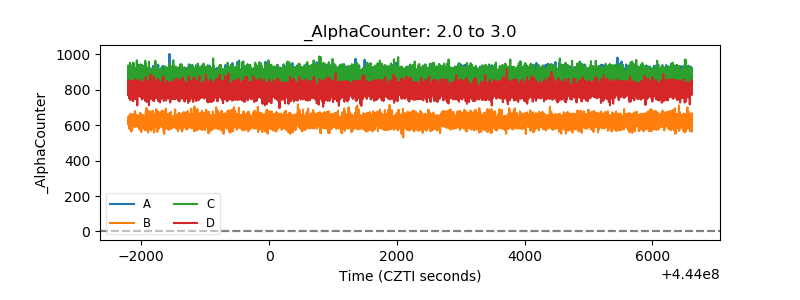 |
| _CPM_Rate | 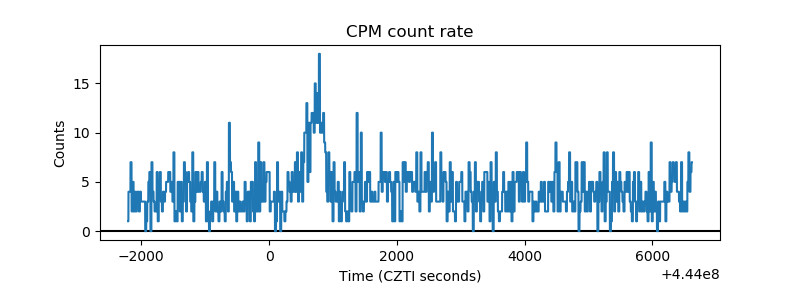 |
| CZT Counter | 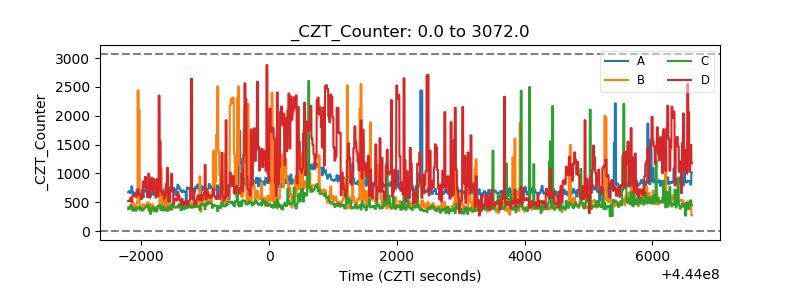 |
| +2.5 Volts monitor | 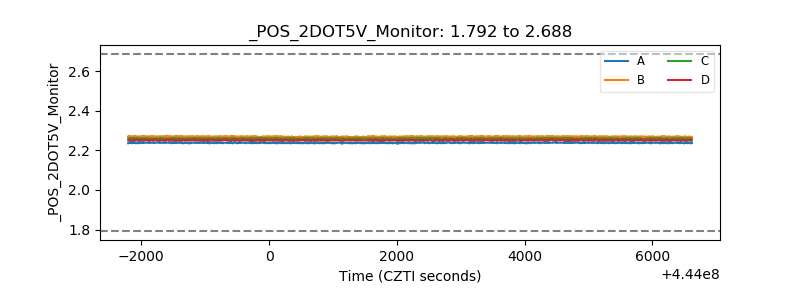 |
| +5 Volts monitor | 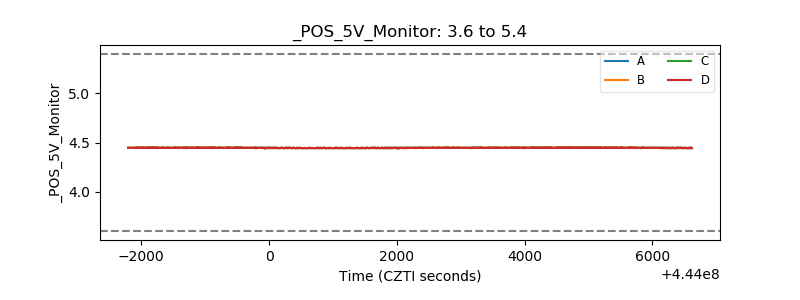 |
| _ROLL_ROT | 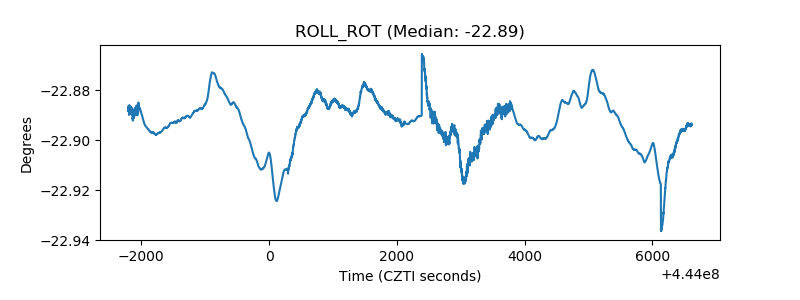 |
| _Roll_DEC | 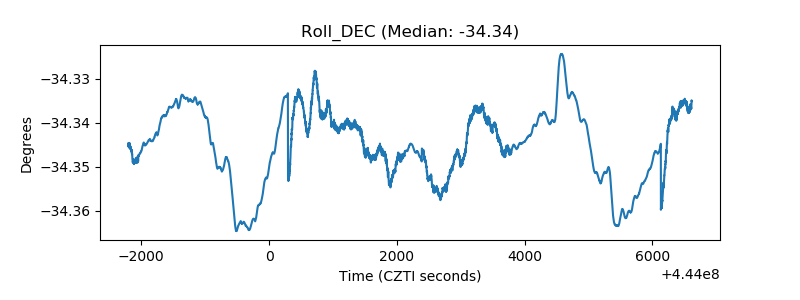 |
| _Roll_RA |  |
| Veto Counter | 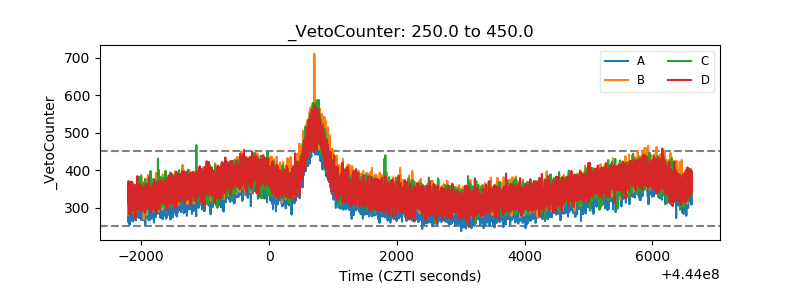 |