| Param | Original file | Final file |
|---|---|---|
| Filename | modeM0/AS1A13_020T01_9000006040_45049cztM0_level2.fits | modeM0/AS1A13_020T01_9000006040_45049cztM0_level2_quad_clean.evt |
| Size (bytes) | 1,525,121,280 | 300,481,920 |
| Size | 1.4 GB | 286.6 MB |
| Events in quadrant A | 15,271,385 | 2,004,147 |
| Events in quadrant B | 10,766,794 | 2,038,564 |
| Events in quadrant C | 10,047,866 | 1,996,147 |
| Events in quadrant D | 18,881,615 | 1,729,424 |
| Mode SS | |||
|---|---|---|---|
| Quadrant | BADHDUFLAG | Total packets | Discarded packets |
| A | 0 | 396 | 0 |
| B | 0 | 396 | 0 |
| C | 0 | 396 | 0 |
| D | 0 | 396 | 0 |
| Mode M9 | |||
|---|---|---|---|
| Quadrant | BADHDUFLAG | Total packets | Discarded packets |
| A | 0 | 24 | 0 |
| B | 0 | 24 | 0 |
| C | 0 | 24 | 0 |
| D | 0 | 24 | 0 |
| Mode M0 | |||
|---|---|---|---|
| Quadrant | BADHDUFLAG | Total packets | Discarded packets |
| A | 0 | 60350 | 4 |
| B | 0 | 45287 | 4 |
| C | 0 | 43556 | 4 |
| D | 0 | 69662 | 4 |
| Quadrant | Total seconds | Saturated seconds | Saturation percentage |
|---|---|---|---|
| A | 19277 | 362 | 1.877886% |
| B | 19278 | 667 | 3.459902% |
| C | 19278 | 377 | 1.955597% |
| D | 19278 | 1488 | 7.718643% |
Noise dominated data is calculated using 1-second bins in cleaned event files. If a bin has >2000 counts, and if more than 50% of those come from <1% of pixels, then it is considered to be noise-dominated and hence unusable.
| Quadrant | # 1 sec bins | Bins with >0 counts | Bins with >2000 counts | High rate bins dominated by noise | Noise dominated (total time) | Noise dominated (detector-on time) | Marked lightcurve |
|---|---|---|---|---|---|---|---|
| A | 21837 | 19282 | 36 | 36 | 0.16% | 0.19% | 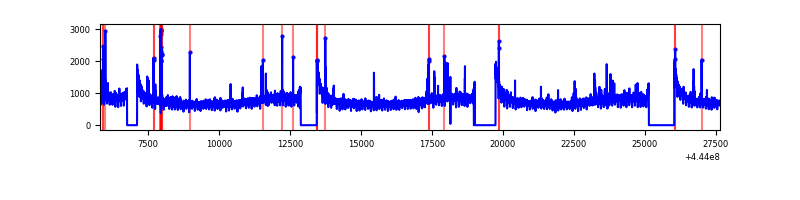 |
| B | 21838 | 19283 | 301 | 301 | 1.38% | 1.56% | 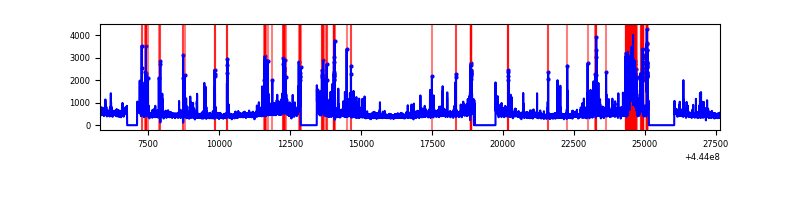 |
| C | 21838 | 19283 | 232 | 232 | 1.06% | 1.20% | 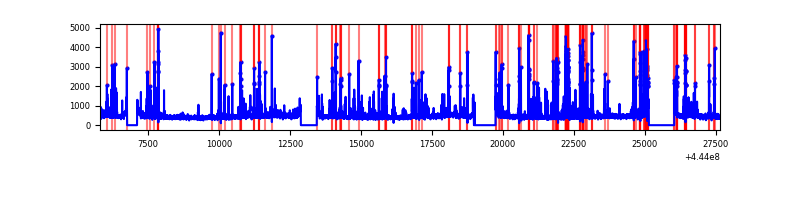 |
| D | 21838 | 19283 | 1001 | 1001 | 4.58% | 5.19% | 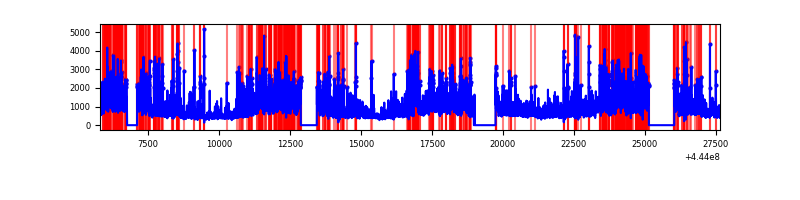 |
Top three noisy pixels from each quadrant. If the there are fewer than three noisy pixels in the level2.evt file, extra rows are filled as -1
| Pixel properties | Quadrant properties | ||||||
|---|---|---|---|---|---|---|---|
| Quadrant | DetID | PixID | Counts | Sigma | Mean | Median | Sigma |
| A | 10 | 83 | 6668543 | 14869.08 | 2155 | 2107 | 448.3 |
| A | 15 | 174 | 105408 | 230.41 | 2155 | 2107 | 448.3 |
| A | 7 | 3 | 71806 | 155.46 | 2155 | 2107 | 448.3 |
| B | 4 | 171 | 848498 | 2015.3 | 2142 | 2075 | 420.0 |
| B | 0 | 186 | 273857 | 647.1 | 2142 | 2075 | 420.0 |
| B | 0 | 190 | 205623 | 484.64 | 2142 | 2075 | 420.0 |
| C | 14 | 254 | 1324409 | 2656.45 | 2125 | 2136 | 497.8 |
| C | 15 | 208 | 224503 | 446.74 | 2125 | 2136 | 497.8 |
| C | 12 | 250 | 105351 | 207.36 | 2125 | 2136 | 497.8 |
| D | 13 | 174 | 5345558 | 10278.76 | 2068 | 2009 | 519.9 |
| D | 13 | 249 | 1342622 | 2578.78 | 2068 | 2009 | 519.9 |
| D | 11 | 241 | 1268806 | 2436.79 | 2068 | 2009 | 519.9 |
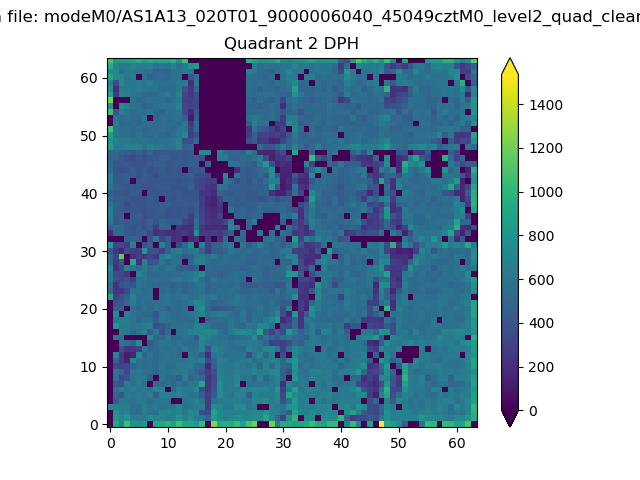
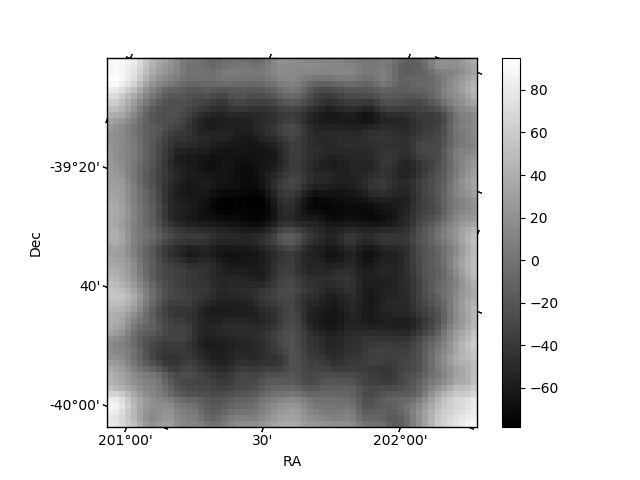
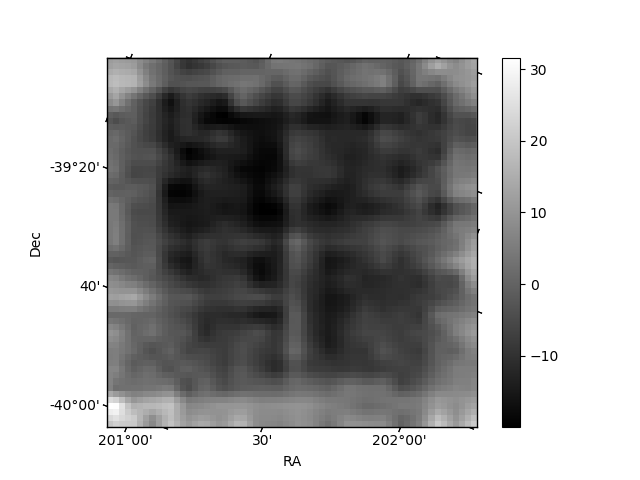
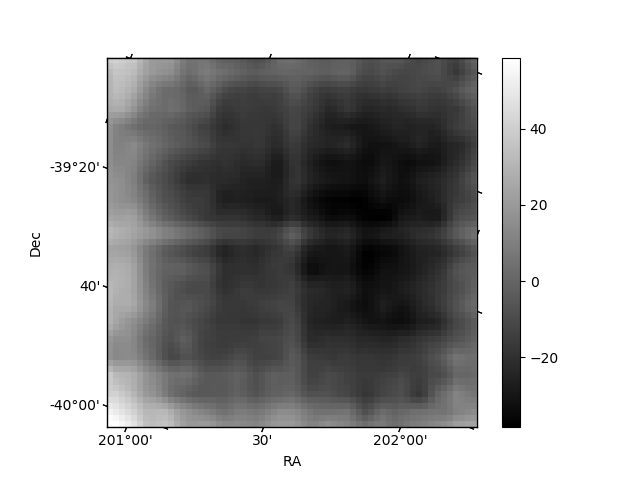
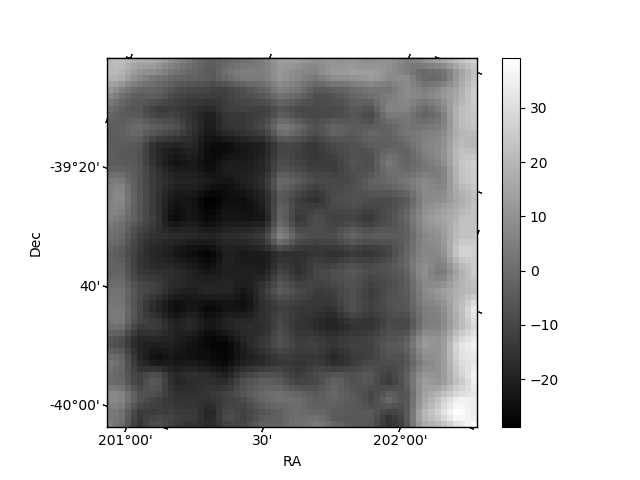
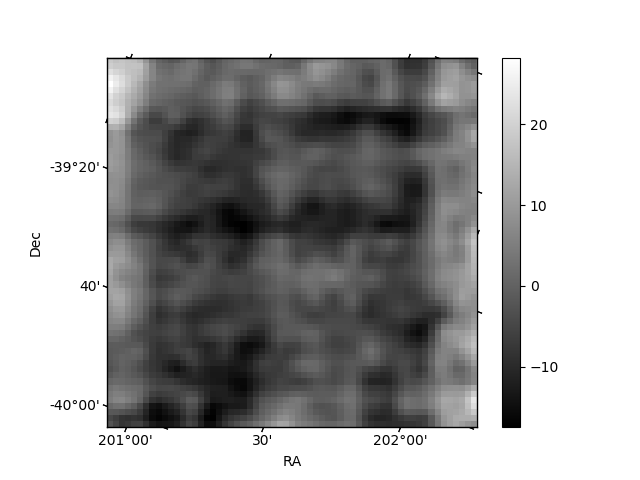
Histogram calculated using DETX and DETY for each event in the final _common_clean file
| Quadrant A | 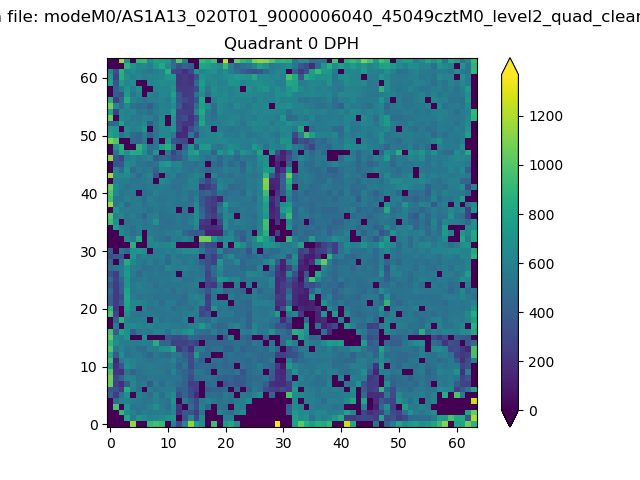 |
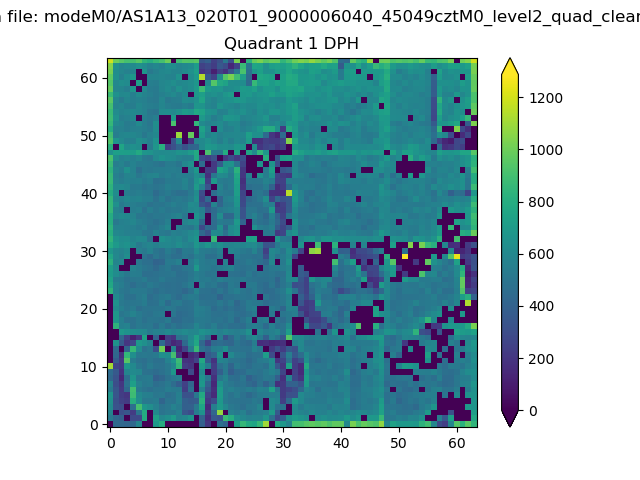 |
Quadrant B |
|---|---|---|---|
| Quadrant D | 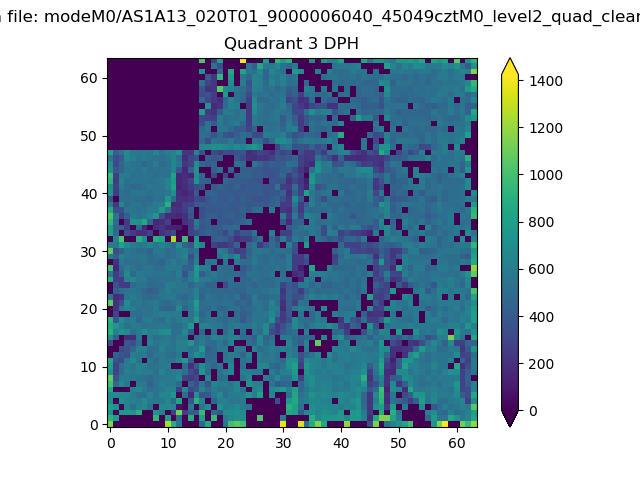 |
 |
Quadrant C |
| Plot type | Count rate plots | Images |
|---|---|---|
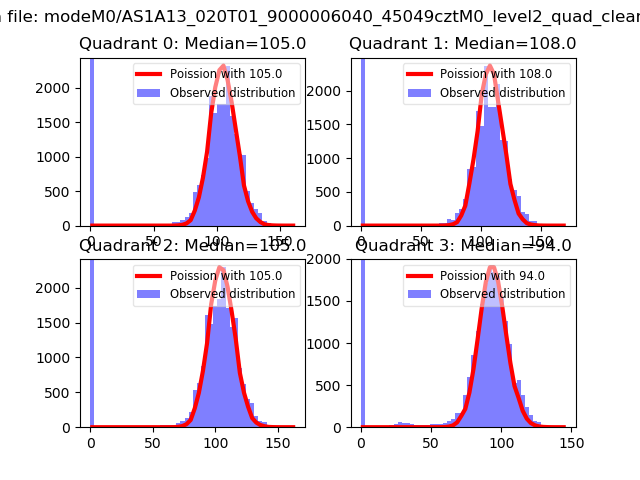
| Comparison with Poisson distribution Blue bars denote a histogram of data divided into 1 sec bins. Red curve is a Poisson curve with rate = median count rate of data. |
 |
 |
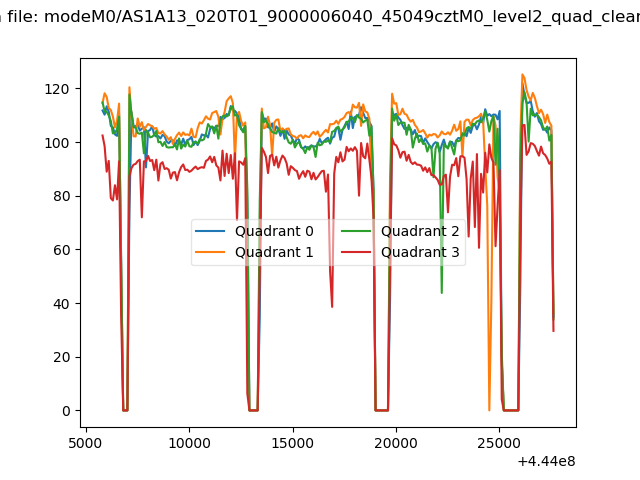
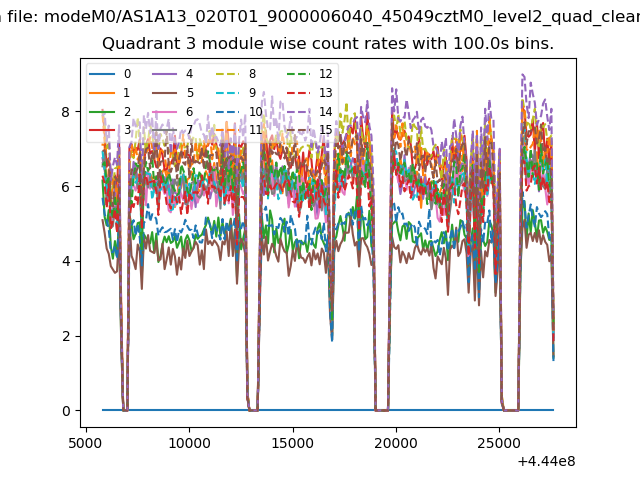
| Quadrant-wise count rates Data is divided into 100 sec bins |
 |
|
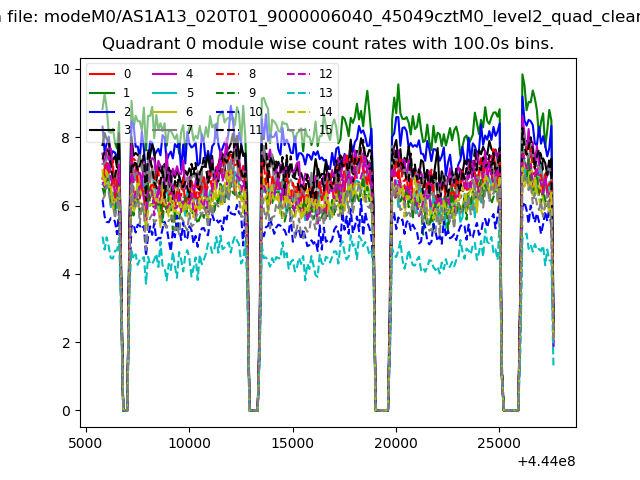
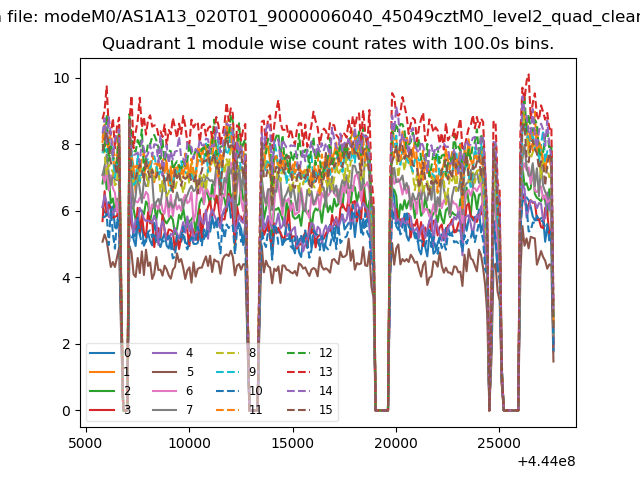
| Module-wise count rates for Quadrant A Data is divided into 100 sec bins |
 |
 |
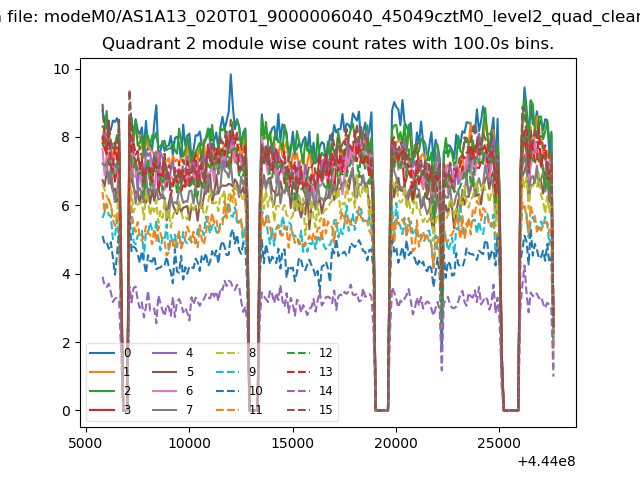
| Module-wise count rates for Quadrant B Data is divided into 100 sec bins |
 |
 |
| Module-wise count rates for Quadrant C Data is divided into 100 sec bins |
 |
 |
| Module-wise count rates for Quadrant D Data is divided into 100 sec bins |
 |
 |
| Parameter | Plot |
|---|---|
| CZT HV Monitor | 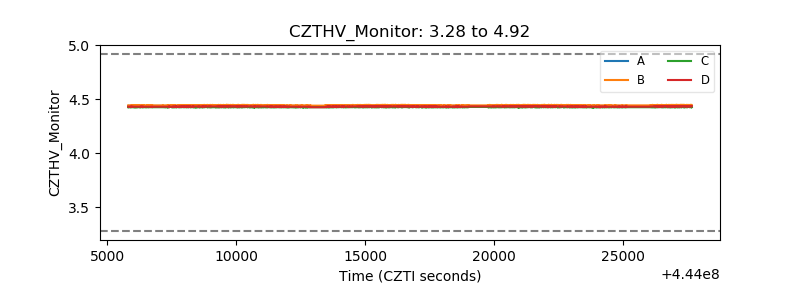 |
| D_VDD | 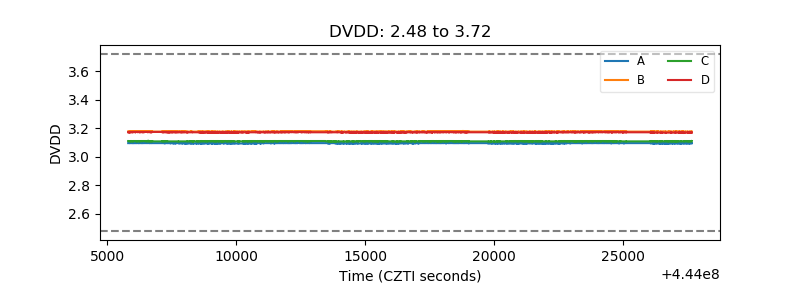 |
| Temperature 1 | 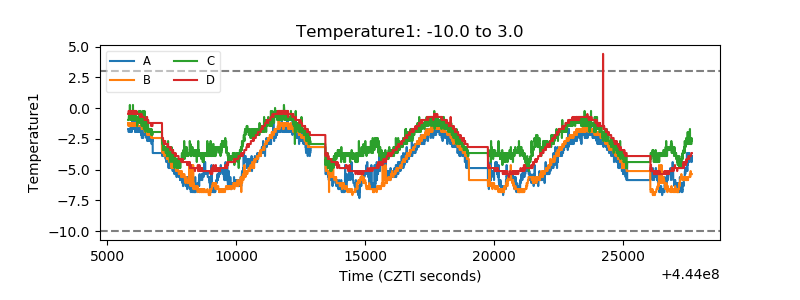 |
| Veto HV Monitor |  |
| Veto LLD | 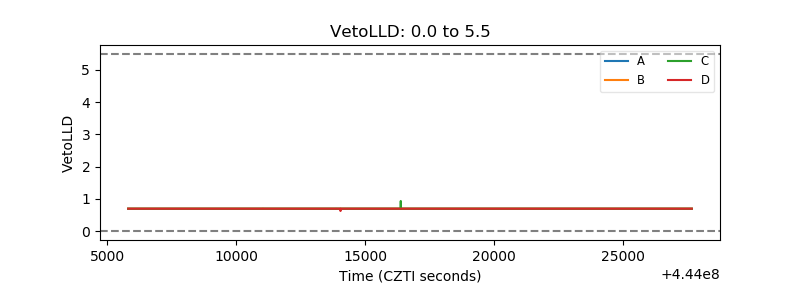 |
| Alpha Counter | 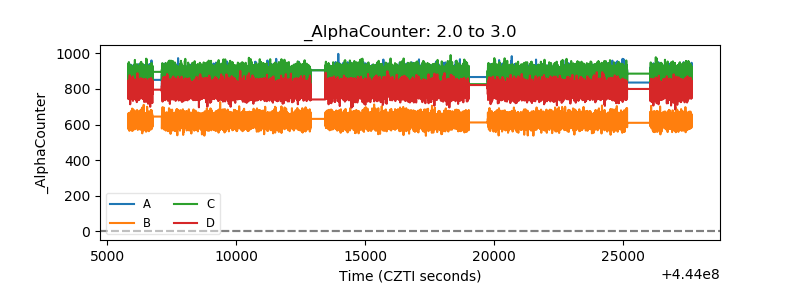 |
| _CPM_Rate | 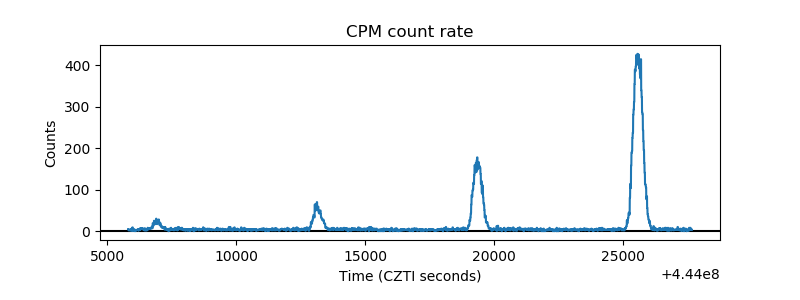 |
| CZT Counter | 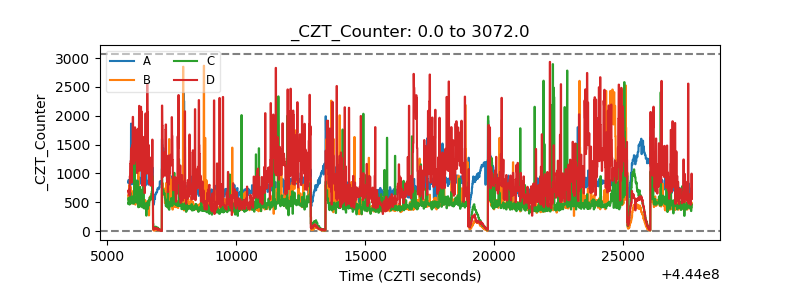 |
| +2.5 Volts monitor | 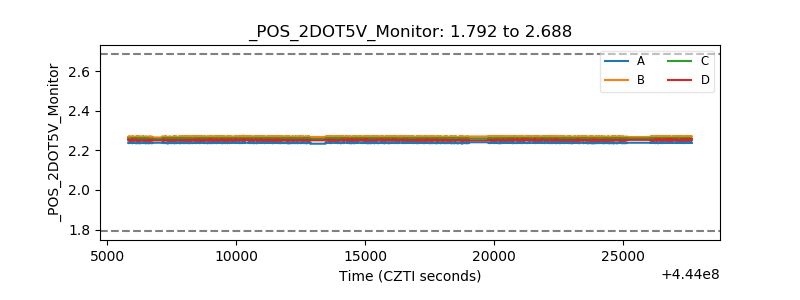 |
| +5 Volts monitor | 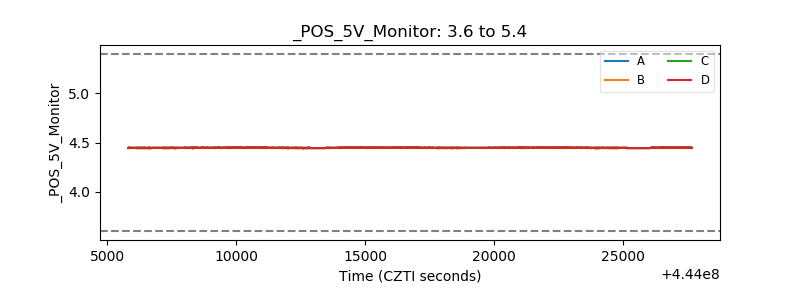 |
| _ROLL_ROT | 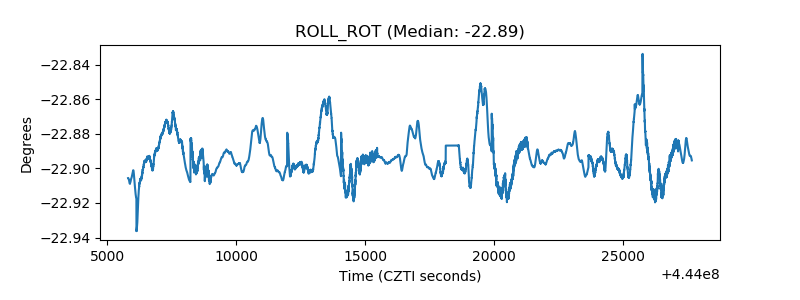 |
| _Roll_DEC | 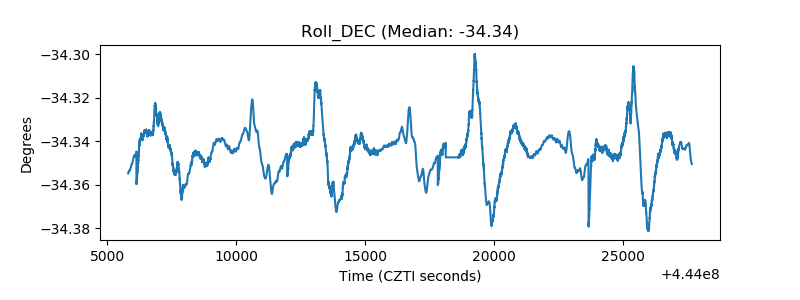 |
| _Roll_RA | 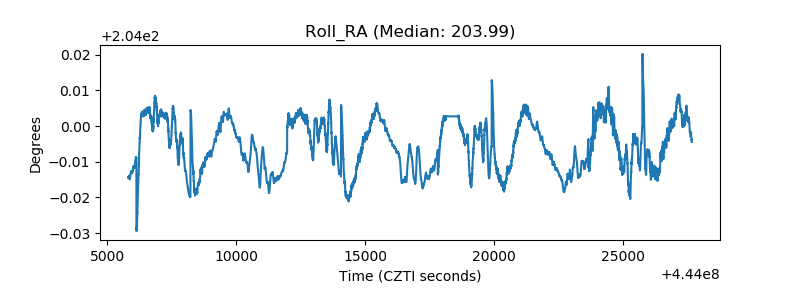 |
| Veto Counter | 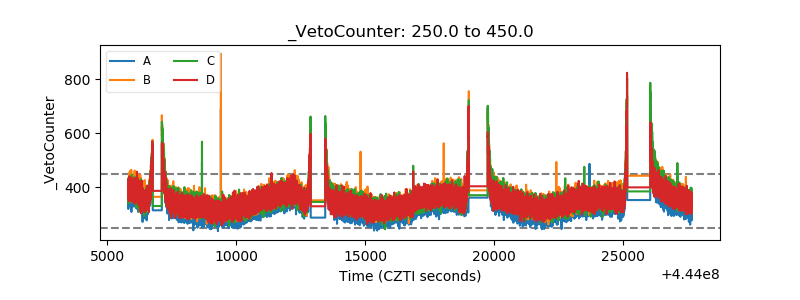 |