| Param | Original file | Final file |
|---|---|---|
| Filename | modeM0/AS1A13_020T01_9000006040_45051cztM0_level2.fits | modeM0/AS1A13_020T01_9000006040_45051cztM0_level2_quad_clean.evt |
| Size (bytes) | 552,395,520 | 111,346,560 |
| Size | 526.8 MB | 106.2 MB |
| Events in quadrant A | 5,631,238 | 741,149 |
| Events in quadrant B | 3,565,179 | 770,414 |
| Events in quadrant C | 3,555,028 | 746,170 |
| Events in quadrant D | 7,168,392 | 638,293 |
| Mode SS | |||
|---|---|---|---|
| Quadrant | BADHDUFLAG | Total packets | Discarded packets |
| A | 0 | 140 | 0 |
| B | 0 | 140 | 0 |
| C | 0 | 140 | 0 |
| D | 0 | 140 | 0 |
| Mode M9 | |||
|---|---|---|---|
| Quadrant | BADHDUFLAG | Total packets | Discarded packets |
| A | 0 | 13 | 0 |
| B | 0 | 14 | 0 |
| C | 0 | 14 | 0 |
| D | 0 | 14 | 0 |
| Mode M0 | |||
|---|---|---|---|
| Quadrant | BADHDUFLAG | Total packets | Discarded packets |
| A | 0 | 21723 | 2 |
| B | 0 | 15188 | 2 |
| C | 0 | 15263 | 2 |
| D | 0 | 26105 | 2 |
| Quadrant | Total seconds | Saturated seconds | Saturation percentage |
|---|---|---|---|
| A | 6817 | 166 | 2.435089% |
| B | 6817 | 139 | 2.039020% |
| C | 6817 | 133 | 1.951005% |
| D | 6817 | 574 | 8.420126% |
Noise dominated data is calculated using 1-second bins in cleaned event files. If a bin has >2000 counts, and if more than 50% of those come from <1% of pixels, then it is considered to be noise-dominated and hence unusable.
| Quadrant | # 1 sec bins | Bins with >0 counts | Bins with >2000 counts | High rate bins dominated by noise | Noise dominated (total time) | Noise dominated (detector-on time) | Marked lightcurve |
|---|---|---|---|---|---|---|---|
| A | 7822 | 6818 | 8 | 8 | 0.10% | 0.12% | 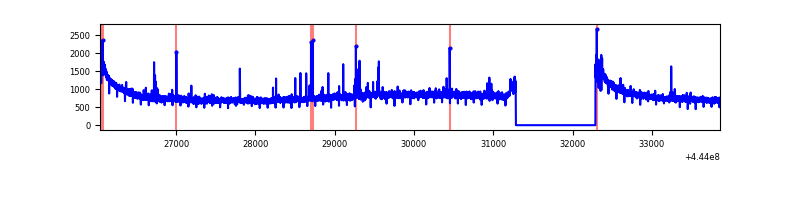 |
| B | 7822 | 6818 | 40 | 40 | 0.51% | 0.59% | 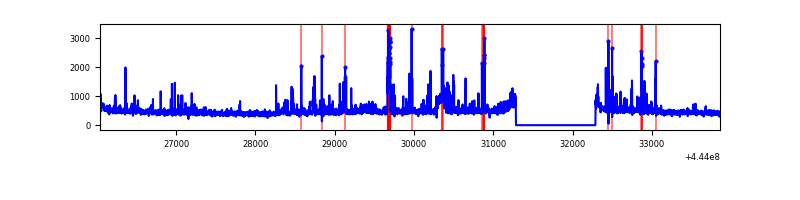 |
| C | 7822 | 6818 | 69 | 69 | 0.88% | 1.01% | 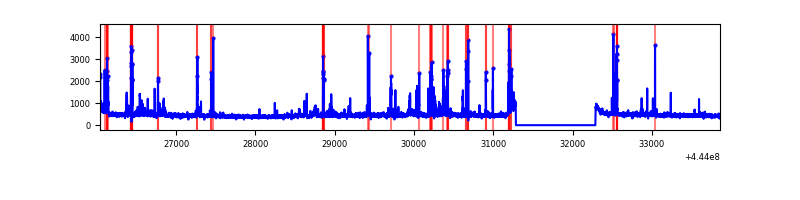 |
| D | 7822 | 6818 | 456 | 456 | 5.83% | 6.69% | 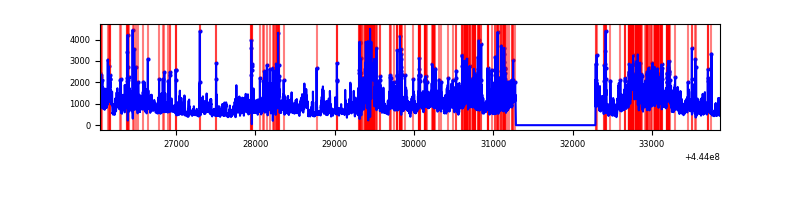 |
Top three noisy pixels from each quadrant. If the there are fewer than three noisy pixels in the level2.evt file, extra rows are filled as -1
| Pixel properties | Quadrant properties | ||||||
|---|---|---|---|---|---|---|---|
| Quadrant | DetID | PixID | Counts | Sigma | Mean | Median | Sigma |
| A | 10 | 83 | 2552935 | 15784.86 | 773 | 754 | 161.7 |
| A | 7 | 3 | 46473 | 282.77 | 773 | 754 | 161.7 |
| A | 13 | 248 | 24374 | 146.09 | 773 | 754 | 161.7 |
| B | 4 | 171 | 189361 | 1226.19 | 774 | 749 | 153.8 |
| B | 5 | 255 | 126540 | 817.78 | 774 | 749 | 153.8 |
| B | 5 | 32 | 52094 | 333.8 | 774 | 749 | 153.8 |
| C | 14 | 254 | 295060 | 1606.5 | 774 | 779 | 183.2 |
| C | 15 | 208 | 139168 | 755.48 | 774 | 779 | 183.2 |
| C | 12 | 250 | 68958 | 372.19 | 774 | 779 | 183.2 |
| D | 11 | 241 | 1317089 | 7029.52 | 743 | 721 | 187.3 |
| D | 13 | 174 | 1305609 | 6968.21 | 743 | 721 | 187.3 |
| D | 13 | 249 | 896259 | 4782.25 | 743 | 721 | 187.3 |
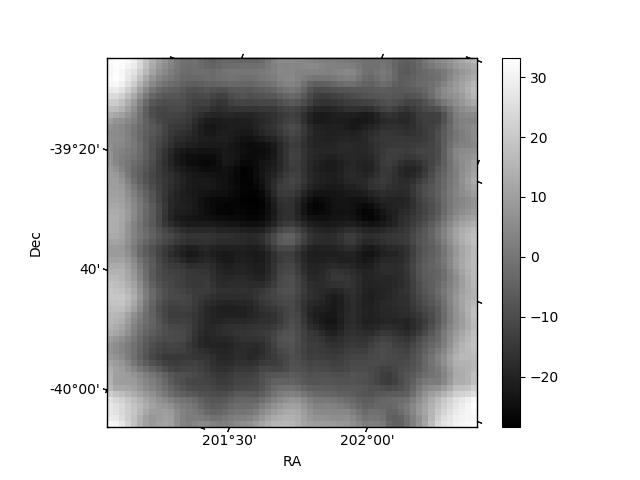
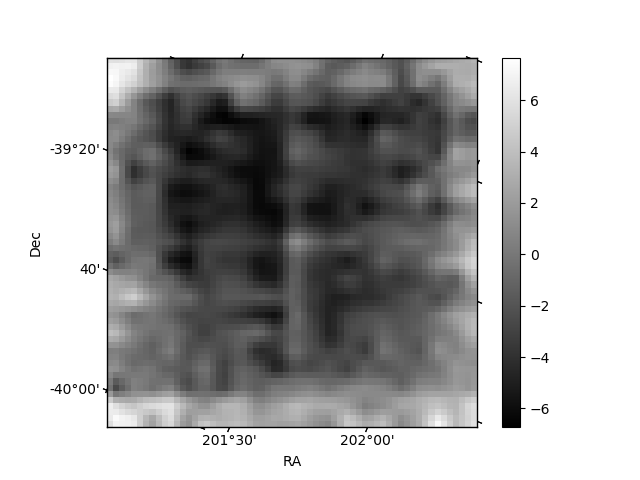
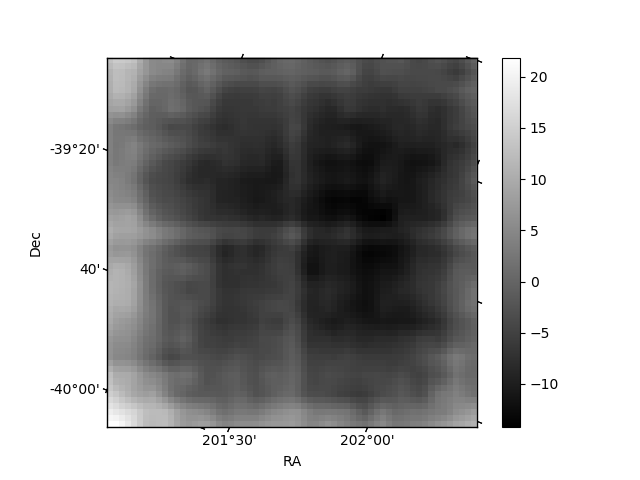
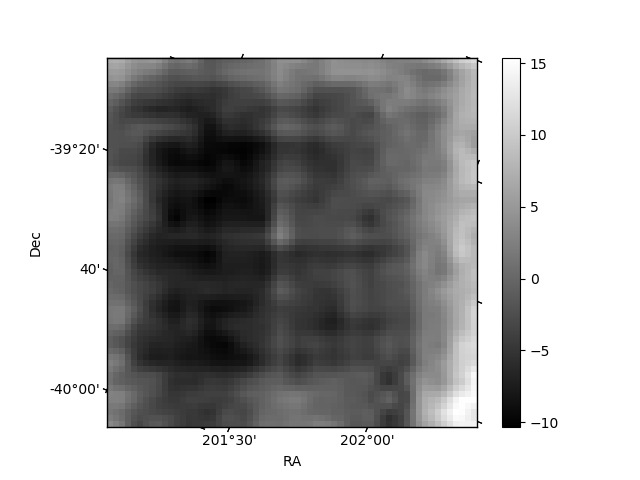
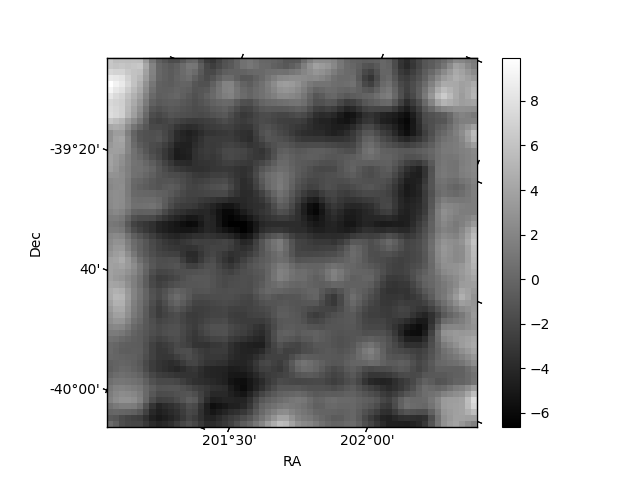
Histogram calculated using DETX and DETY for each event in the final _common_clean file
| Quadrant A | 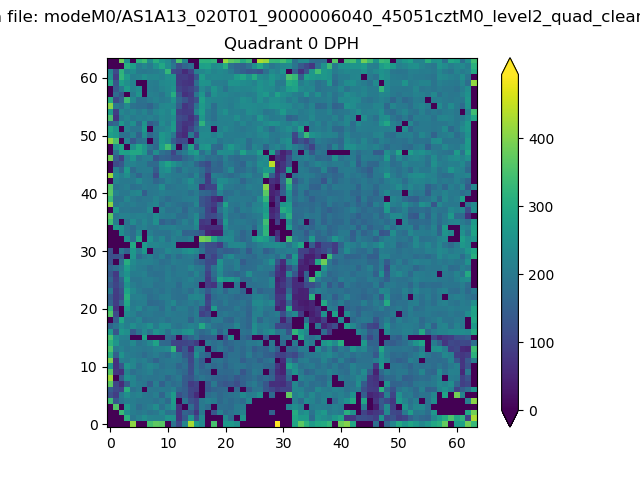 |
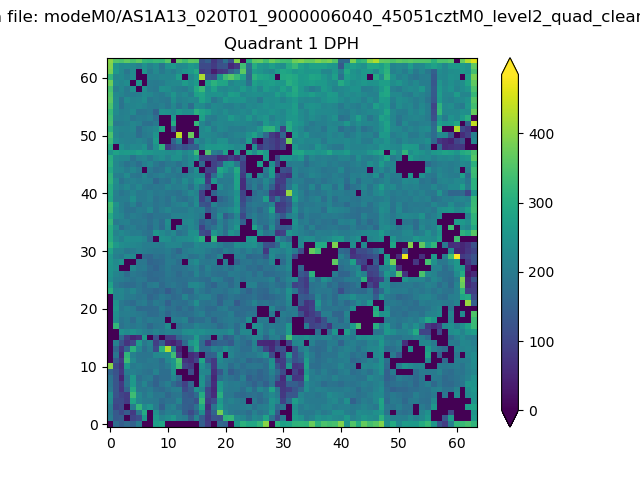 |
Quadrant B |
|---|---|---|---|
| Quadrant D | 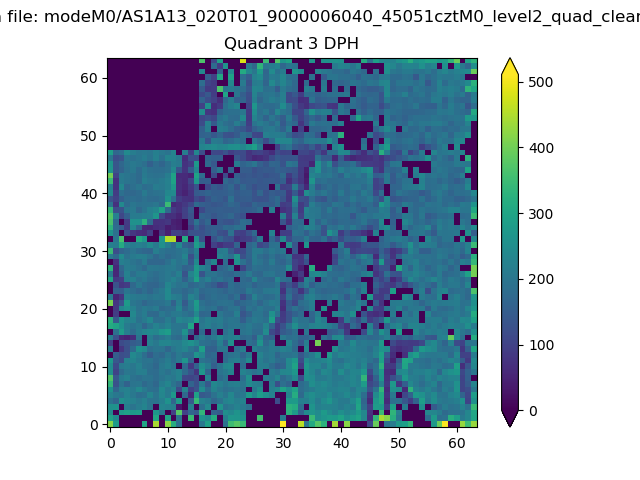 |
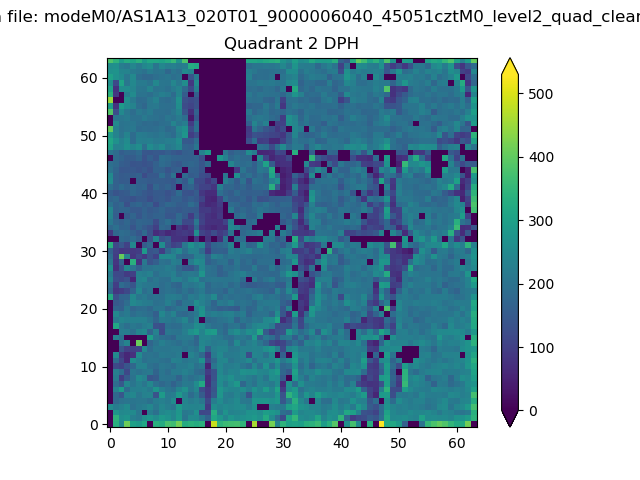 |
Quadrant C |
| Plot type | Count rate plots | Images |
|---|---|---|
| Comparison with Poisson distribution Blue bars denote a histogram of data divided into 1 sec bins. Red curve is a Poisson curve with rate = median count rate of data. |
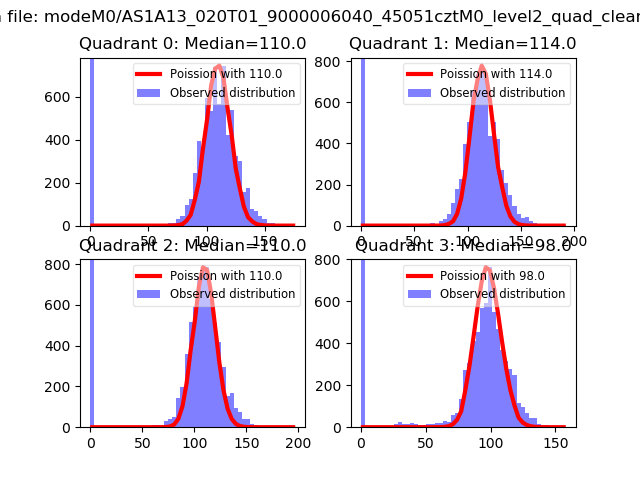 |
 |
| Quadrant-wise count rates Data is divided into 100 sec bins |
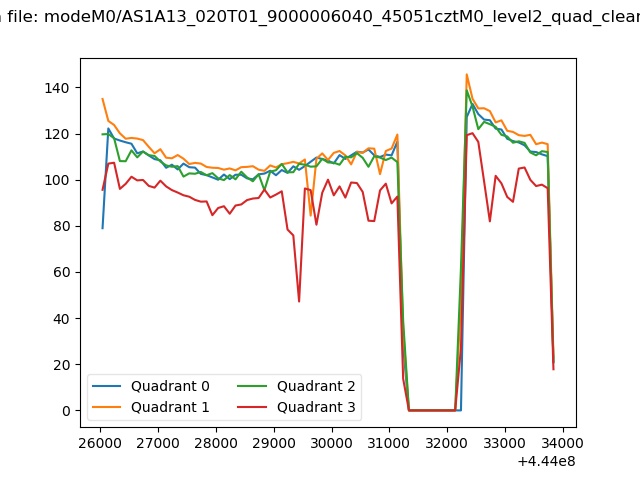 |
|
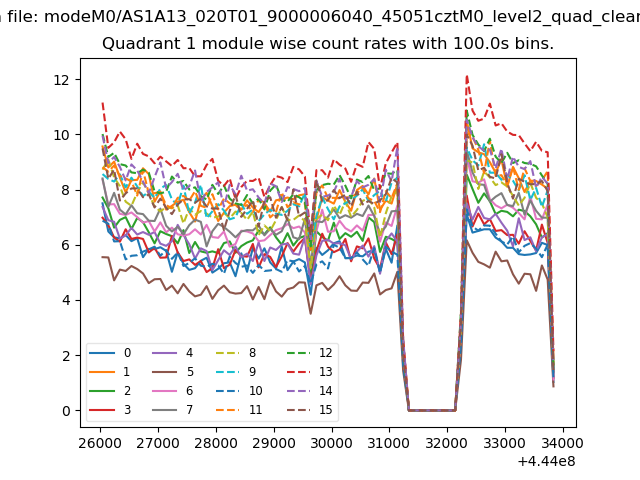
| Module-wise count rates for Quadrant A Data is divided into 100 sec bins |
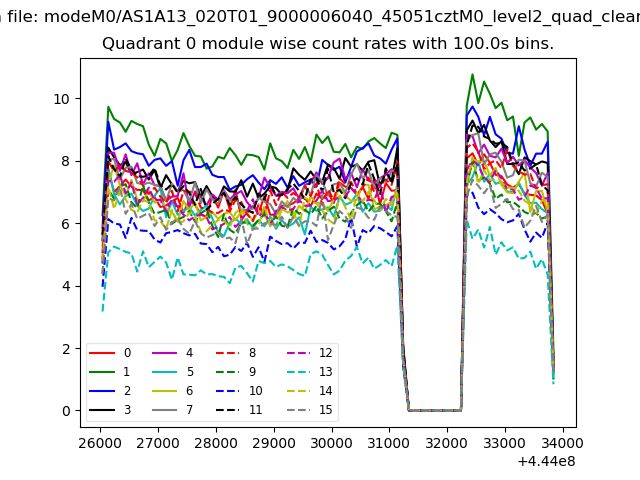 |
 |
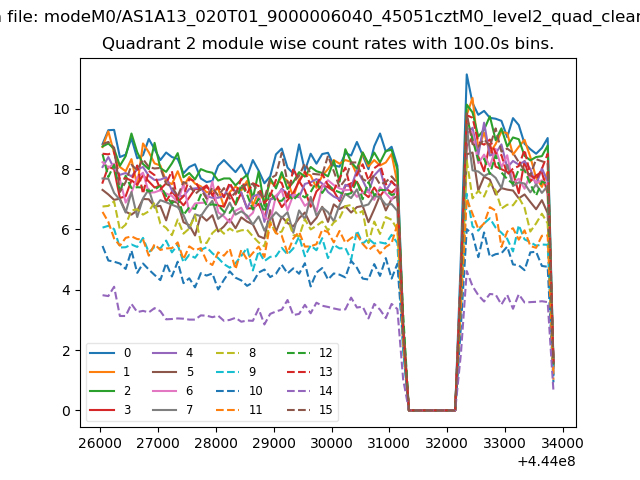
| Module-wise count rates for Quadrant B Data is divided into 100 sec bins |
 |
 |
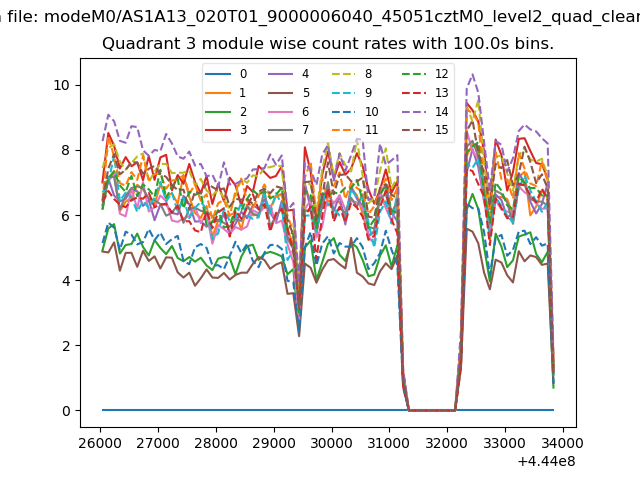
| Module-wise count rates for Quadrant C Data is divided into 100 sec bins |
 |
 |
| Module-wise count rates for Quadrant D Data is divided into 100 sec bins |
 |
 |
| Parameter | Plot |
|---|---|
| CZT HV Monitor | 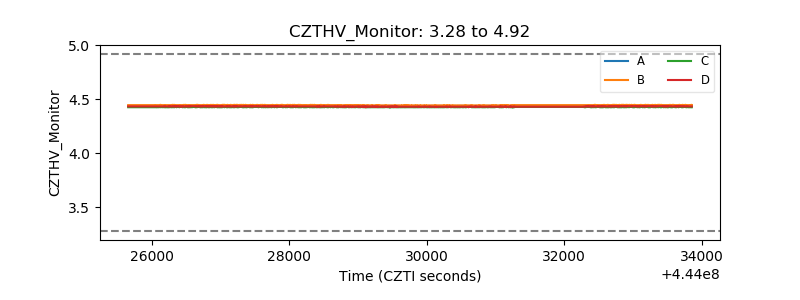 |
| D_VDD | 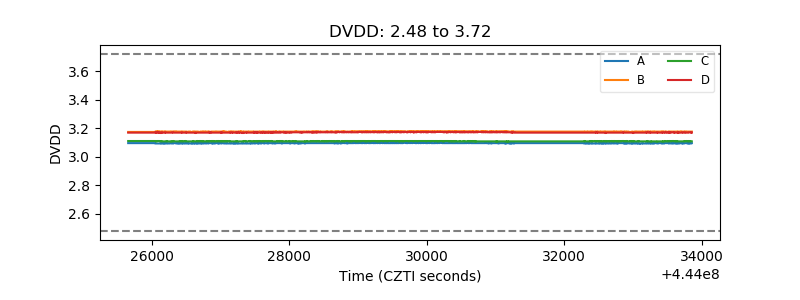 |
| Temperature 1 | 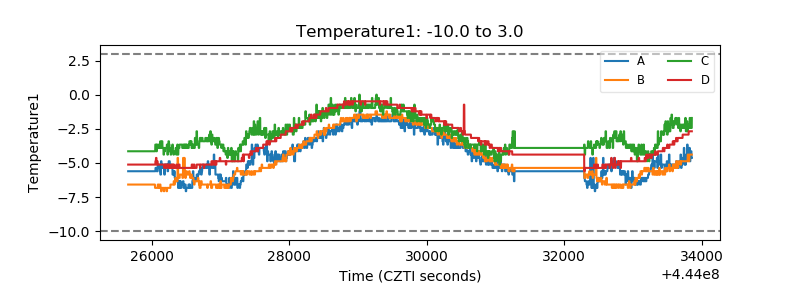 |
| Veto HV Monitor | 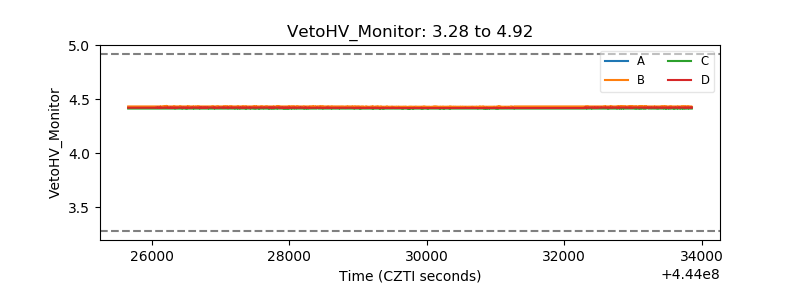 |
| Veto LLD | 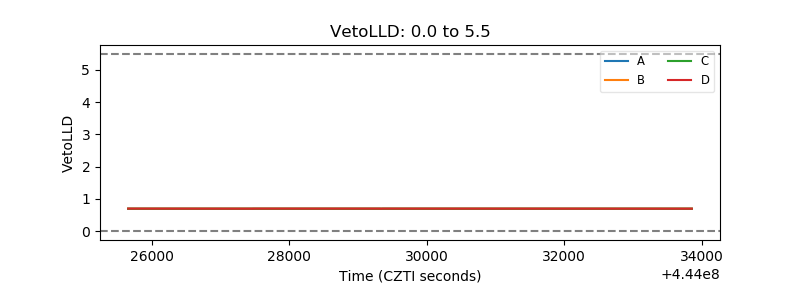 |
| Alpha Counter | 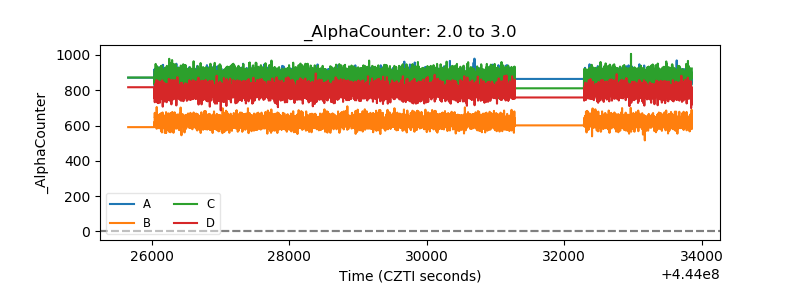 |
| _CPM_Rate | 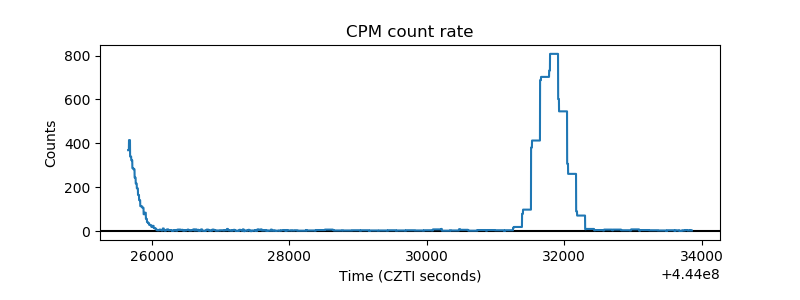 |
| CZT Counter | 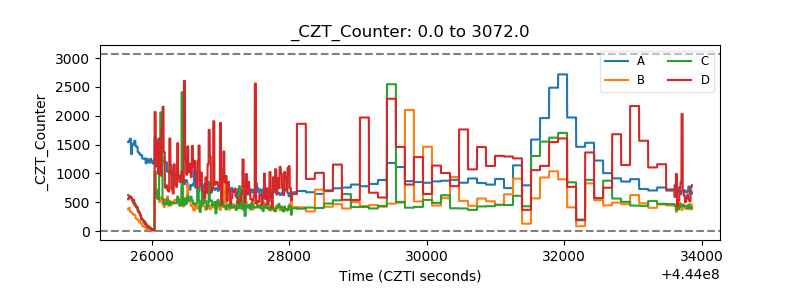 |
| +2.5 Volts monitor | 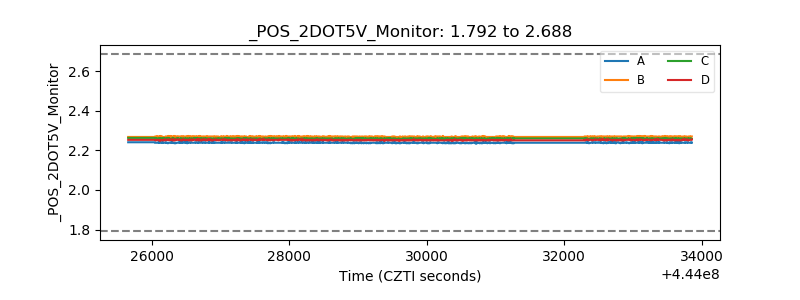 |
| +5 Volts monitor | 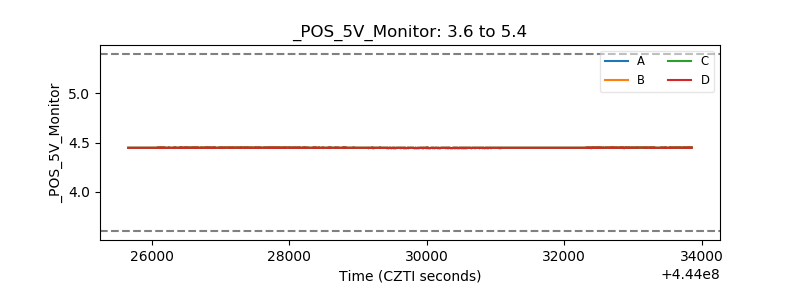 |
| _ROLL_ROT | 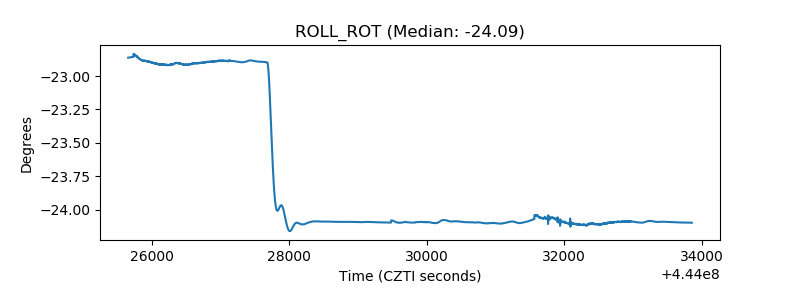 |
| _Roll_DEC | 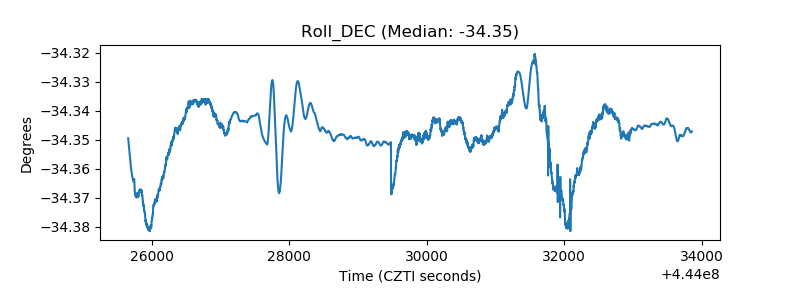 |
| _Roll_RA | 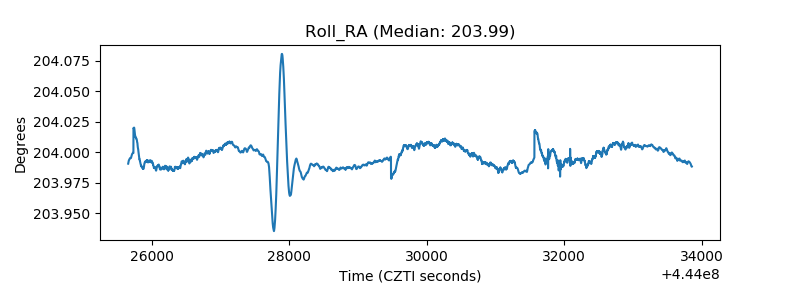 |
| Veto Counter | 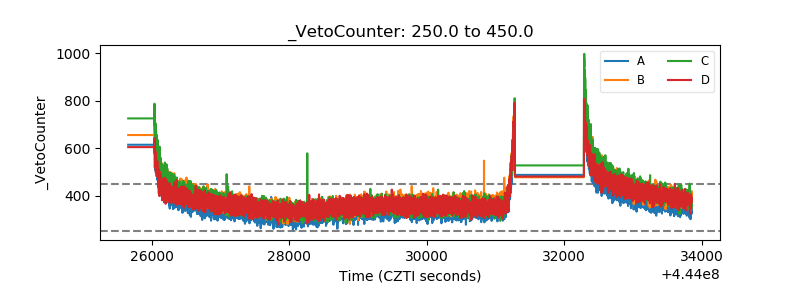 |