| Param | Original file | Final file |
|---|---|---|
| Filename | modeM0/AS1A13_020T01_9000006040_45052cztM0_level2.fits | modeM0/AS1A13_020T01_9000006040_45052cztM0_level2_quad_clean.evt |
| Size (bytes) | 596,917,440 | 108,576,000 |
| Size | 569.3 MB | 103.5 MB |
| Events in quadrant A | 5,428,626 | 741,929 |
| Events in quadrant B | 3,558,634 | 765,761 |
| Events in quadrant C | 3,249,774 | 746,335 |
| Events in quadrant D | 9,358,336 | 582,250 |
| Mode SS | |||
|---|---|---|---|
| Quadrant | BADHDUFLAG | Total packets | Discarded packets |
| A | 0 | 132 | 0 |
| B | 0 | 132 | 0 |
| C | 0 | 132 | 0 |
| D | 0 | 132 | 0 |
| Mode M9 | |||
|---|---|---|---|
| Quadrant | BADHDUFLAG | Total packets | Discarded packets |
| A | 0 | 12 | 0 |
| B | 0 | 12 | 0 |
| C | 0 | 12 | 0 |
| D | 0 | 12 | 0 |
| Mode M0 | |||
|---|---|---|---|
| Quadrant | BADHDUFLAG | Total packets | Discarded packets |
| A | 0 | 20677 | 2 |
| B | 0 | 14789 | 2 |
| C | 0 | 13943 | 2 |
| D | 0 | 32341 | 4 |
| Quadrant | Total seconds | Saturated seconds | Saturation percentage |
|---|---|---|---|
| A | 6467 | 120 | 1.855574% |
| B | 6467 | 139 | 2.149374% |
| C | 6468 | 64 | 0.989487% |
| D | 6467 | 1265 | 19.560847% |
Noise dominated data is calculated using 1-second bins in cleaned event files. If a bin has >2000 counts, and if more than 50% of those come from <1% of pixels, then it is considered to be noise-dominated and hence unusable.
| Quadrant | # 1 sec bins | Bins with >0 counts | Bins with >2000 counts | High rate bins dominated by noise | Noise dominated (total time) | Noise dominated (detector-on time) | Marked lightcurve |
|---|---|---|---|---|---|---|---|
| A | 7627 | 6468 | 31 | 31 | 0.41% | 0.48% | 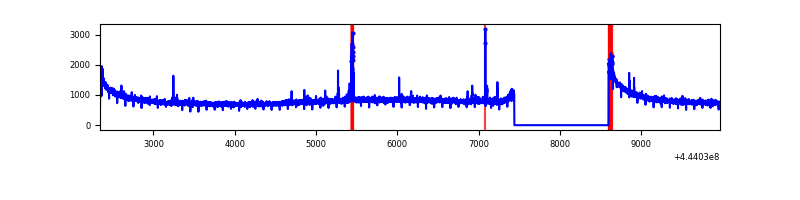 |
| B | 7627 | 6468 | 62 | 62 | 0.81% | 0.96% | 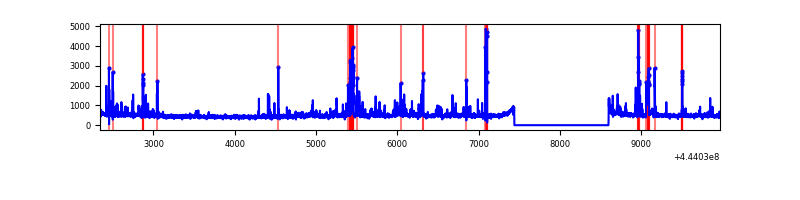 |
| C | 7628 | 6469 | 27 | 27 | 0.35% | 0.42% | 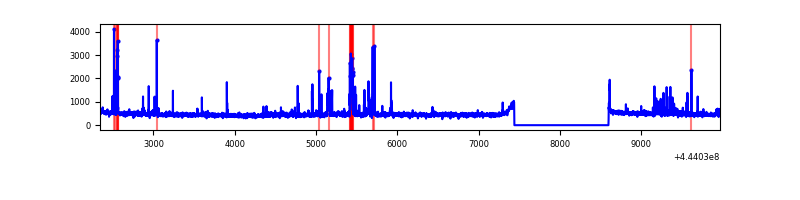 |
| D | 7627 | 6468 | 1178 | 1178 | 15.45% | 18.21% | 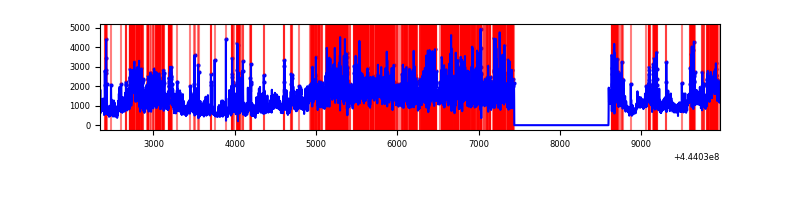 |
Top three noisy pixels from each quadrant. If the there are fewer than three noisy pixels in the level2.evt file, extra rows are filled as -1
| Pixel properties | Quadrant properties | ||||||
|---|---|---|---|---|---|---|---|
| Quadrant | DetID | PixID | Counts | Sigma | Mean | Median | Sigma |
| A | 10 | 83 | 2419680 | 15450.75 | 756 | 740 | 156.6 |
| A | 13 | 248 | 45112 | 283.42 | 756 | 740 | 156.6 |
| A | 7 | 3 | 29977 | 186.75 | 756 | 740 | 156.6 |
| B | 5 | 255 | 335852 | 2283.99 | 751 | 728 | 146.7 |
| B | 4 | 171 | 94766 | 640.9 | 751 | 728 | 146.7 |
| B | 5 | 32 | 33094 | 220.59 | 751 | 728 | 146.7 |
| C | 14 | 254 | 102942 | 575.46 | 754 | 759 | 177.6 |
| C | 12 | 250 | 80963 | 451.68 | 754 | 759 | 177.6 |
| C | 1 | 3 | 78574 | 438.23 | 754 | 759 | 177.6 |
| D | 11 | 241 | 2136440 | 12075.37 | 700 | 679 | 176.9 |
| D | 13 | 174 | 2024638 | 11443.26 | 700 | 679 | 176.9 |
| D | 13 | 249 | 1227037 | 6933.7 | 700 | 679 | 176.9 |
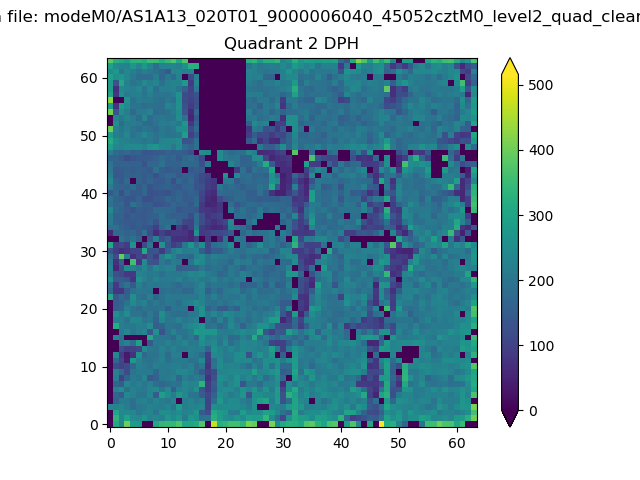
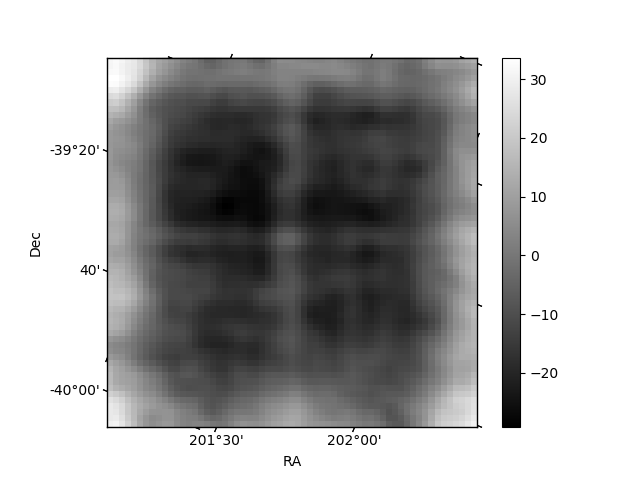
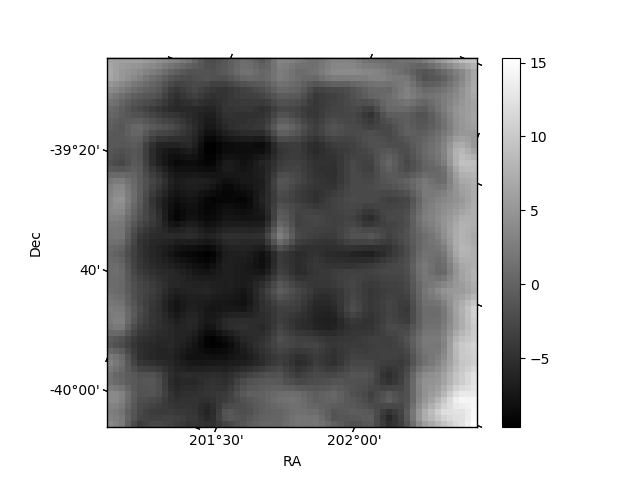
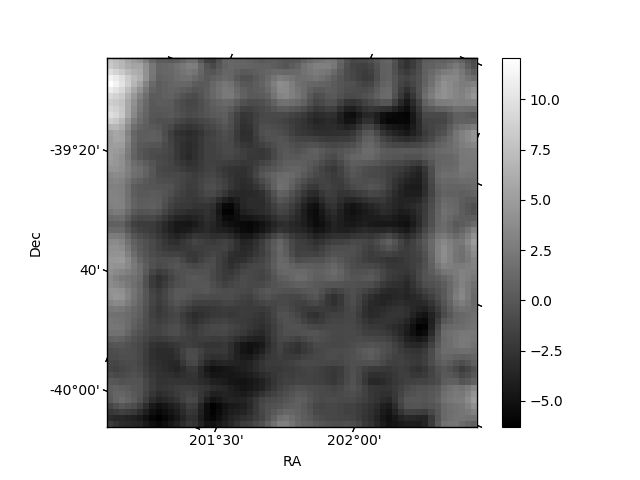
Histogram calculated using DETX and DETY for each event in the final _common_clean file
| Quadrant A | 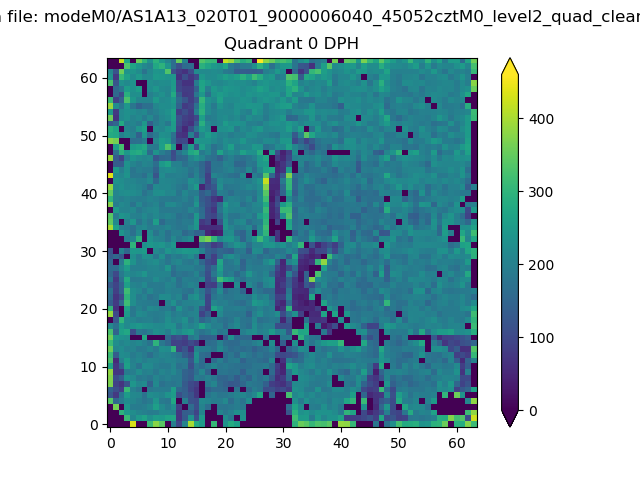 |
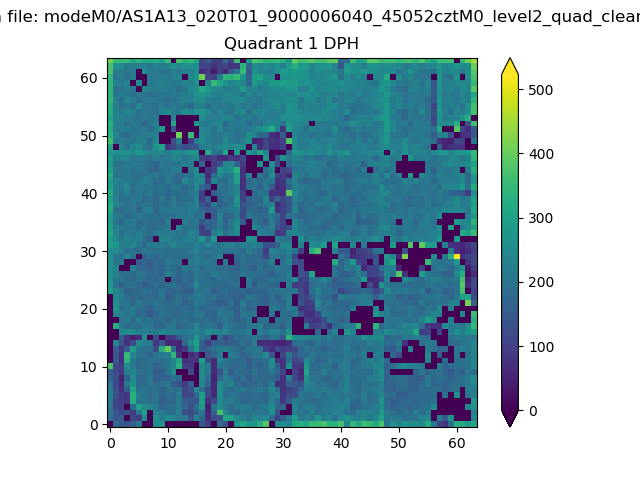 |
Quadrant B |
|---|---|---|---|
| Quadrant D | 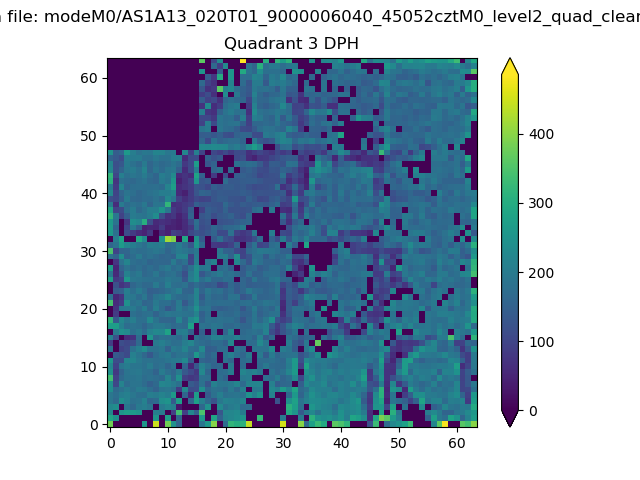 |
 |
Quadrant C |
| Plot type | Count rate plots | Images |
|---|---|---|
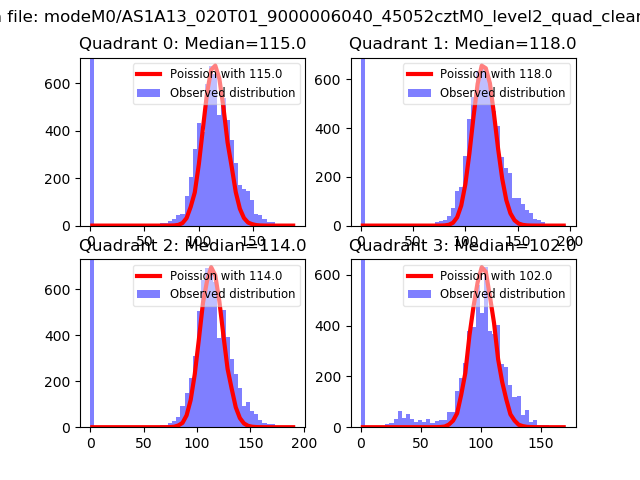
| Comparison with Poisson distribution Blue bars denote a histogram of data divided into 1 sec bins. Red curve is a Poisson curve with rate = median count rate of data. |
 |
 |
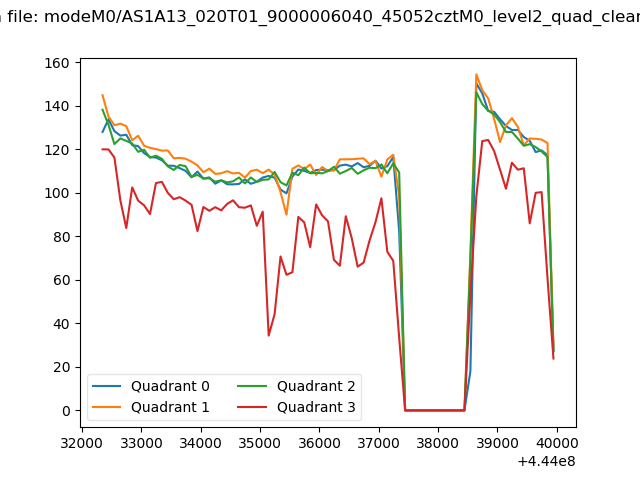
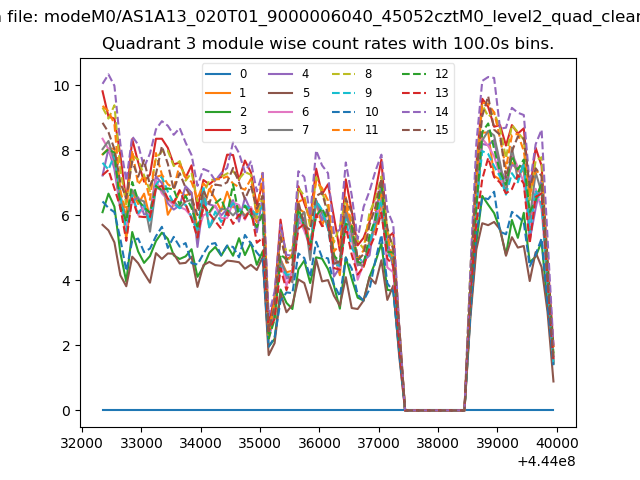
| Quadrant-wise count rates Data is divided into 100 sec bins |
 |
|
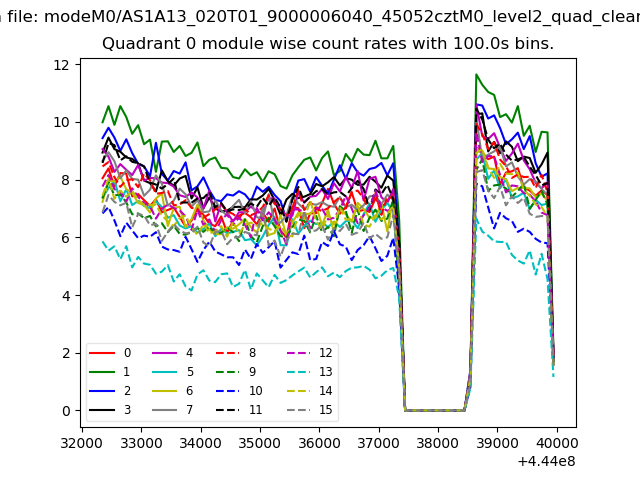
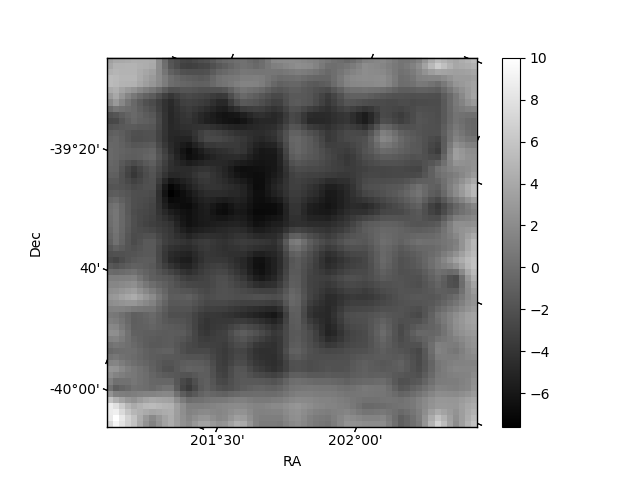
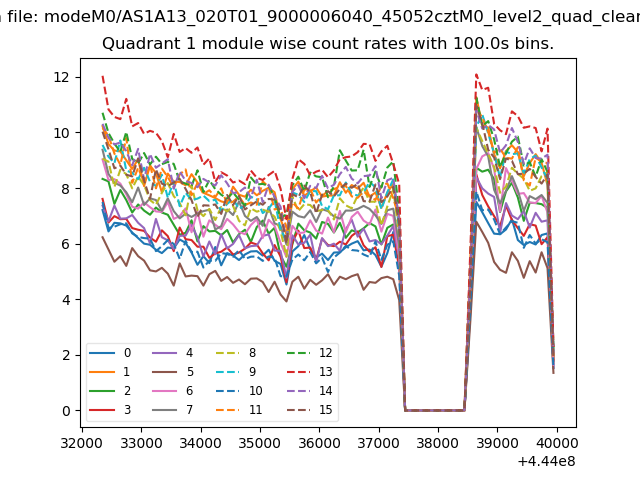
| Module-wise count rates for Quadrant A Data is divided into 100 sec bins |
 |
 |
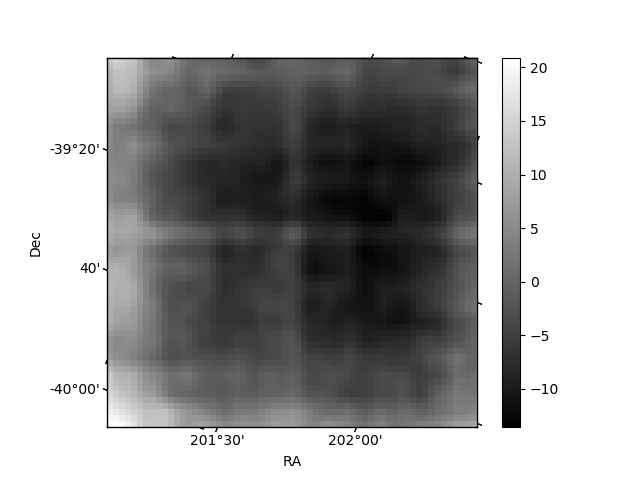
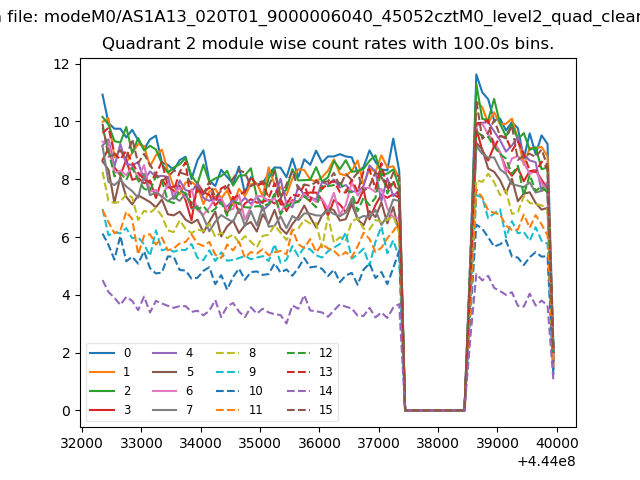
| Module-wise count rates for Quadrant B Data is divided into 100 sec bins |
 |
 |
| Module-wise count rates for Quadrant C Data is divided into 100 sec bins |
 |
 |
| Module-wise count rates for Quadrant D Data is divided into 100 sec bins |
 |
 |
| Parameter | Plot |
|---|---|
| CZT HV Monitor | 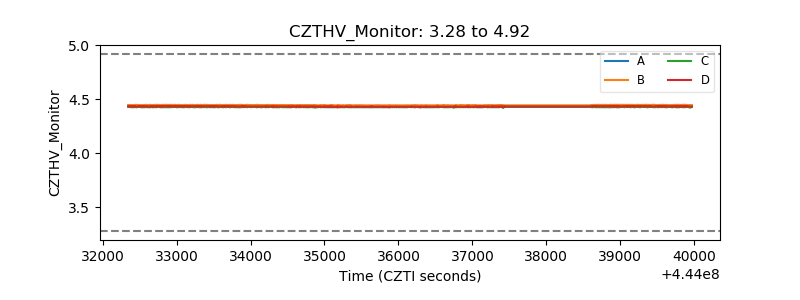 |
| D_VDD | 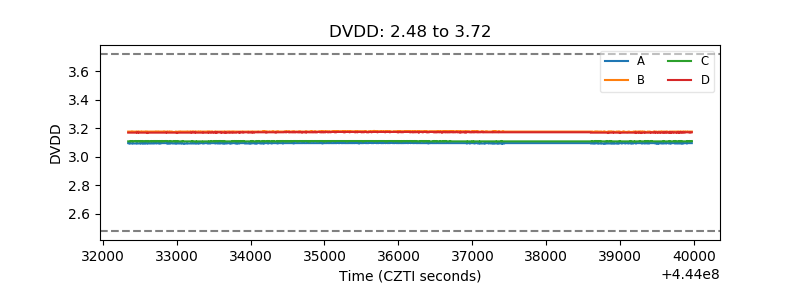 |
| Temperature 1 | 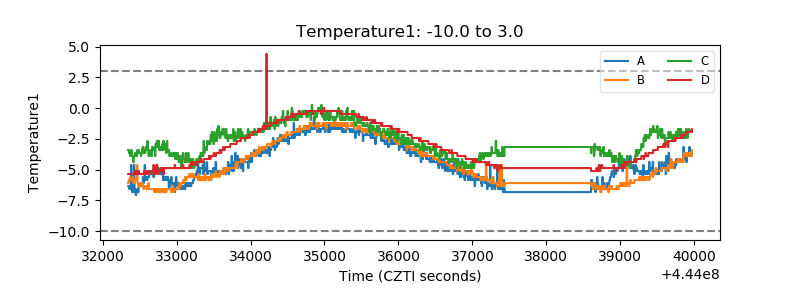 |
| Veto HV Monitor |  |
| Veto LLD | 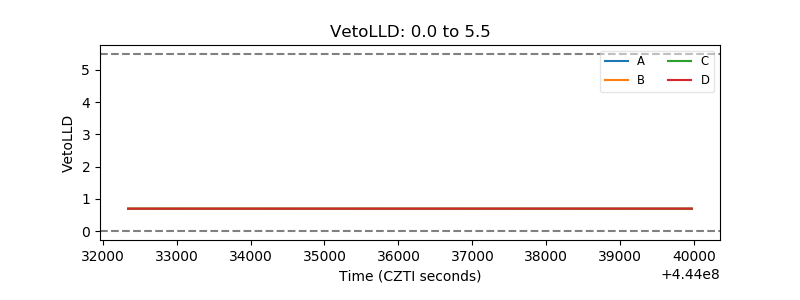 |
| Alpha Counter | 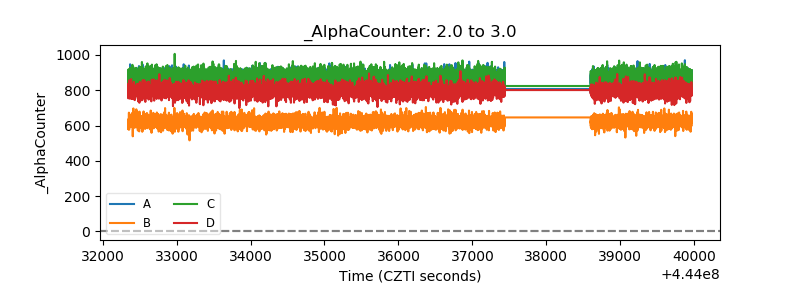 |
| _CPM_Rate | 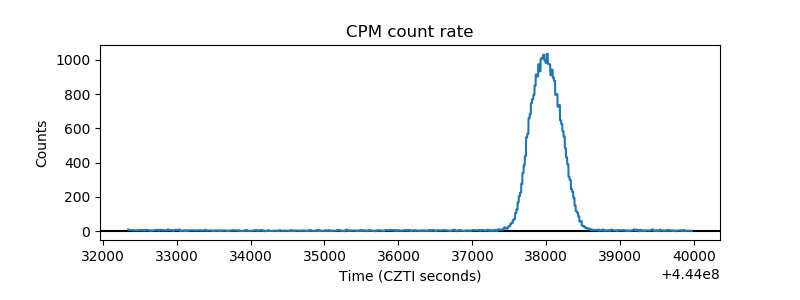 |
| CZT Counter | 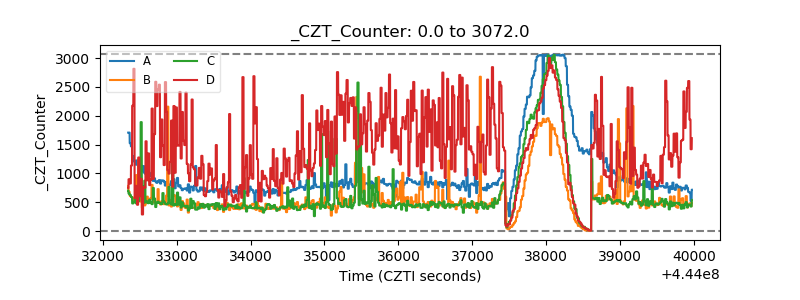 |
| +2.5 Volts monitor | 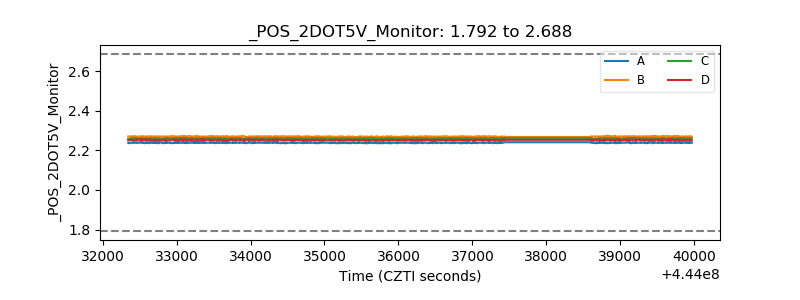 |
| +5 Volts monitor | 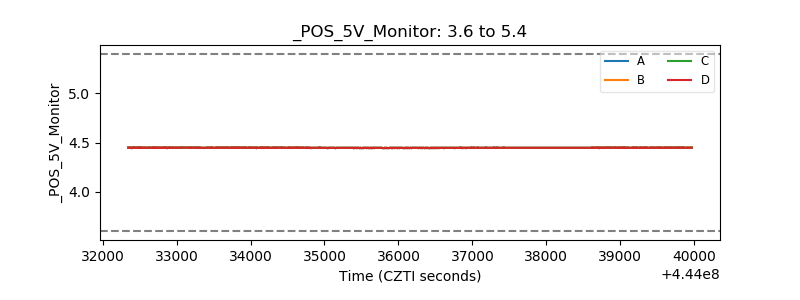 |
| _ROLL_ROT | 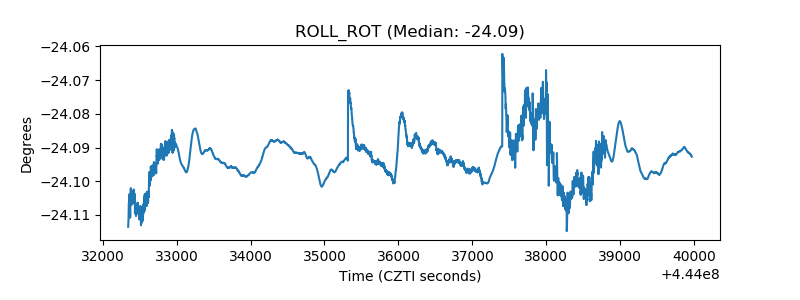 |
| _Roll_DEC | 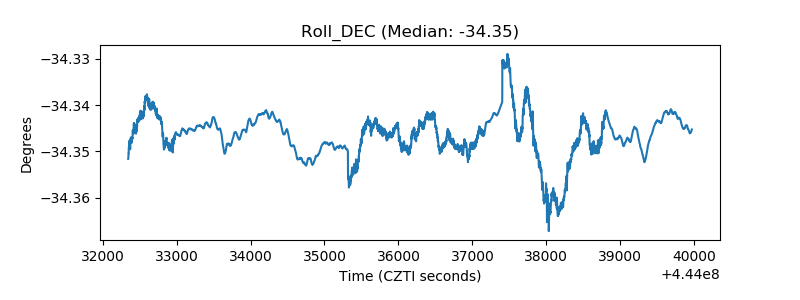 |
| _Roll_RA | 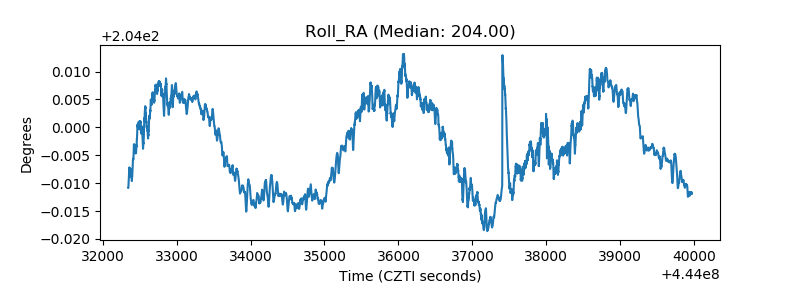 |
| Veto Counter | 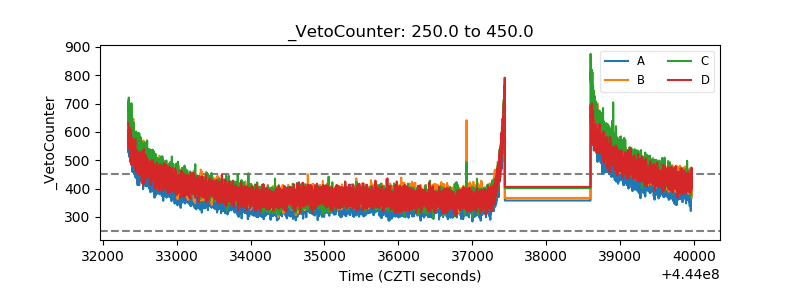 |