| Param | Original file | Final file |
|---|---|---|
| Filename | modeM0/AS1A13_020T01_9000006040_45053cztM0_level2.fits | modeM0/AS1A13_020T01_9000006040_45053cztM0_level2_quad_clean.evt |
| Size (bytes) | 659,105,280 | 107,101,440 |
| Size | 628.6 MB | 102.1 MB |
| Events in quadrant A | 5,658,215 | 755,075 |
| Events in quadrant B | 4,117,435 | 761,497 |
| Events in quadrant C | 3,406,673 | 759,712 |
| Events in quadrant D | 10,723,933 | 522,568 |
| Mode SS | |||
|---|---|---|---|
| Quadrant | BADHDUFLAG | Total packets | Discarded packets |
| A | 0 | 130 | 0 |
| B | 0 | 130 | 0 |
| C | 0 | 130 | 0 |
| D | 0 | 130 | 0 |
| Mode M9 | |||
|---|---|---|---|
| Quadrant | BADHDUFLAG | Total packets | Discarded packets |
| A | 0 | 12 | 0 |
| B | 0 | 12 | 0 |
| C | 0 | 12 | 0 |
| D | 0 | 12 | 0 |
| Mode M0 | |||
|---|---|---|---|
| Quadrant | BADHDUFLAG | Total packets | Discarded packets |
| A | 0 | 21060 | 2 |
| B | 0 | 16334 | 2 |
| C | 0 | 14146 | 2 |
| D | 0 | 36268 | 2 |
| Quadrant | Total seconds | Saturated seconds | Saturation percentage |
|---|---|---|---|
| A | 6361 | 221 | 3.474296% |
| B | 6362 | 314 | 4.935555% |
| C | 6362 | 93 | 1.461804% |
| D | 6361 | 1913 | 30.073888% |
Noise dominated data is calculated using 1-second bins in cleaned event files. If a bin has >2000 counts, and if more than 50% of those come from <1% of pixels, then it is considered to be noise-dominated and hence unusable.
| Quadrant | # 1 sec bins | Bins with >0 counts | Bins with >2000 counts | High rate bins dominated by noise | Noise dominated (total time) | Noise dominated (detector-on time) | Marked lightcurve |
|---|---|---|---|---|---|---|---|
| A | 7551 | 6362 | 59 | 59 | 0.78% | 0.93% | 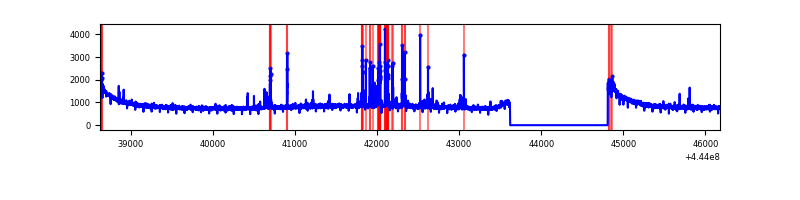 |
| B | 7552 | 6363 | 145 | 145 | 1.92% | 2.28% | 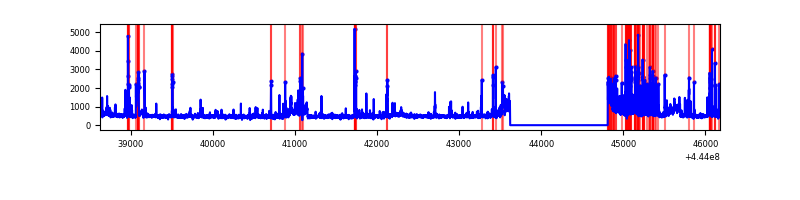 |
| C | 7552 | 6363 | 54 | 54 | 0.72% | 0.85% | 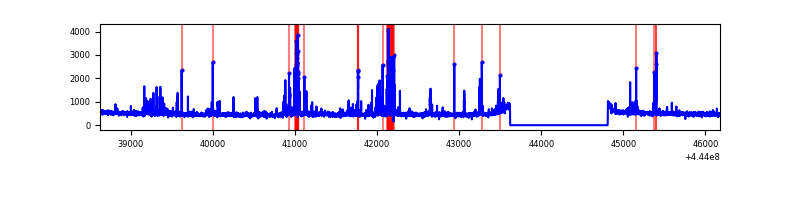 |
| D | 7551 | 6362 | 1857 | 1857 | 24.59% | 29.19% | 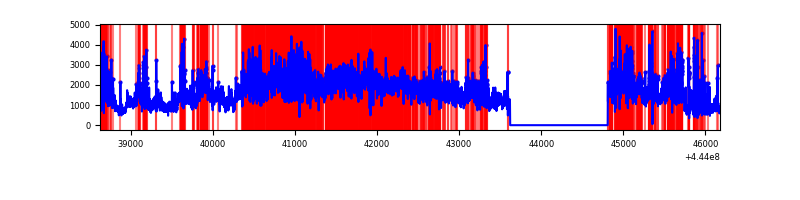 |
Top three noisy pixels from each quadrant. If the there are fewer than three noisy pixels in the level2.evt file, extra rows are filled as -1
| Pixel properties | Quadrant properties | ||||||
|---|---|---|---|---|---|---|---|
| Quadrant | DetID | PixID | Counts | Sigma | Mean | Median | Sigma |
| A | 10 | 83 | 2434155 | 15336.76 | 768 | 752 | 158.7 |
| A | 7 | 191 | 134889 | 845.41 | 768 | 752 | 158.7 |
| A | 13 | 248 | 82718 | 516.6 | 768 | 752 | 158.7 |
| B | 4 | 171 | 299893 | 2022.69 | 752 | 729 | 147.9 |
| B | 5 | 32 | 290334 | 1958.06 | 752 | 729 | 147.9 |
| B | 5 | 255 | 146073 | 982.69 | 752 | 729 | 147.9 |
| C | 15 | 208 | 185475 | 1047.04 | 760 | 765 | 176.4 |
| C | 14 | 254 | 167612 | 945.78 | 760 | 765 | 176.4 |
| C | 1 | 3 | 59760 | 334.42 | 760 | 765 | 176.4 |
| D | 11 | 241 | 4135384 | 23499.96 | 691 | 668 | 175.9 |
| D | 13 | 174 | 1534489 | 8717.58 | 691 | 668 | 175.9 |
| D | 13 | 249 | 1193057 | 6777.03 | 691 | 668 | 175.9 |
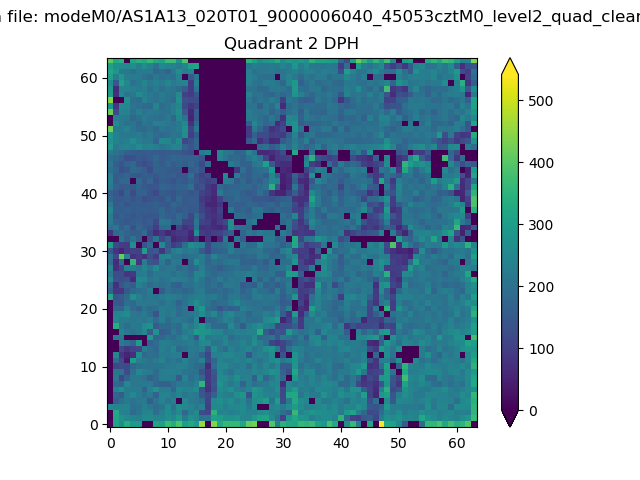
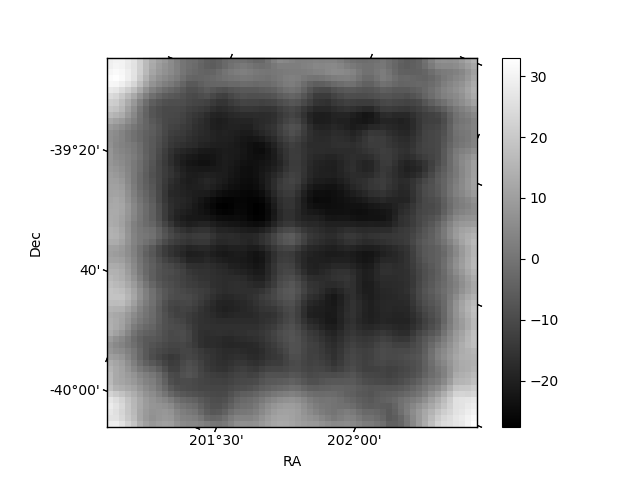
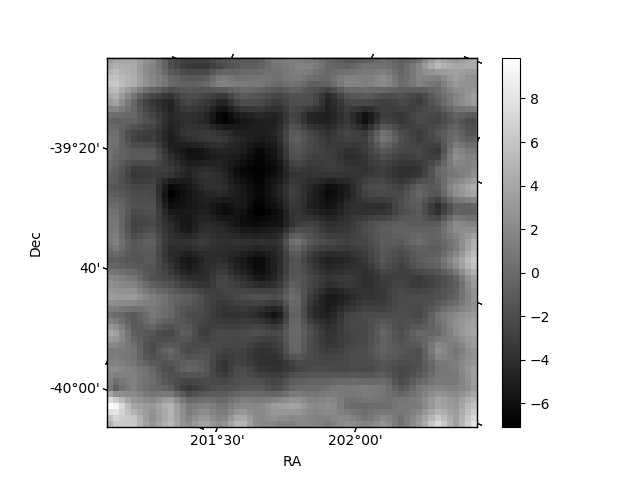
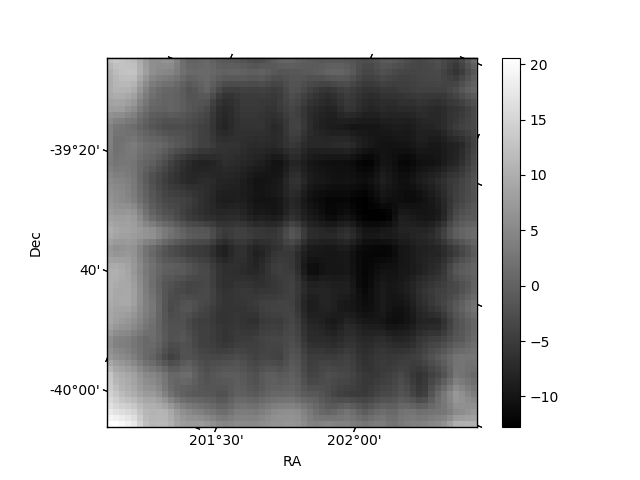
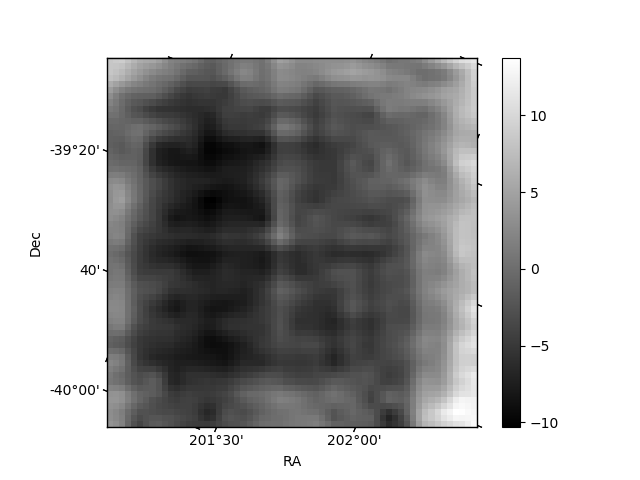
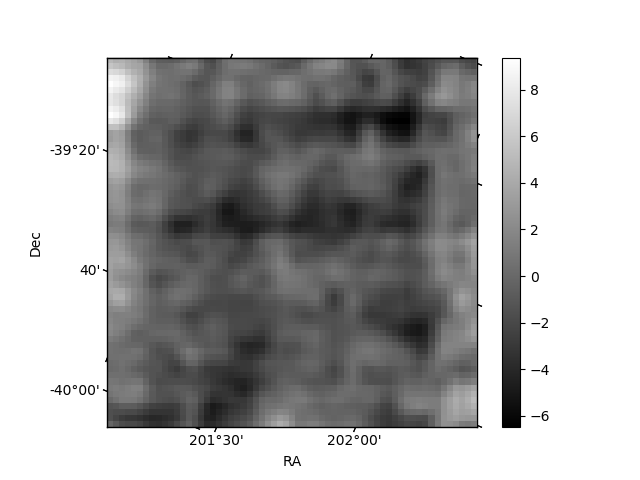
Histogram calculated using DETX and DETY for each event in the final _common_clean file
| Quadrant A | 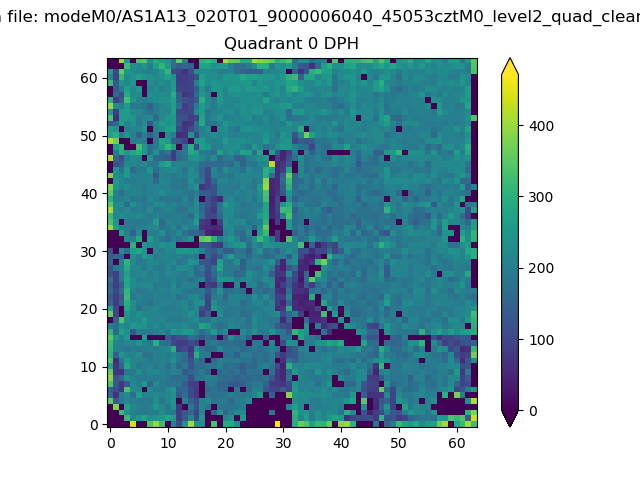 |
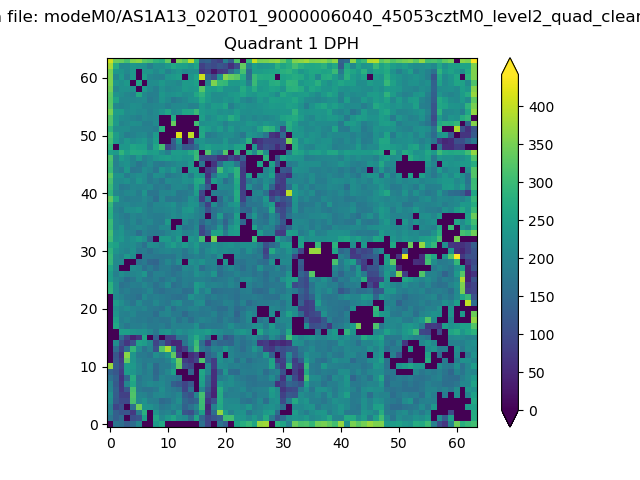 |
Quadrant B |
|---|---|---|---|
| Quadrant D | 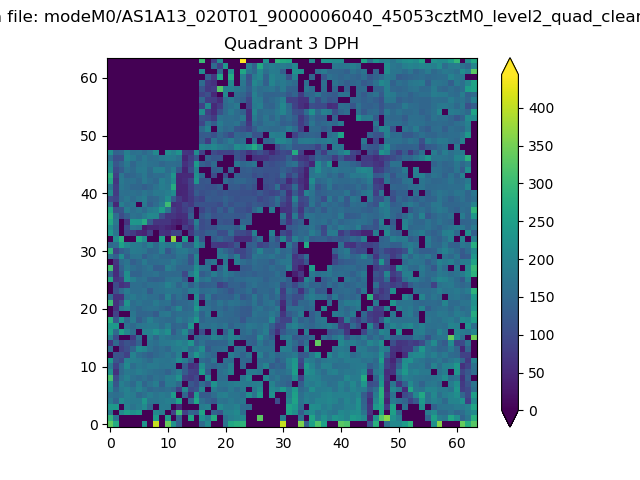 |
 |
Quadrant C |
| Plot type | Count rate plots | Images |
|---|---|---|
| Comparison with Poisson distribution Blue bars denote a histogram of data divided into 1 sec bins. Red curve is a Poisson curve with rate = median count rate of data. |
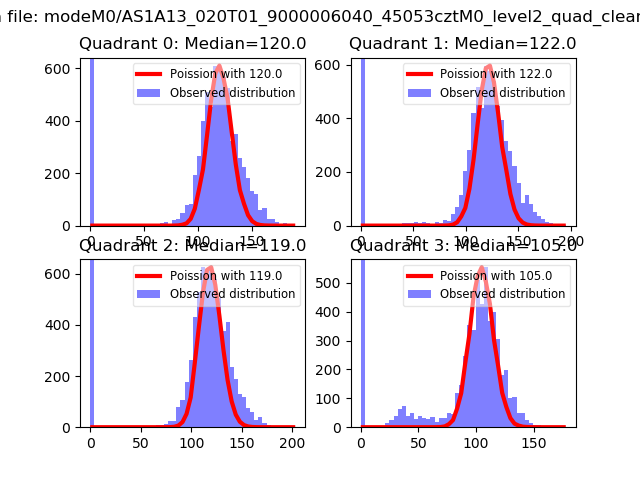 |
 |
| Quadrant-wise count rates Data is divided into 100 sec bins |
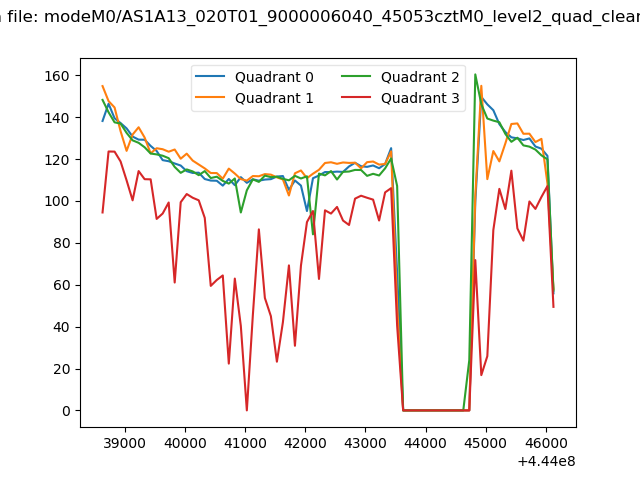 |
|
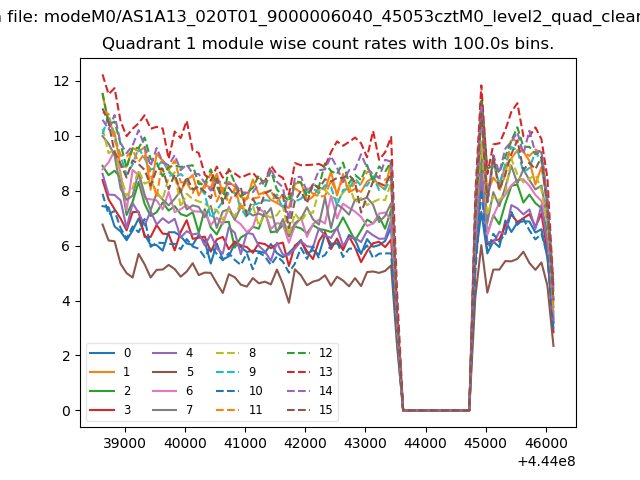
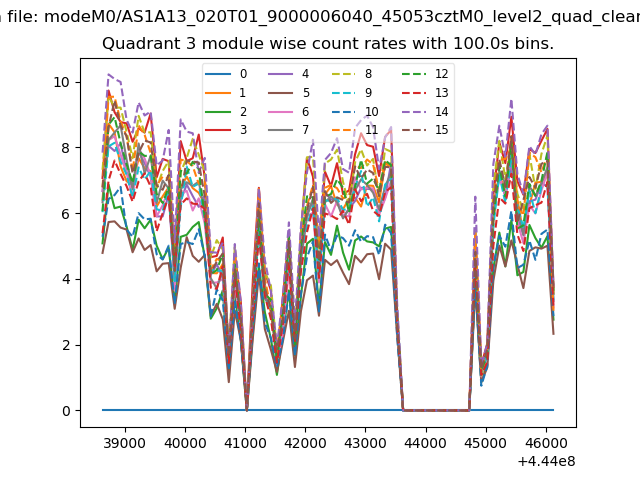
| Module-wise count rates for Quadrant A Data is divided into 100 sec bins |
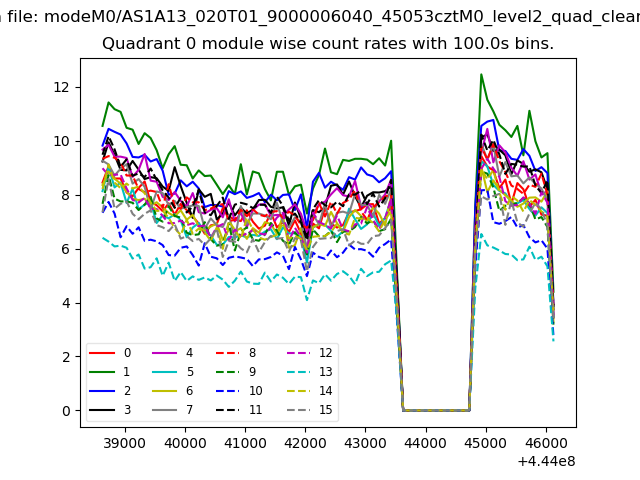 |
 |
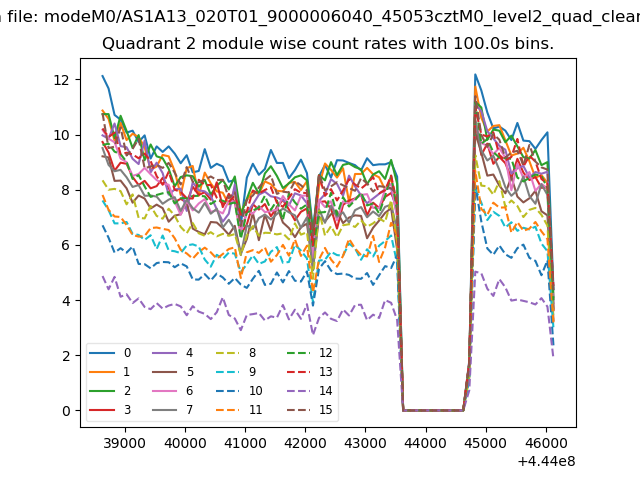
| Module-wise count rates for Quadrant B Data is divided into 100 sec bins |
 |
 |
| Module-wise count rates for Quadrant C Data is divided into 100 sec bins |
 |
 |
| Module-wise count rates for Quadrant D Data is divided into 100 sec bins |
 |
 |
| Parameter | Plot |
|---|---|
| CZT HV Monitor | 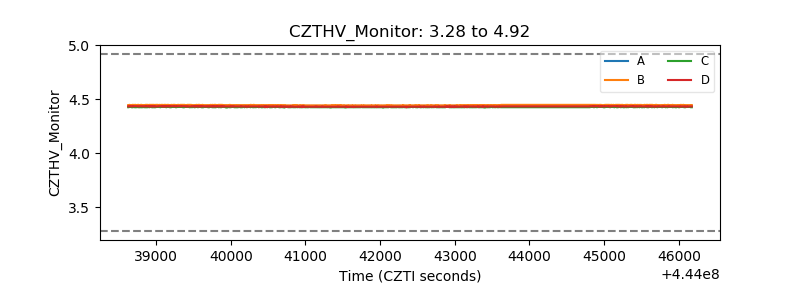 |
| D_VDD | 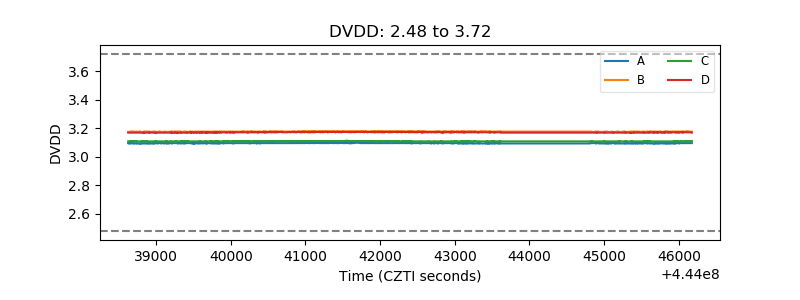 |
| Temperature 1 | 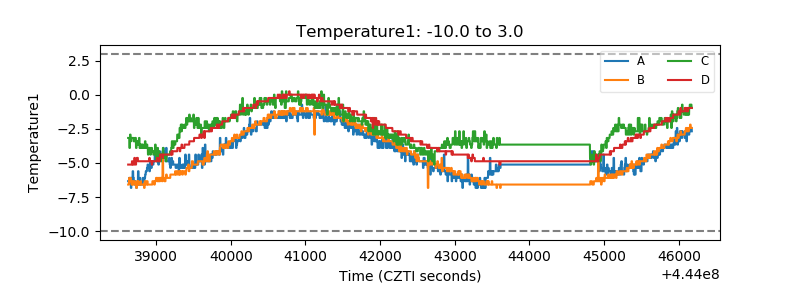 |
| Veto HV Monitor | 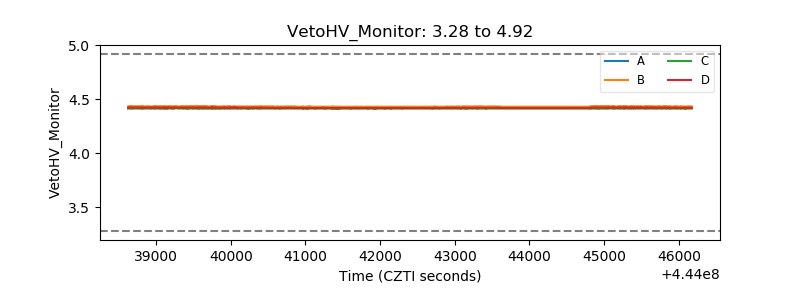 |
| Veto LLD | 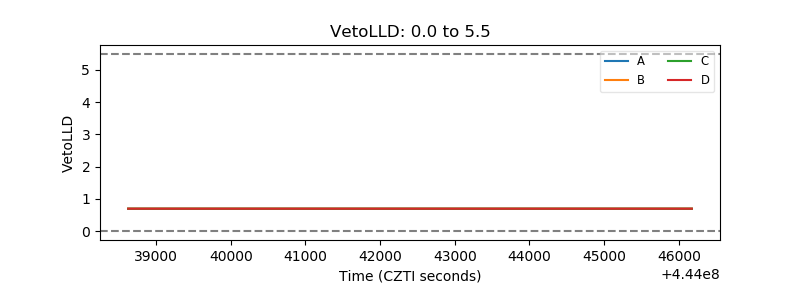 |
| Alpha Counter | 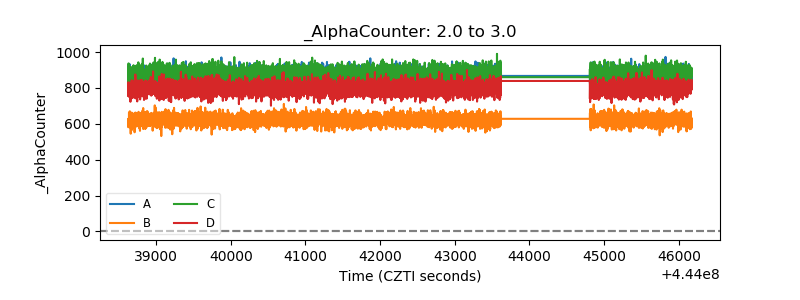 |
| _CPM_Rate | 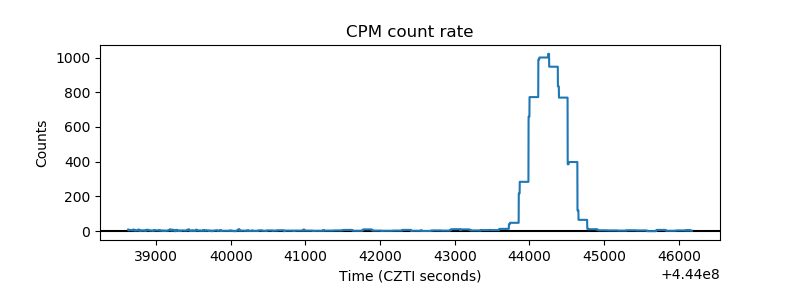 |
| CZT Counter | 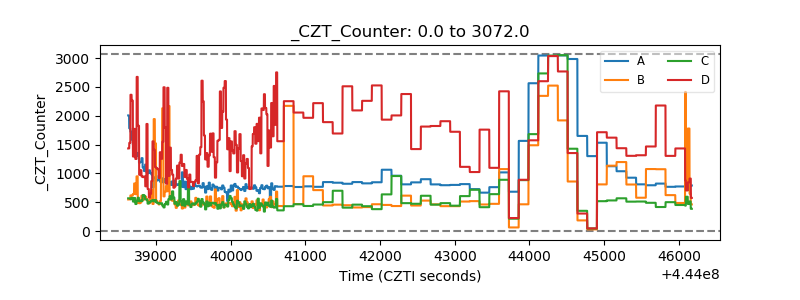 |
| +2.5 Volts monitor | 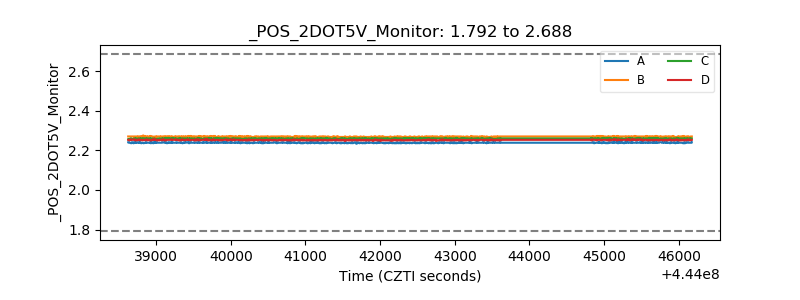 |
| +5 Volts monitor | 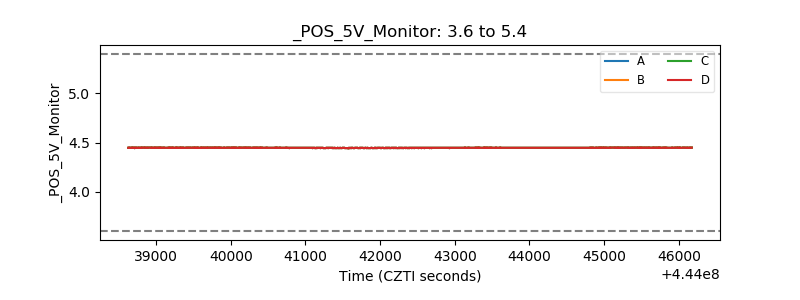 |
| _ROLL_ROT | 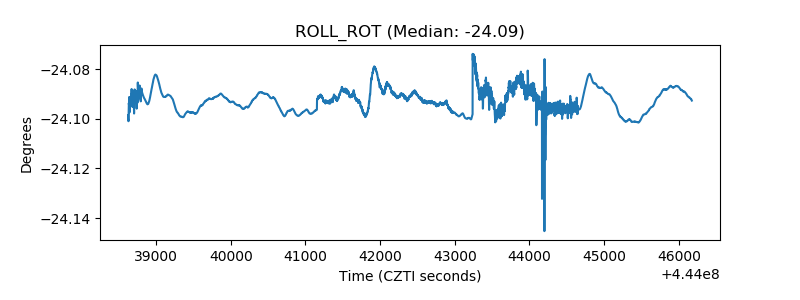 |
| _Roll_DEC | 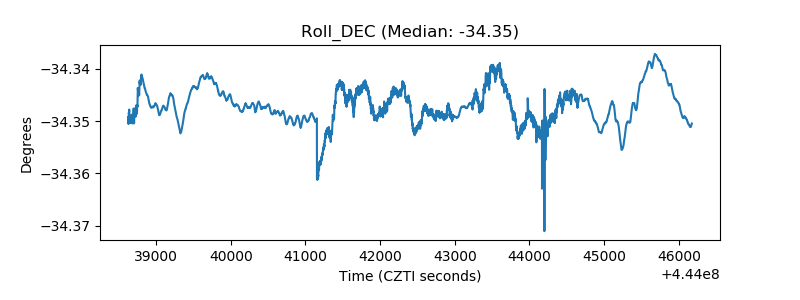 |
| _Roll_RA | 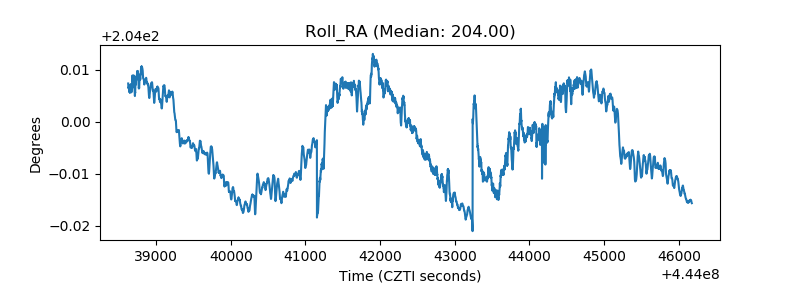 |
| Veto Counter | 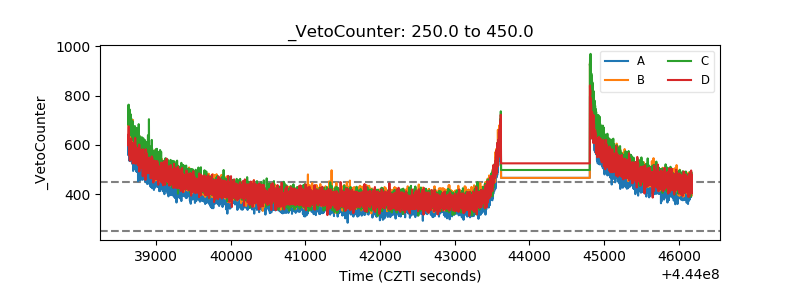 |