| Param | Original file | Final file |
|---|---|---|
| Filename | modeM0/AS1A13_020T01_9000006040_45054cztM0_level2.fits | modeM0/AS1A13_020T01_9000006040_45054cztM0_level2_quad_clean.evt |
| Size (bytes) | 530,835,840 | 100,056,960 |
| Size | 506.2 MB | 95.4 MB |
| Events in quadrant A | 5,122,280 | 677,947 |
| Events in quadrant B | 3,656,980 | 705,429 |
| Events in quadrant C | 3,272,975 | 675,654 |
| Events in quadrant D | 7,144,038 | 561,526 |
| Mode SS | |||
|---|---|---|---|
| Quadrant | BADHDUFLAG | Total packets | Discarded packets |
| A | 0 | 120 | 0 |
| B | 0 | 120 | 0 |
| C | 0 | 120 | 0 |
| D | 0 | 120 | 0 |
| Mode M9 | |||
|---|---|---|---|
| Quadrant | BADHDUFLAG | Total packets | Discarded packets |
| A | 0 | 11 | 0 |
| B | 0 | 11 | 0 |
| C | 0 | 11 | 0 |
| D | 0 | 11 | 0 |
| Mode M0 | |||
|---|---|---|---|
| Quadrant | BADHDUFLAG | Total packets | Discarded packets |
| A | 0 | 19018 | 1 |
| B | 0 | 14555 | 1 |
| C | 0 | 13470 | 1 |
| D | 0 | 25422 | 1 |
| Quadrant | Total seconds | Saturated seconds | Saturation percentage |
|---|---|---|---|
| A | 5852 | 277 | 4.733424% |
| B | 5852 | 247 | 4.220779% |
| C | 5852 | 245 | 4.186603% |
| D | 5852 | 857 | 14.644566% |
Noise dominated data is calculated using 1-second bins in cleaned event files. If a bin has >2000 counts, and if more than 50% of those come from <1% of pixels, then it is considered to be noise-dominated and hence unusable.
| Quadrant | # 1 sec bins | Bins with >0 counts | Bins with >2000 counts | High rate bins dominated by noise | Noise dominated (total time) | Noise dominated (detector-on time) | Marked lightcurve |
|---|---|---|---|---|---|---|---|
| A | 7022 | 5853 | 76 | 76 | 1.08% | 1.30% | 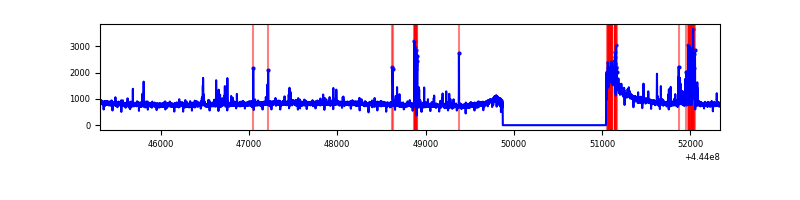 |
| B | 7022 | 5853 | 101 | 101 | 1.44% | 1.73% | 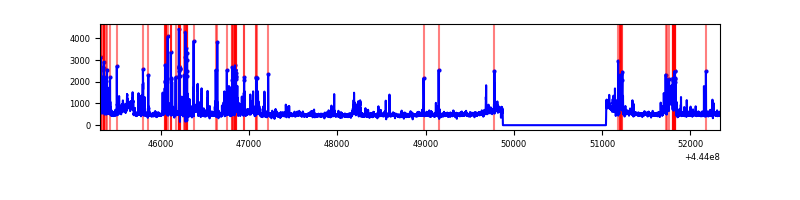 |
| C | 7022 | 5853 | 146 | 146 | 2.08% | 2.49% | 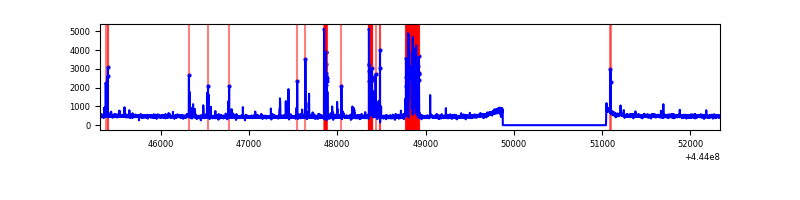 |
| D | 7022 | 5853 | 613 | 613 | 8.73% | 10.47% | 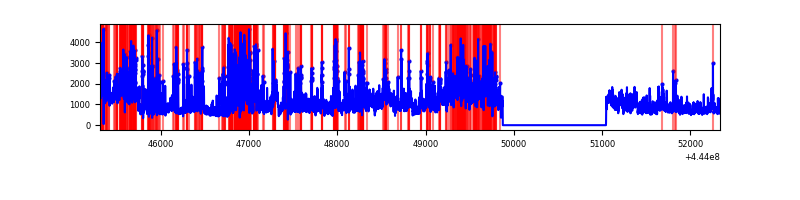 |
Top three noisy pixels from each quadrant. If the there are fewer than three noisy pixels in the level2.evt file, extra rows are filled as -1
| Pixel properties | Quadrant properties | ||||||
|---|---|---|---|---|---|---|---|
| Quadrant | DetID | PixID | Counts | Sigma | Mean | Median | Sigma |
| A | 10 | 83 | 2092406 | 14388.28 | 705 | 689 | 145.4 |
| A | 13 | 248 | 173080 | 1185.83 | 705 | 689 | 145.4 |
| A | 7 | 3 | 63832 | 434.34 | 705 | 689 | 145.4 |
| B | 0 | 189 | 199329 | 1457.08 | 699 | 678 | 136.3 |
| B | 5 | 32 | 188480 | 1377.5 | 699 | 678 | 136.3 |
| B | 4 | 171 | 139868 | 1020.94 | 699 | 678 | 136.3 |
| C | 14 | 254 | 535372 | 3293.29 | 690 | 693 | 162.4 |
| C | 12 | 250 | 16952 | 100.15 | 690 | 693 | 162.4 |
| C | 1 | 3 | 13988 | 81.89 | 690 | 693 | 162.4 |
| D | 11 | 241 | 2020495 | 12044.52 | 662 | 643 | 167.7 |
| D | 13 | 249 | 1131040 | 6740.64 | 662 | 643 | 167.7 |
| D | 13 | 174 | 429442 | 2556.96 | 662 | 643 | 167.7 |
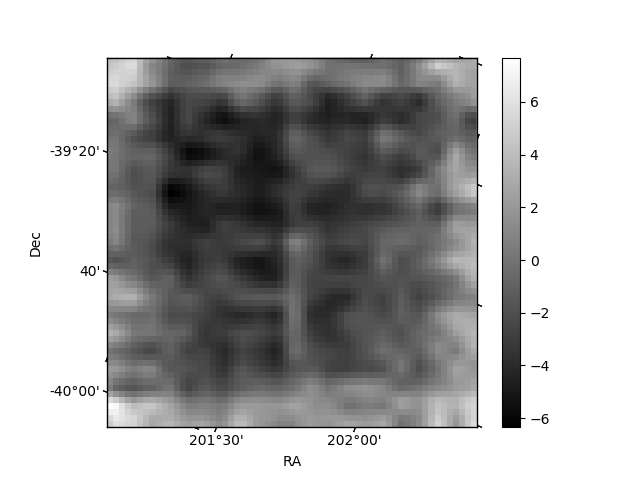
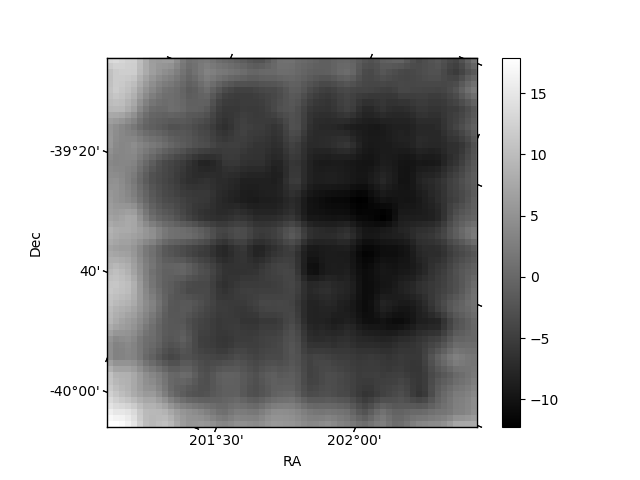
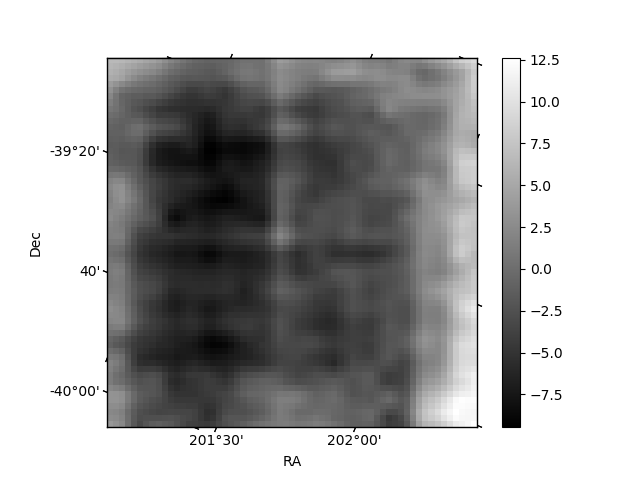
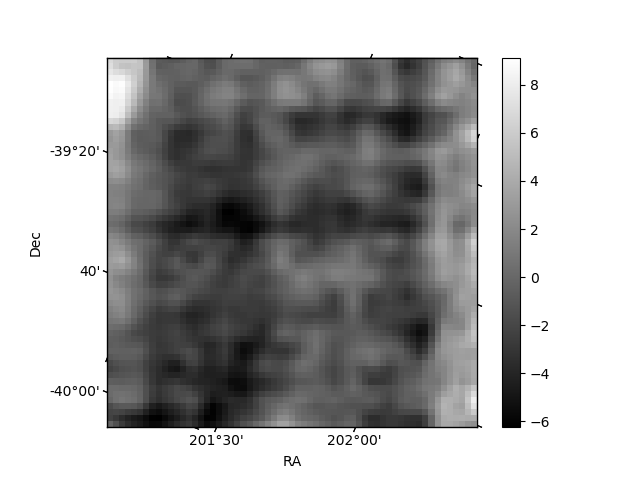
Histogram calculated using DETX and DETY for each event in the final _common_clean file
| Quadrant A | 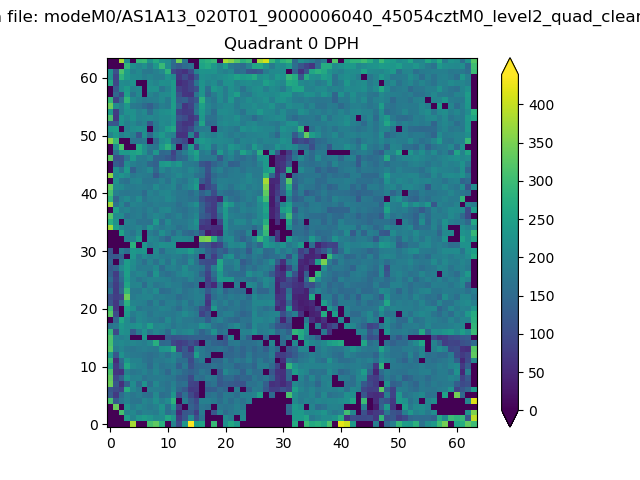 |
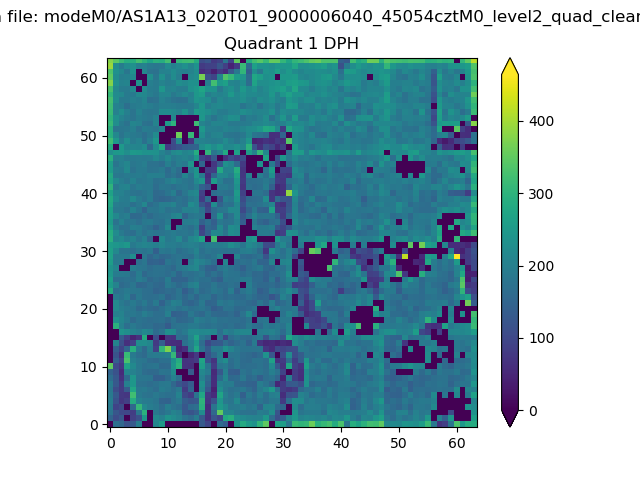 |
Quadrant B |
|---|---|---|---|
| Quadrant D | 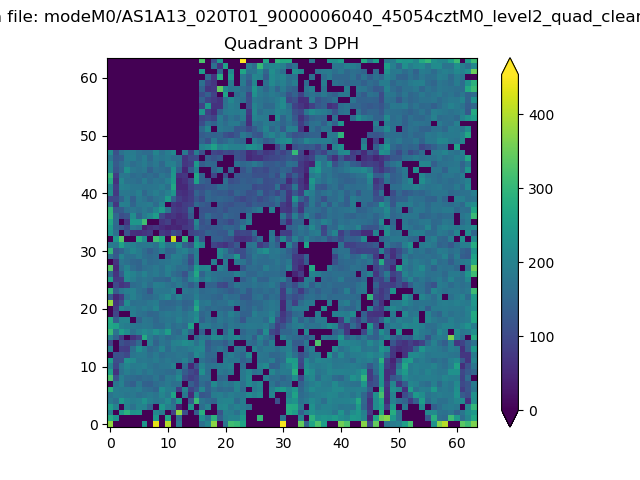 |
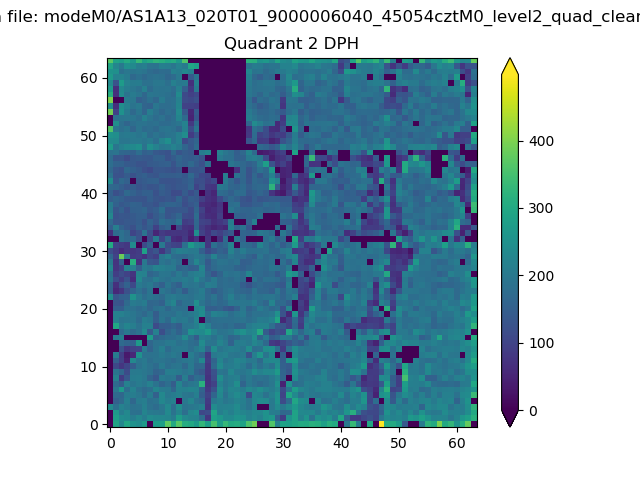 |
Quadrant C |
| Plot type | Count rate plots | Images |
|---|---|---|
| Comparison with Poisson distribution Blue bars denote a histogram of data divided into 1 sec bins. Red curve is a Poisson curve with rate = median count rate of data. |
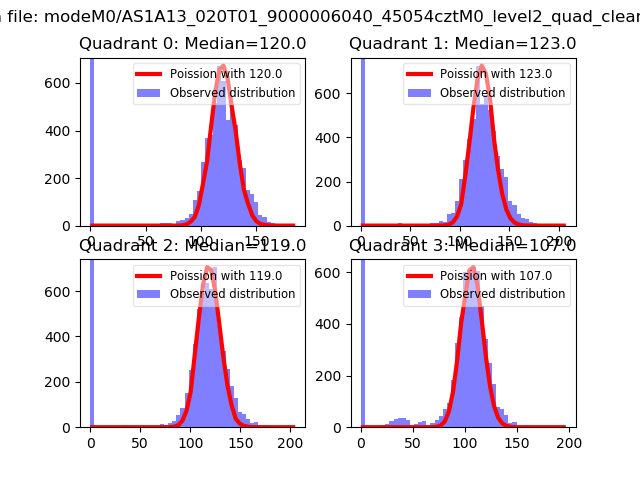 |
 |
| Quadrant-wise count rates Data is divided into 100 sec bins |
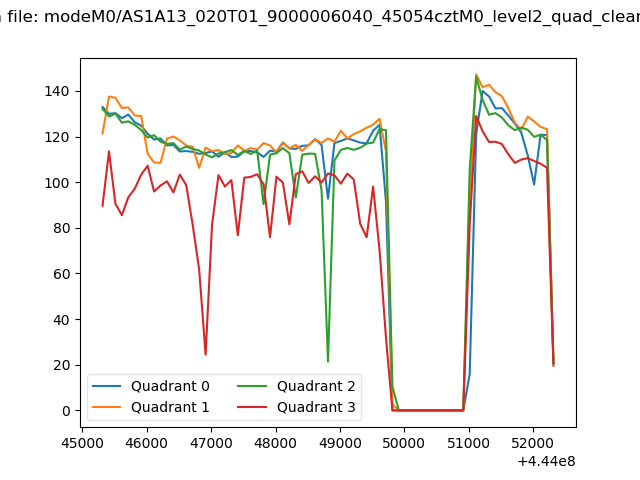 |
|
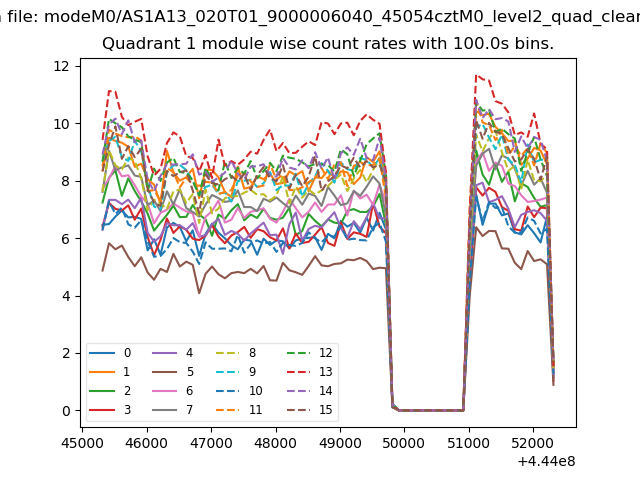
| Module-wise count rates for Quadrant A Data is divided into 100 sec bins |
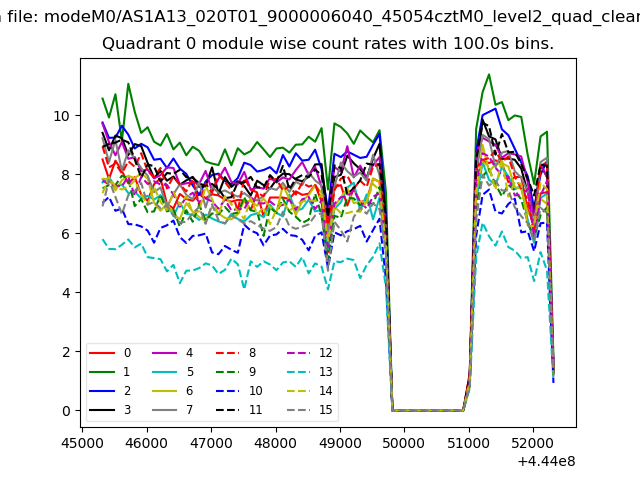 |
 |
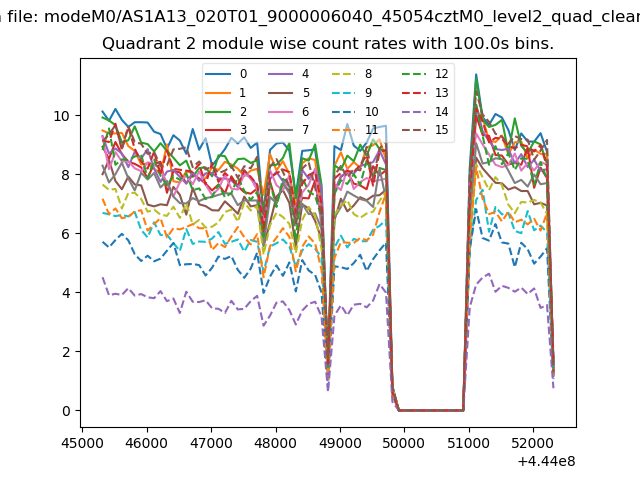
| Module-wise count rates for Quadrant B Data is divided into 100 sec bins |
 |
 |
| Module-wise count rates for Quadrant C Data is divided into 100 sec bins |
 |
 |
| Module-wise count rates for Quadrant D Data is divided into 100 sec bins |
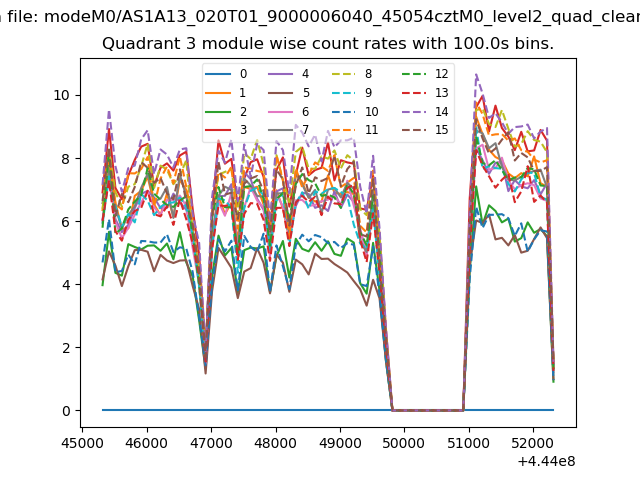 |
 |
| Parameter | Plot |
|---|---|
| CZT HV Monitor | 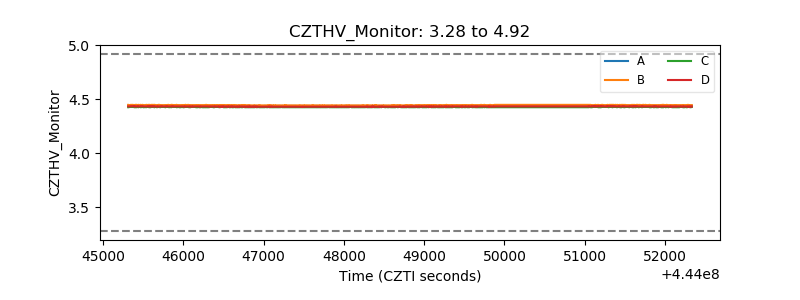 |
| D_VDD | 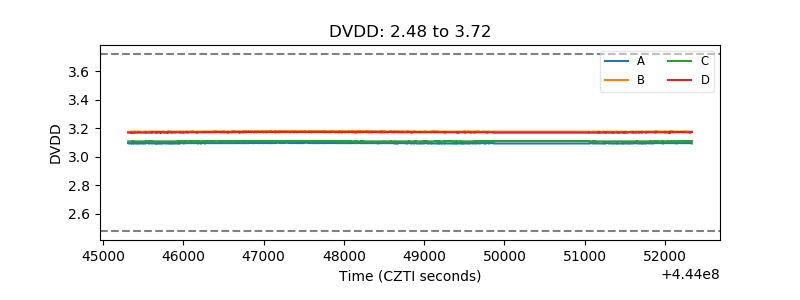 |
| Temperature 1 | 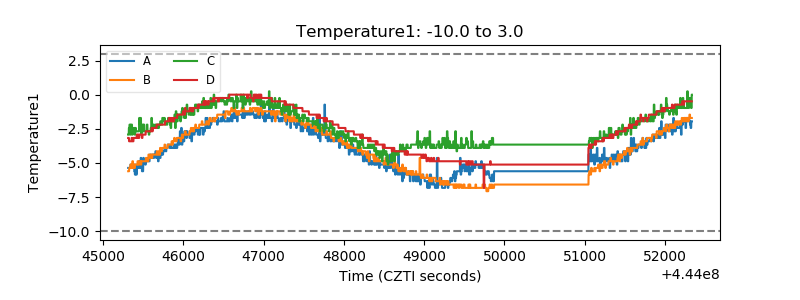 |
| Veto HV Monitor | 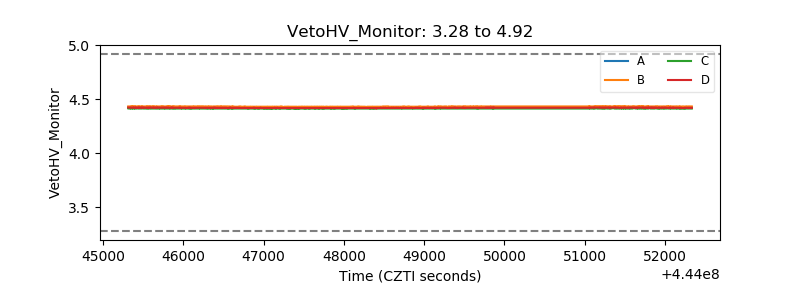 |
| Veto LLD | 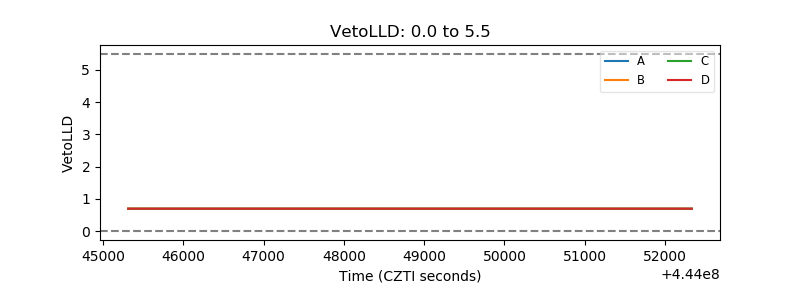 |
| Alpha Counter | 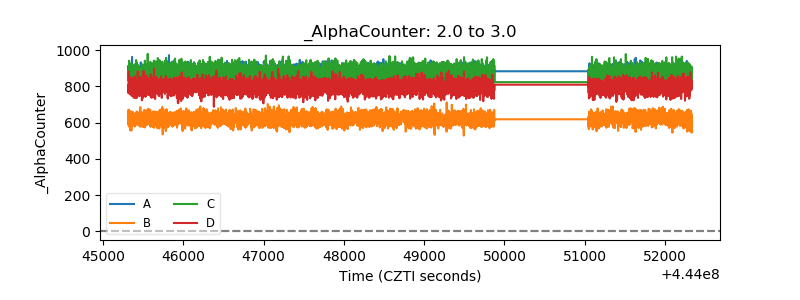 |
| _CPM_Rate | 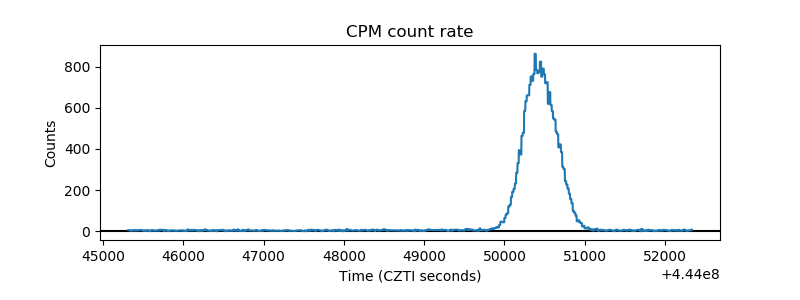 |
| CZT Counter | 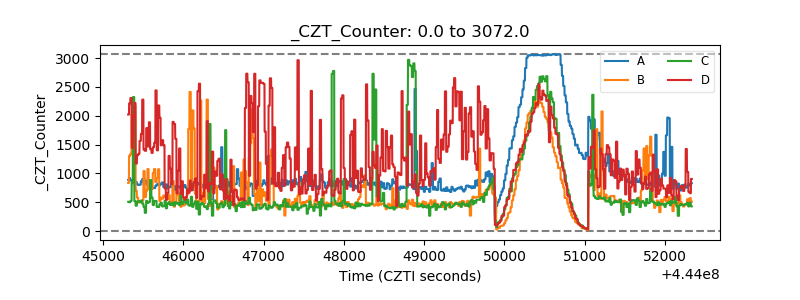 |
| +2.5 Volts monitor | 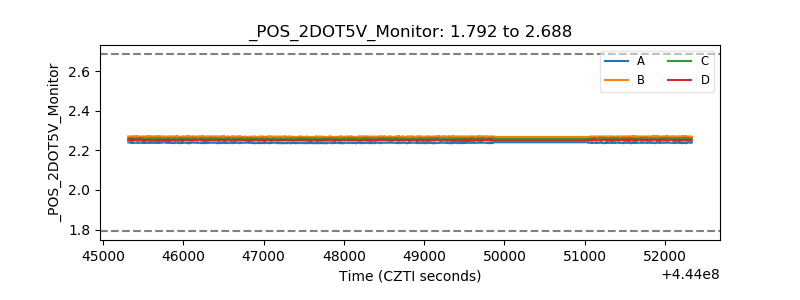 |
| +5 Volts monitor | 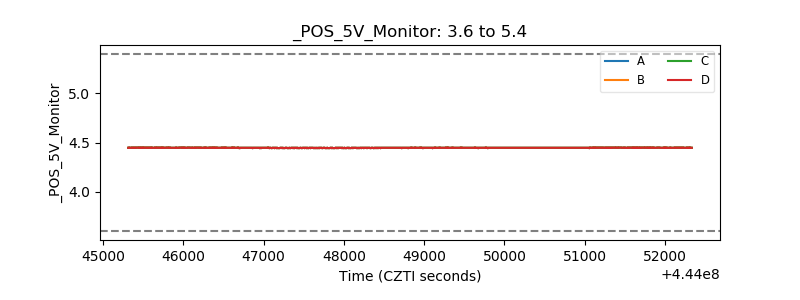 |
| _ROLL_ROT | 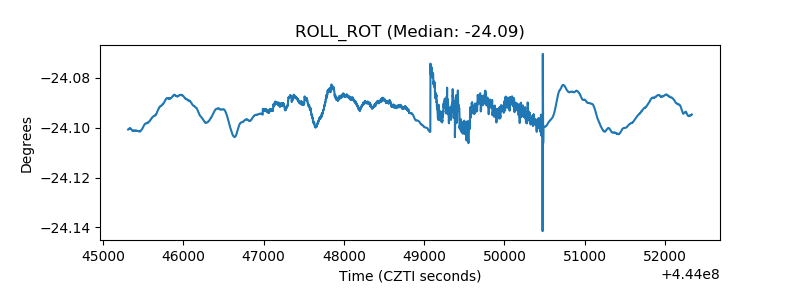 |
| _Roll_DEC | 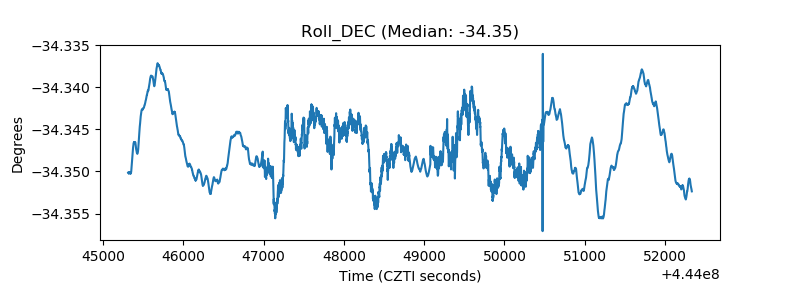 |
| _Roll_RA | 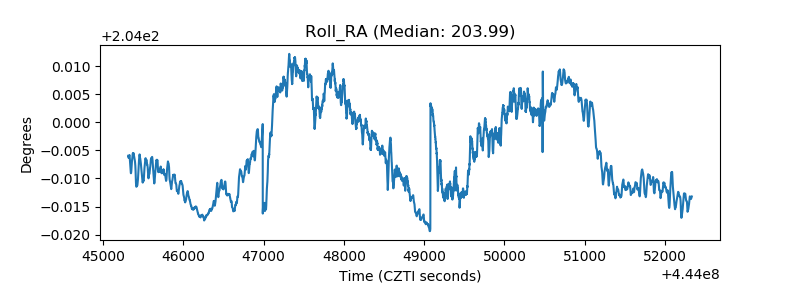 |
| Veto Counter | 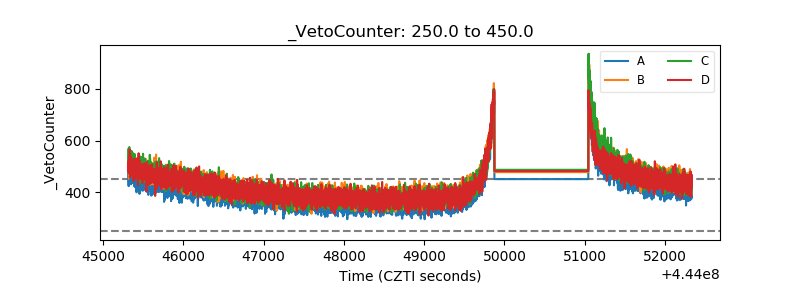 |