| Param | Original file | Final file |
|---|---|---|
| Filename | modeM0/AS1A13_020T01_9000006040_45055cztM0_level2.fits | modeM0/AS1A13_020T01_9000006040_45055cztM0_level2_quad_clean.evt |
| Size (bytes) | 699,684,480 | 112,285,440 |
| Size | 667.3 MB | 107.1 MB |
| Events in quadrant A | 6,333,601 | 779,698 |
| Events in quadrant B | 6,193,994 | 706,191 |
| Events in quadrant C | 3,574,720 | 792,671 |
| Events in quadrant D | 9,262,350 | 638,158 |
| Mode SS | |||
|---|---|---|---|
| Quadrant | BADHDUFLAG | Total packets | Discarded packets |
| A | 0 | 144 | 0 |
| B | 0 | 144 | 0 |
| C | 0 | 144 | 0 |
| D | 0 | 144 | 0 |
| Mode M9 | |||
|---|---|---|---|
| Quadrant | BADHDUFLAG | Total packets | Discarded packets |
| A | 0 | 10 | 0 |
| B | 0 | 11 | 0 |
| C | 0 | 11 | 0 |
| D | 0 | 11 | 0 |
| Mode M0 | |||
|---|---|---|---|
| Quadrant | BADHDUFLAG | Total packets | Discarded packets |
| A | 0 | 23412 | 2 |
| B | 0 | 22926 | 2 |
| C | 0 | 15230 | 2 |
| D | 0 | 32450 | 2 |
| Quadrant | Total seconds | Saturated seconds | Saturation percentage |
|---|---|---|---|
| A | 6923 | 423 | 6.110068% |
| B | 6923 | 1194 | 17.246858% |
| C | 6923 | 200 | 2.888921% |
| D | 6922 | 1255 | 18.130598% |
Noise dominated data is calculated using 1-second bins in cleaned event files. If a bin has >2000 counts, and if more than 50% of those come from <1% of pixels, then it is considered to be noise-dominated and hence unusable.
| Quadrant | # 1 sec bins | Bins with >0 counts | Bins with >2000 counts | High rate bins dominated by noise | Noise dominated (total time) | Noise dominated (detector-on time) | Marked lightcurve |
|---|---|---|---|---|---|---|---|
| A | 8013 | 6924 | 103 | 103 | 1.29% | 1.49% | 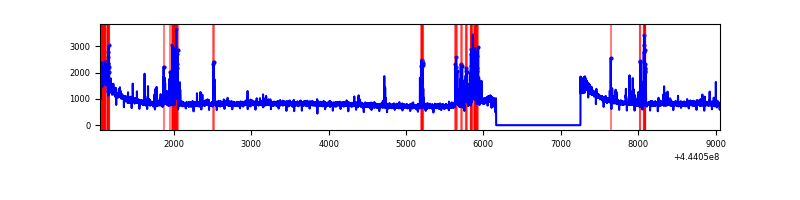 |
| B | 8013 | 6924 | 661 | 661 | 8.25% | 9.55% | 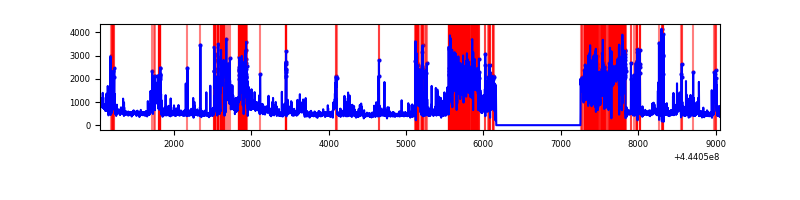 |
| C | 8013 | 6924 | 96 | 96 | 1.20% | 1.39% | 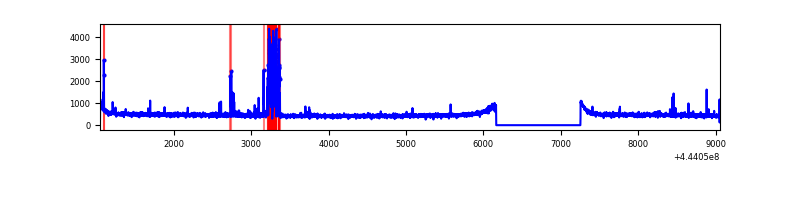 |
| D | 8012 | 6923 | 1060 | 1060 | 13.23% | 15.31% | 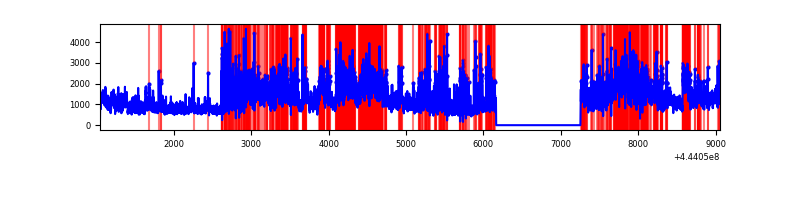 |
Top three noisy pixels from each quadrant. If the there are fewer than three noisy pixels in the level2.evt file, extra rows are filled as -1
| Pixel properties | Quadrant properties | ||||||
|---|---|---|---|---|---|---|---|
| Quadrant | DetID | PixID | Counts | Sigma | Mean | Median | Sigma |
| A | 10 | 83 | 2614373 | 15104.86 | 830 | 811 | 173.0 |
| A | 13 | 248 | 445191 | 2568.25 | 830 | 811 | 173.0 |
| A | 7 | 3 | 34254 | 193.28 | 830 | 811 | 173.0 |
| B | 4 | 171 | 1936785 | 13019.67 | 767 | 745 | 148.7 |
| B | 0 | 189 | 473473 | 3179.05 | 767 | 745 | 148.7 |
| B | 15 | 36 | 177298 | 1187.3 | 767 | 745 | 148.7 |
| C | 12 | 2 | 308065 | 1603.31 | 820 | 825 | 191.6 |
| C | 12 | 250 | 24573 | 123.92 | 820 | 825 | 191.6 |
| C | 14 | 254 | 21845 | 109.69 | 820 | 825 | 191.6 |
| D | 11 | 241 | 2829105 | 14353.9 | 784 | 761 | 197.0 |
| D | 13 | 174 | 1537983 | 7801.43 | 784 | 761 | 197.0 |
| D | 13 | 249 | 800861 | 4060.52 | 784 | 761 | 197.0 |
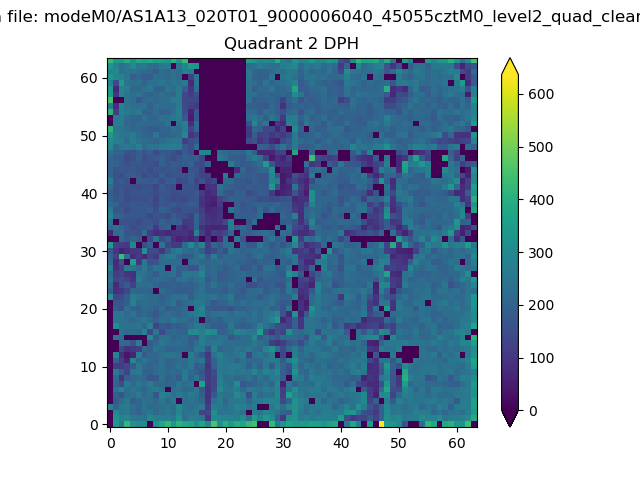
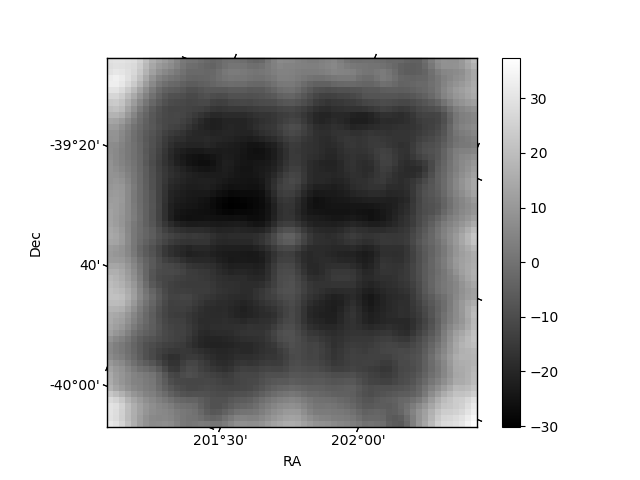
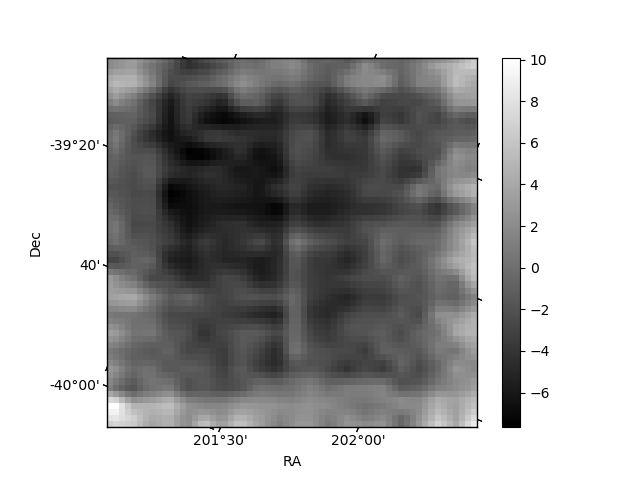
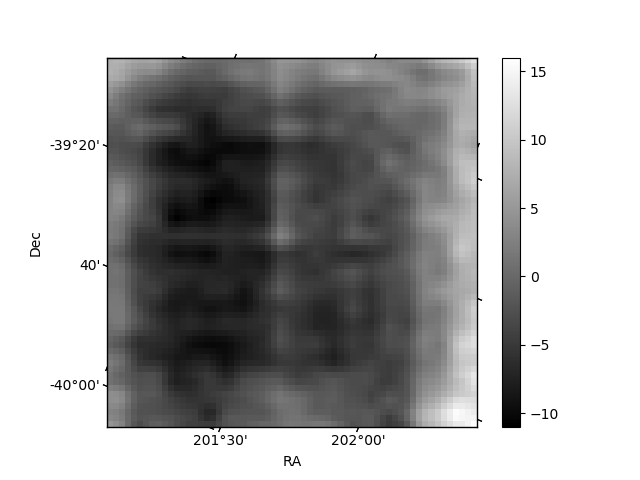
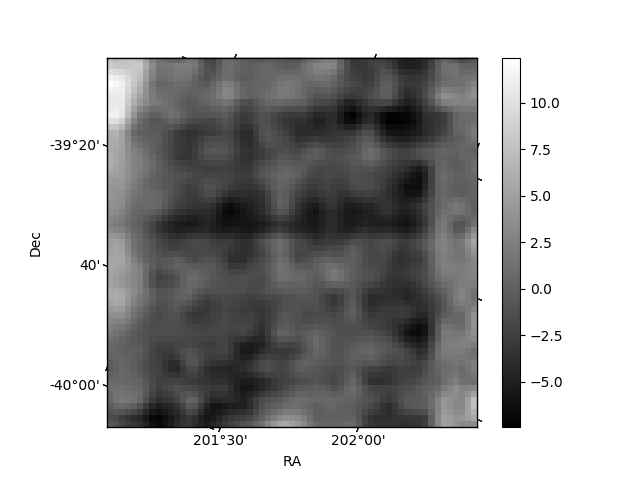
Histogram calculated using DETX and DETY for each event in the final _common_clean file
| Quadrant A | 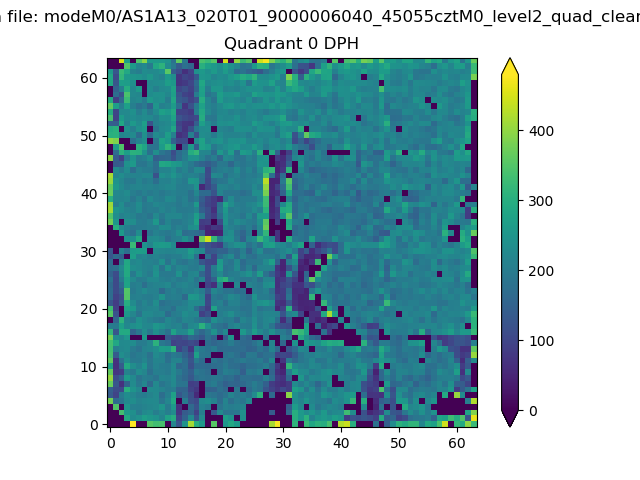 |
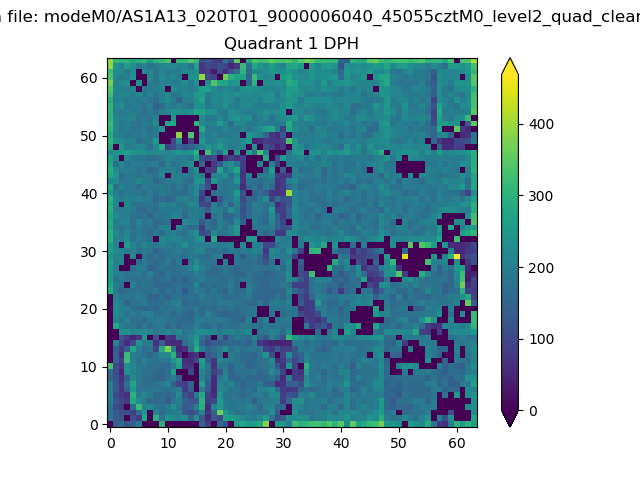 |
Quadrant B |
|---|---|---|---|
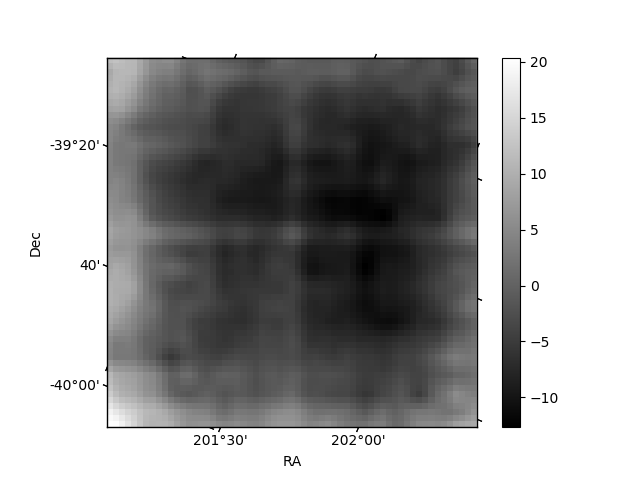
| Quadrant D | 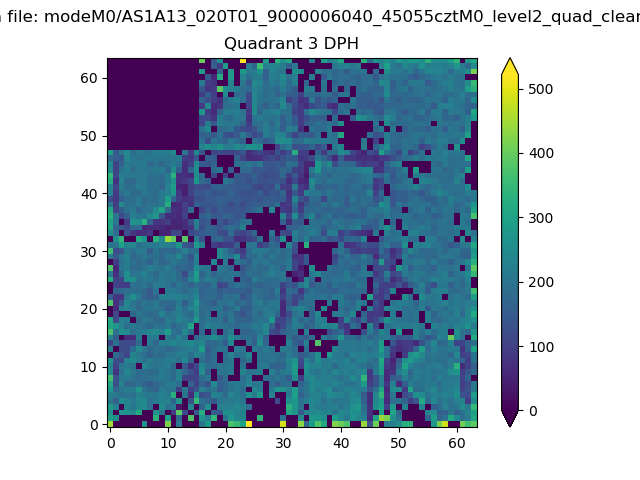 |
 |
Quadrant C |
| Plot type | Count rate plots | Images |
|---|---|---|
| Comparison with Poisson distribution Blue bars denote a histogram of data divided into 1 sec bins. Red curve is a Poisson curve with rate = median count rate of data. |
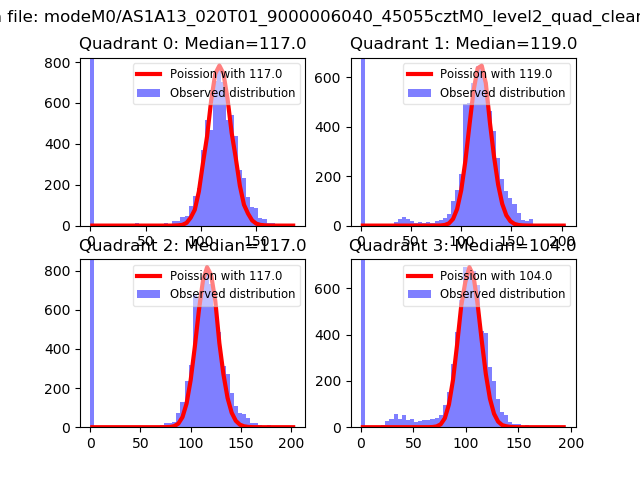 |
 |
| Quadrant-wise count rates Data is divided into 100 sec bins |
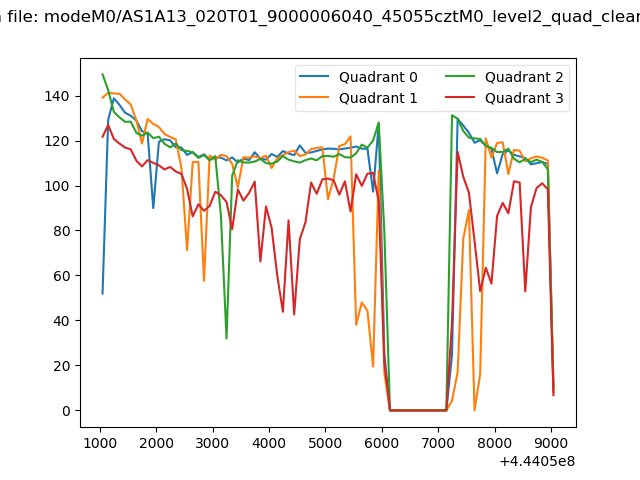 |
|
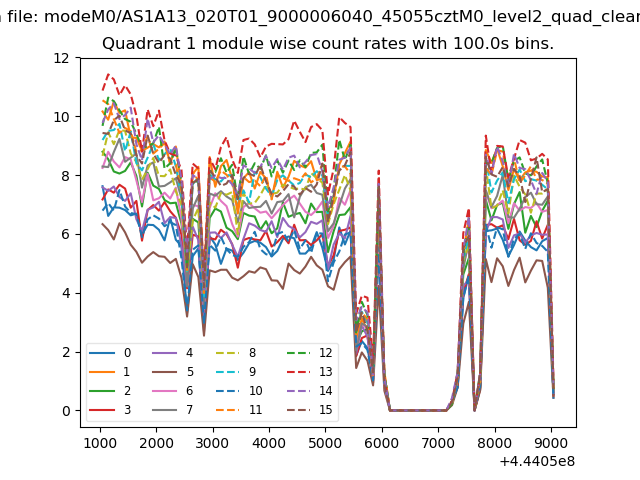
| Module-wise count rates for Quadrant A Data is divided into 100 sec bins |
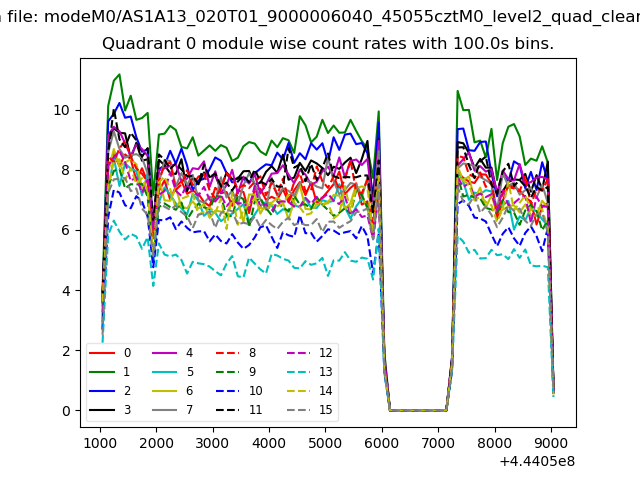 |
 |
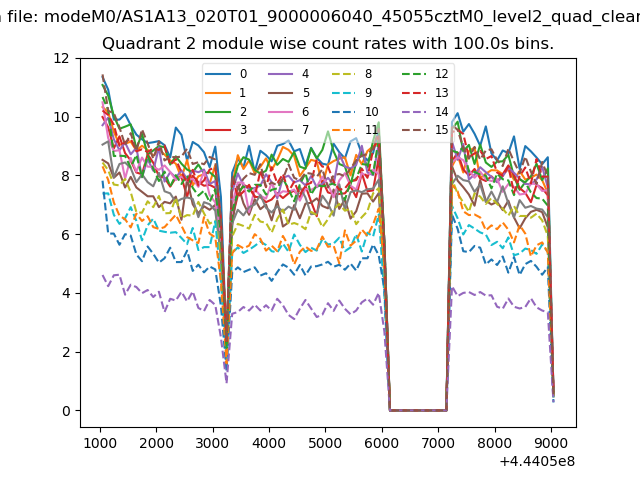
| Module-wise count rates for Quadrant B Data is divided into 100 sec bins |
 |
 |
| Module-wise count rates for Quadrant C Data is divided into 100 sec bins |
 |
 |
| Module-wise count rates for Quadrant D Data is divided into 100 sec bins |
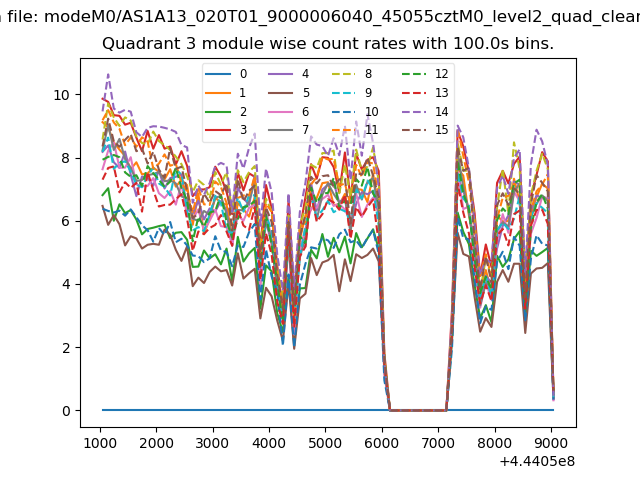 |
 |
| Parameter | Plot |
|---|---|
| CZT HV Monitor | 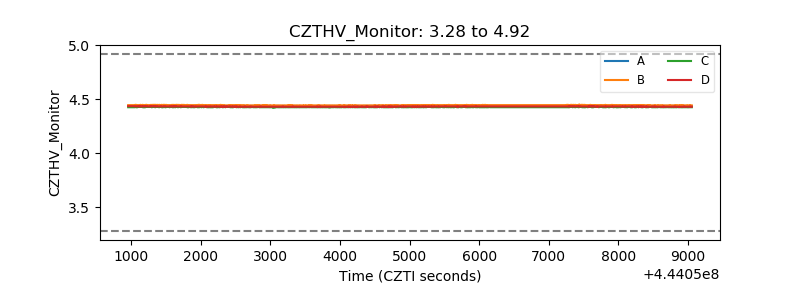 |
| D_VDD | 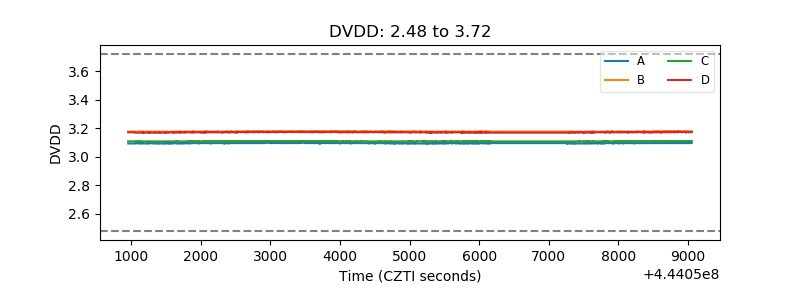 |
| Temperature 1 | 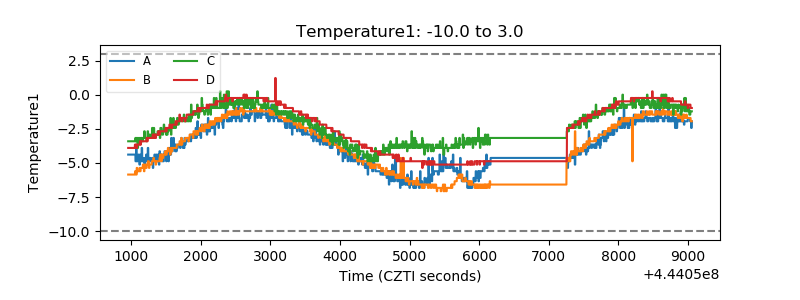 |
| Veto HV Monitor | 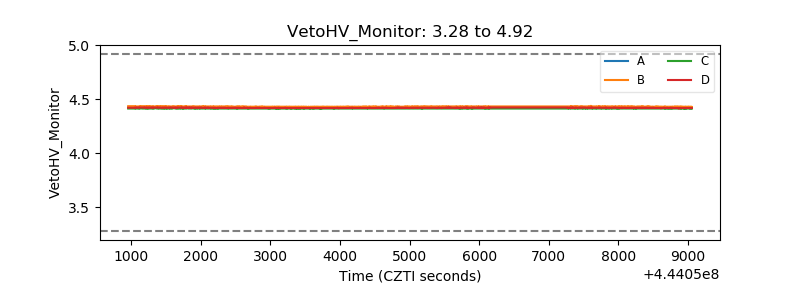 |
| Veto LLD | 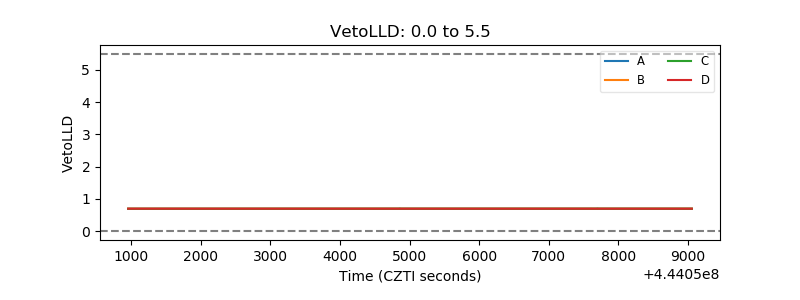 |
| Alpha Counter | 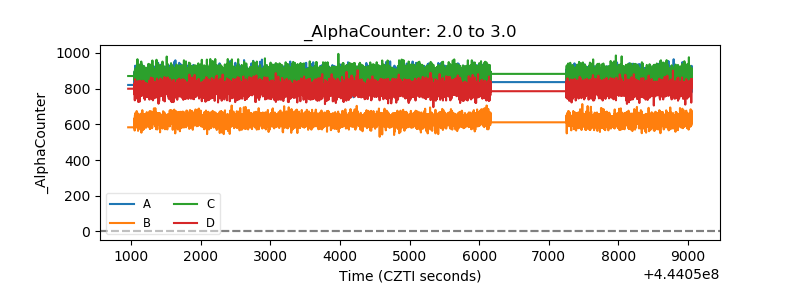 |
| _CPM_Rate | 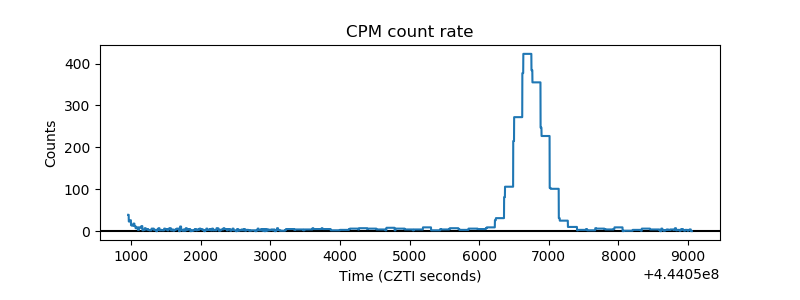 |
| CZT Counter | 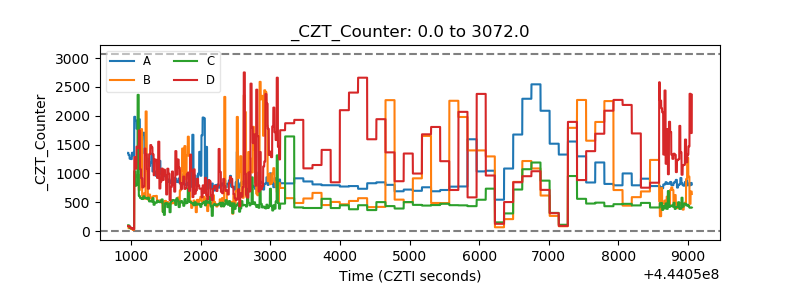 |
| +2.5 Volts monitor | 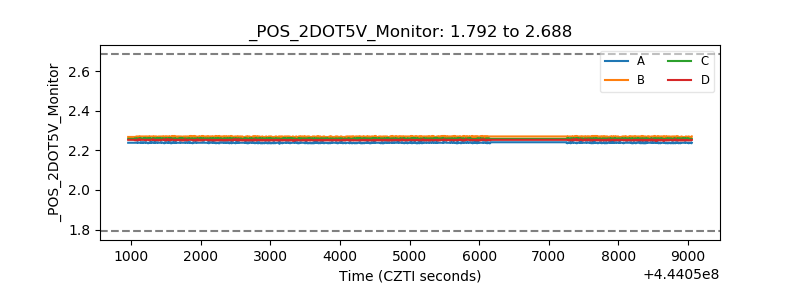 |
| +5 Volts monitor | 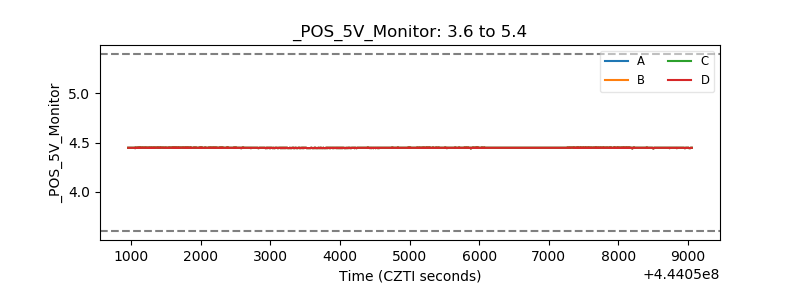 |
| _ROLL_ROT | 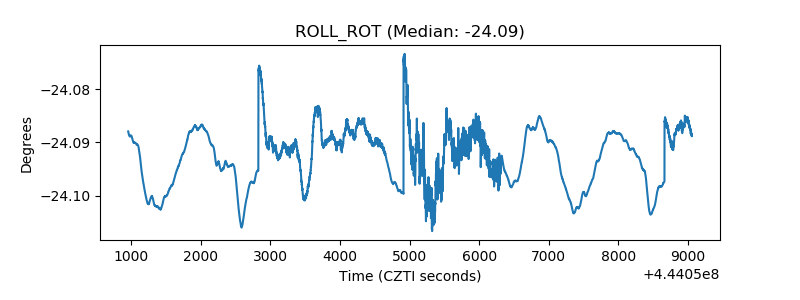 |
| _Roll_DEC | 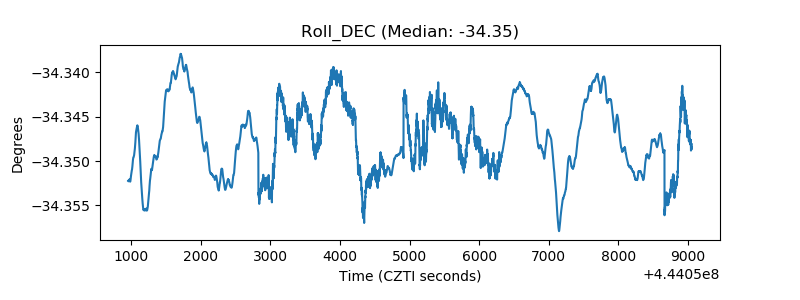 |
| _Roll_RA | 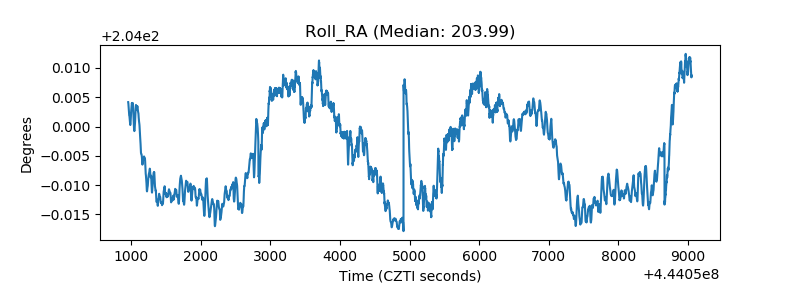 |
| Veto Counter | 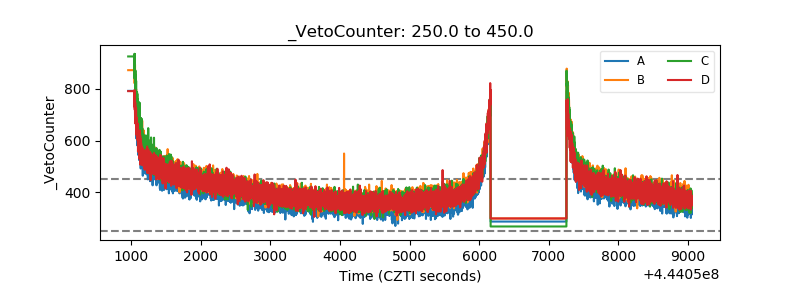 |