| Param | Original file | Final file |
|---|---|---|
| Filename | modeM0/AS1A13_020T01_9000006040_45056cztM0_level2.fits | modeM0/AS1A13_020T01_9000006040_45056cztM0_level2_quad_clean.evt |
| Size (bytes) | 583,600,320 | 102,182,400 |
| Size | 556.6 MB | 97.4 MB |
| Events in quadrant A | 5,371,896 | 684,668 |
| Events in quadrant B | 3,555,956 | 707,474 |
| Events in quadrant C | 2,981,330 | 697,827 |
| Events in quadrant D | 9,199,064 | 557,752 |
| Mode SS | |||
|---|---|---|---|
| Quadrant | BADHDUFLAG | Total packets | Discarded packets |
| A | 0 | 132 | 0 |
| B | 0 | 132 | 0 |
| C | 0 | 132 | 0 |
| D | 0 | 132 | 0 |
| Mode M9 | |||
|---|---|---|---|
| Quadrant | BADHDUFLAG | Total packets | Discarded packets |
| A | 0 | 8 | 0 |
| B | 0 | 8 | 0 |
| C | 0 | 8 | 0 |
| D | 0 | 8 | 0 |
| Mode M0 | |||
|---|---|---|---|
| Quadrant | BADHDUFLAG | Total packets | Discarded packets |
| A | 0 | 20368 | 1 |
| B | 0 | 14691 | 1 |
| C | 0 | 13387 | 2 |
| D | 0 | 31851 | 1 |
| Quadrant | Total seconds | Saturated seconds | Saturation percentage |
|---|---|---|---|
| A | 6386 | 320 | 5.010961% |
| B | 6387 | 261 | 4.086426% |
| C | 6386 | 128 | 2.004385% |
| D | 6386 | 1223 | 19.151268% |
Noise dominated data is calculated using 1-second bins in cleaned event files. If a bin has >2000 counts, and if more than 50% of those come from <1% of pixels, then it is considered to be noise-dominated and hence unusable.
| Quadrant | # 1 sec bins | Bins with >0 counts | Bins with >2000 counts | High rate bins dominated by noise | Noise dominated (total time) | Noise dominated (detector-on time) | Marked lightcurve |
|---|---|---|---|---|---|---|---|
| A | 7226 | 6387 | 31 | 31 | 0.43% | 0.49% | 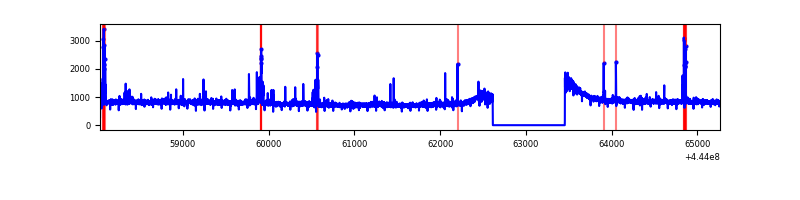 |
| B | 7227 | 6387 | 32 | 32 | 0.44% | 0.50% | 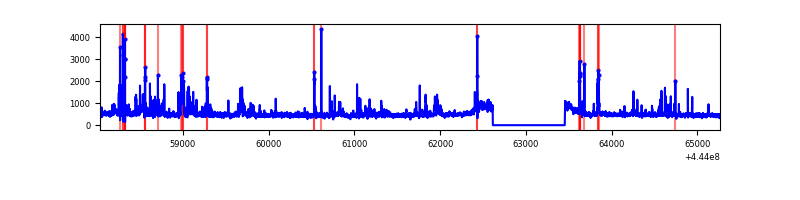 |
| C | 7226 | 6387 | 5 | 5 | 0.07% | 0.08% | 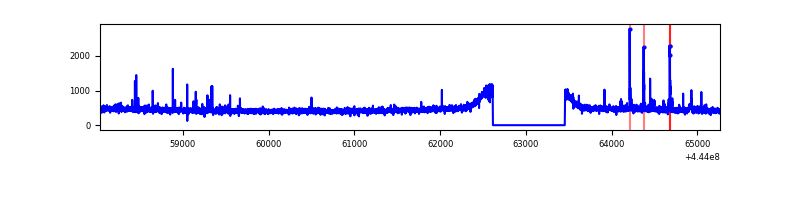 |
| D | 7226 | 6387 | 1075 | 1075 | 14.88% | 16.83% | 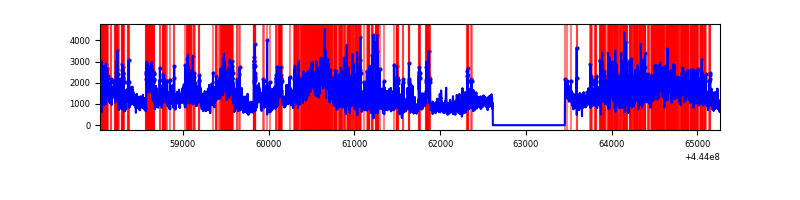 |
Top three noisy pixels from each quadrant. If the there are fewer than three noisy pixels in the level2.evt file, extra rows are filled as -1
| Pixel properties | Quadrant properties | ||||||
|---|---|---|---|---|---|---|---|
| Quadrant | DetID | PixID | Counts | Sigma | Mean | Median | Sigma |
| A | 10 | 83 | 2267201 | 14386.92 | 749 | 733 | 157.5 |
| A | 13 | 248 | 130113 | 821.27 | 749 | 733 | 157.5 |
| A | 15 | 174 | 30762 | 190.62 | 749 | 733 | 157.5 |
| B | 4 | 171 | 242525 | 1611.39 | 749 | 725 | 150.1 |
| B | 0 | 183 | 118404 | 784.23 | 749 | 725 | 150.1 |
| B | 15 | 36 | 81003 | 534.98 | 749 | 725 | 150.1 |
| C | 1 | 3 | 47769 | 267.59 | 744 | 749 | 175.7 |
| C | 3 | 233 | 9250 | 48.38 | 744 | 749 | 175.7 |
| C | 12 | 2 | 8180 | 42.29 | 744 | 749 | 175.7 |
| D | 11 | 241 | 3444046 | 19144.63 | 711 | 689 | 179.9 |
| D | 13 | 174 | 1051250 | 5840.99 | 711 | 689 | 179.9 |
| D | 13 | 249 | 561695 | 3119.12 | 711 | 689 | 179.9 |
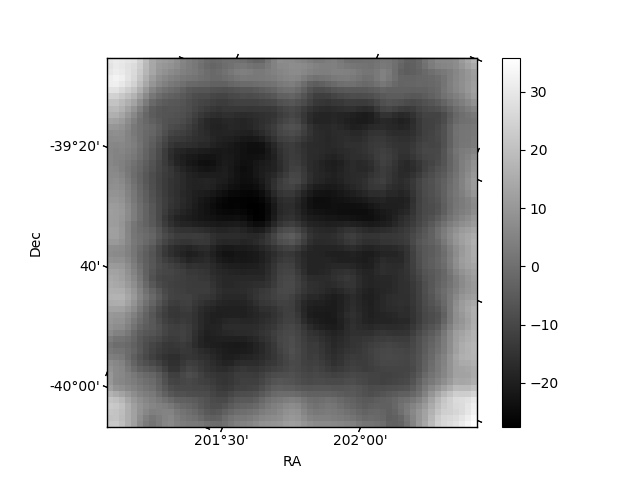
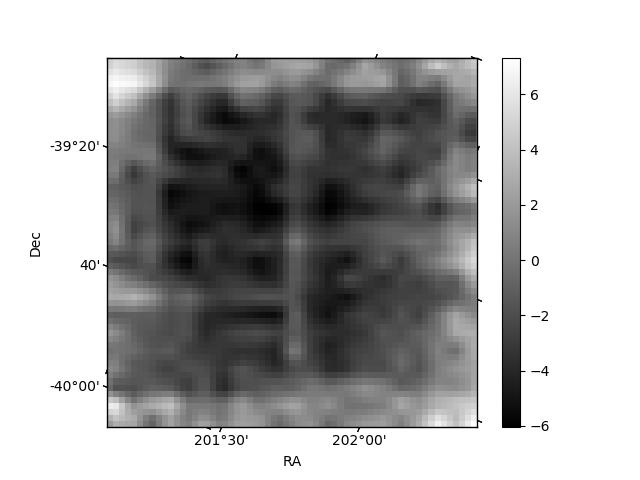
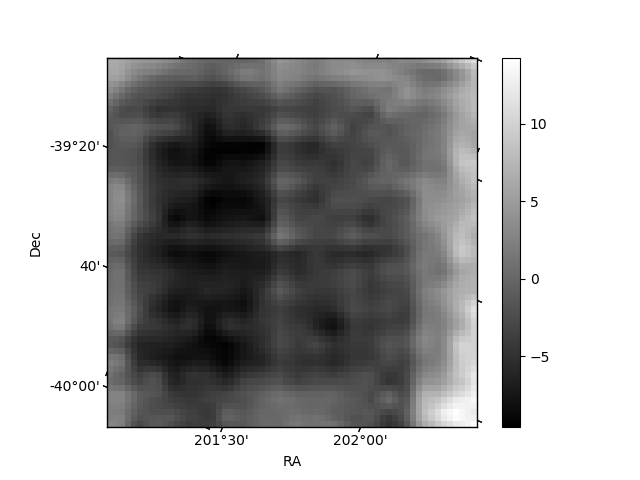
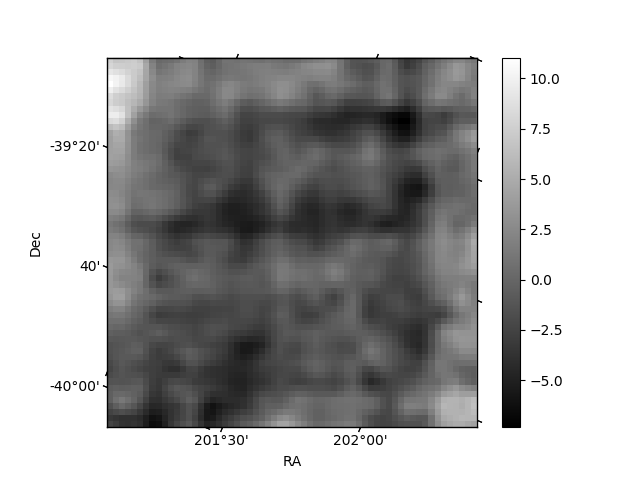
Histogram calculated using DETX and DETY for each event in the final _common_clean file
| Quadrant A | 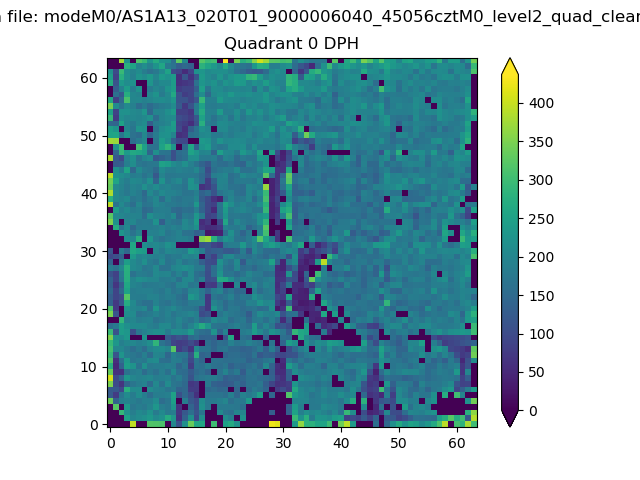 |
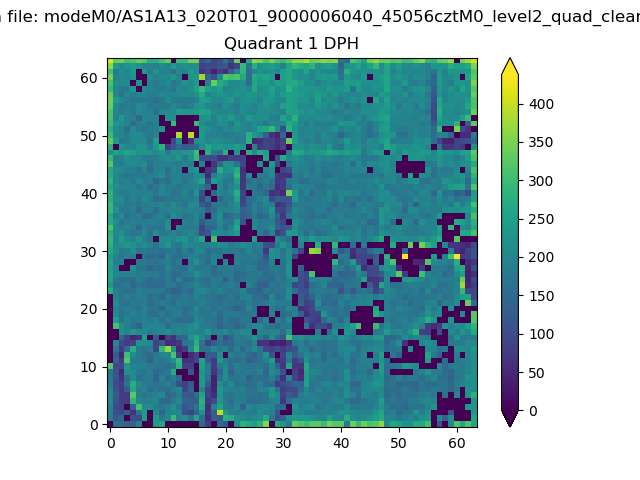 |
Quadrant B |
|---|---|---|---|
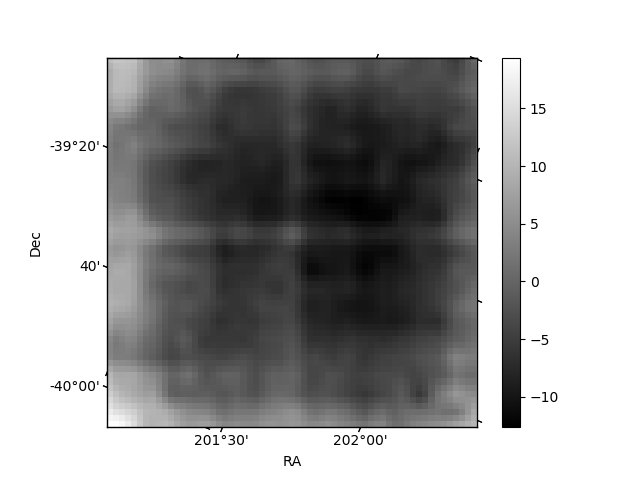
| Quadrant D | 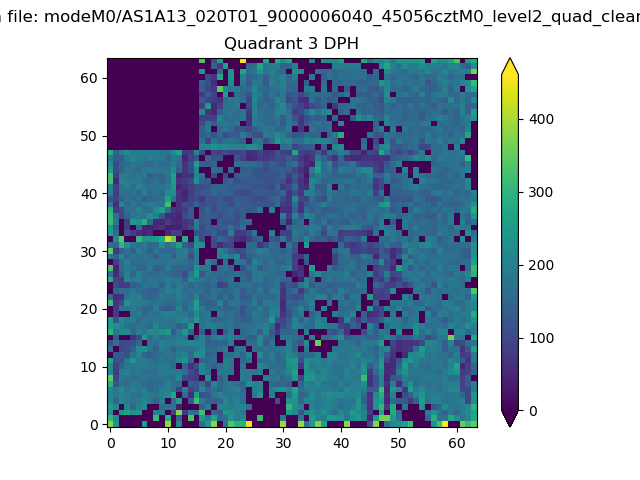 |
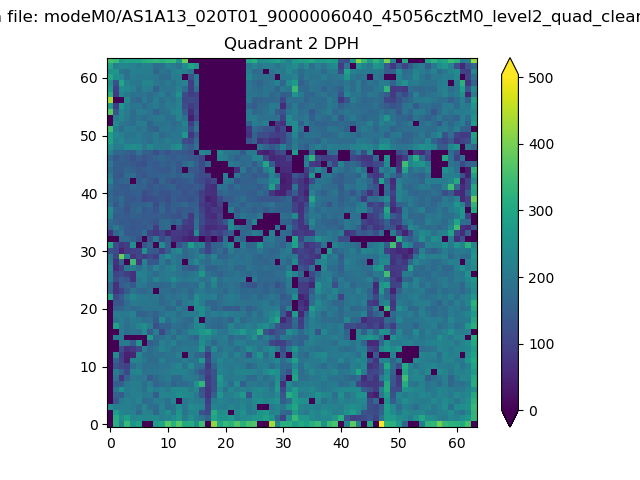 |
Quadrant C |
| Plot type | Count rate plots | Images |
|---|---|---|
| Comparison with Poisson distribution Blue bars denote a histogram of data divided into 1 sec bins. Red curve is a Poisson curve with rate = median count rate of data. |
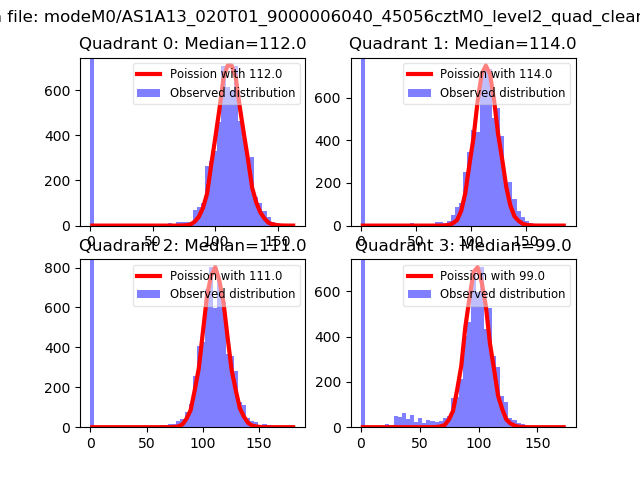 |
 |
| Quadrant-wise count rates Data is divided into 100 sec bins |
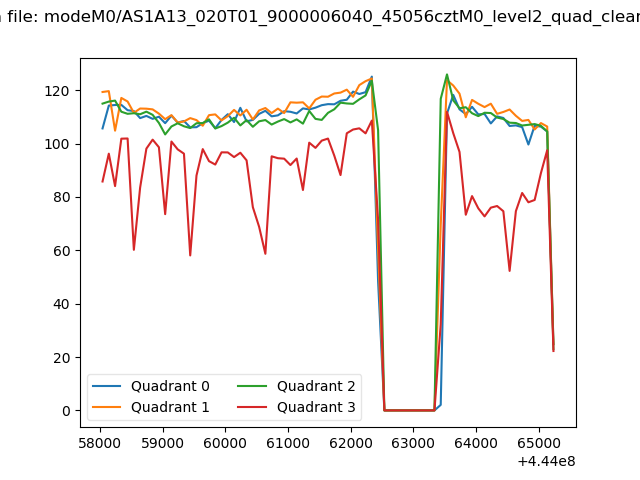 |
|
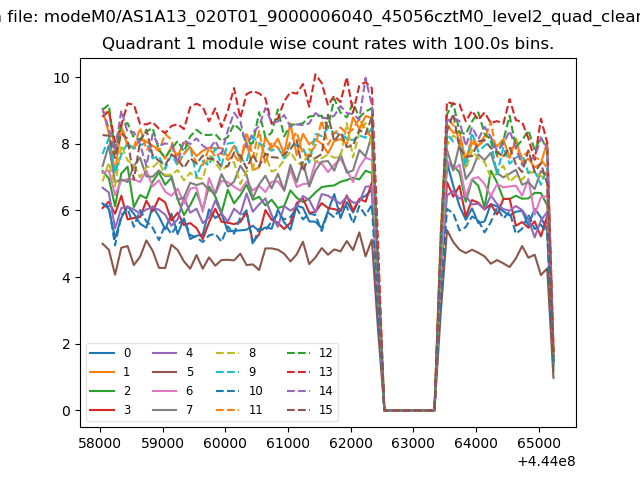
| Module-wise count rates for Quadrant A Data is divided into 100 sec bins |
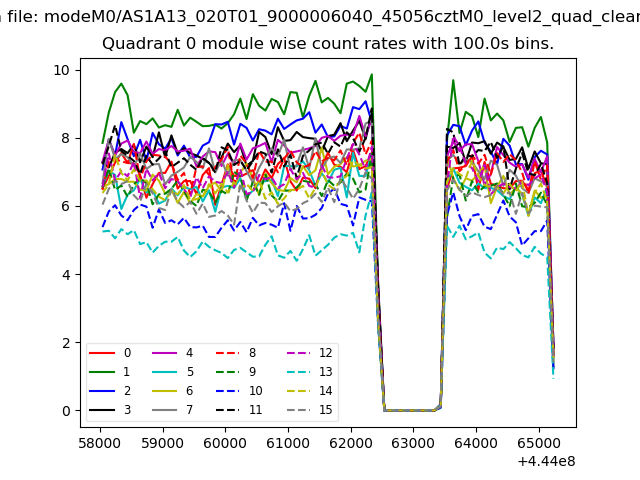 |
 |
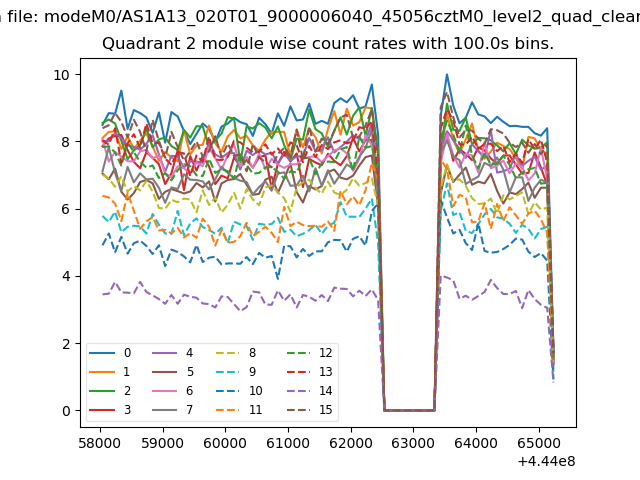
| Module-wise count rates for Quadrant B Data is divided into 100 sec bins |
 |
 |
| Module-wise count rates for Quadrant C Data is divided into 100 sec bins |
 |
 |
| Module-wise count rates for Quadrant D Data is divided into 100 sec bins |
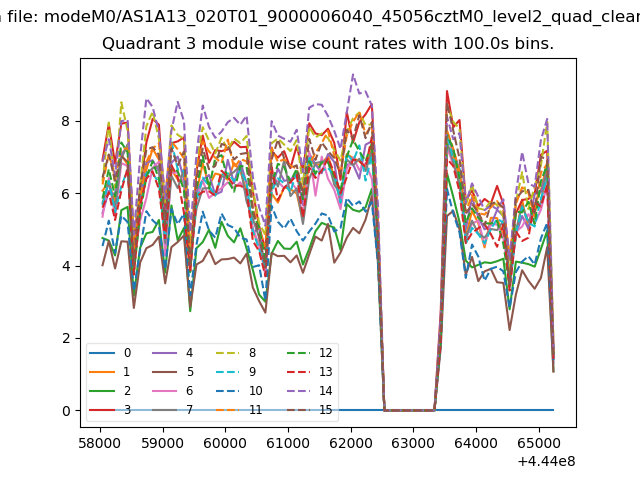 |
 |
| Parameter | Plot |
|---|---|
| CZT HV Monitor | 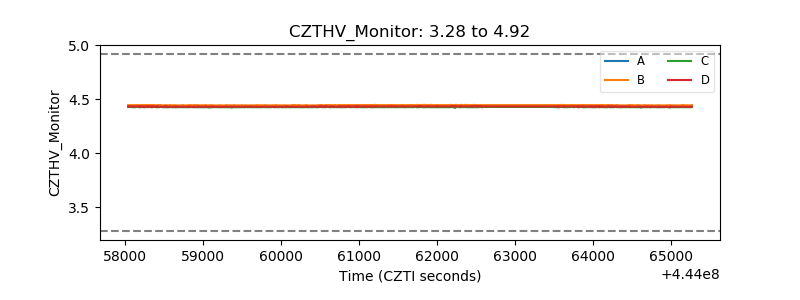 |
| D_VDD | 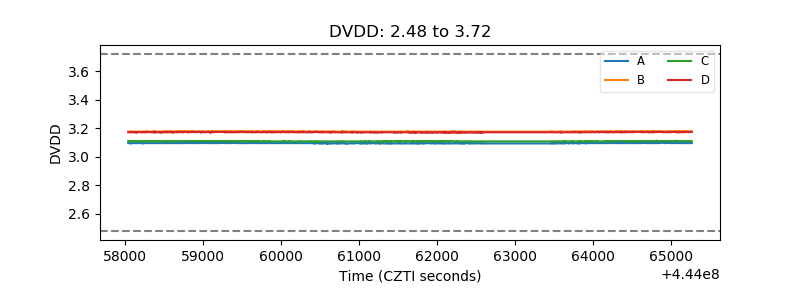 |
| Temperature 1 | 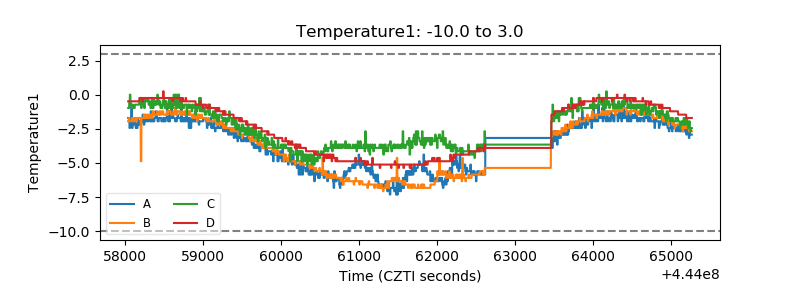 |
| Veto HV Monitor | 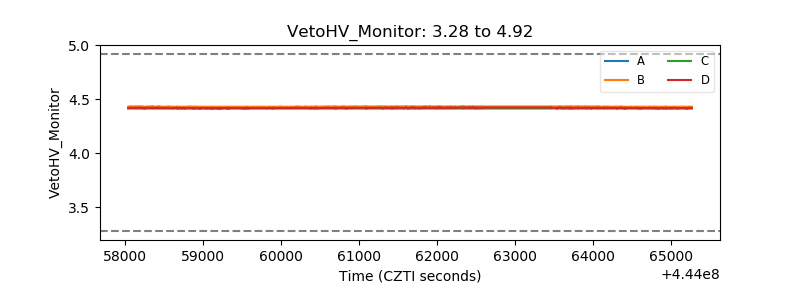 |
| Veto LLD | 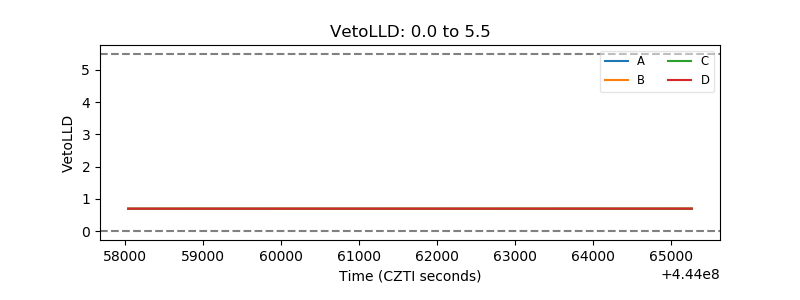 |
| Alpha Counter | 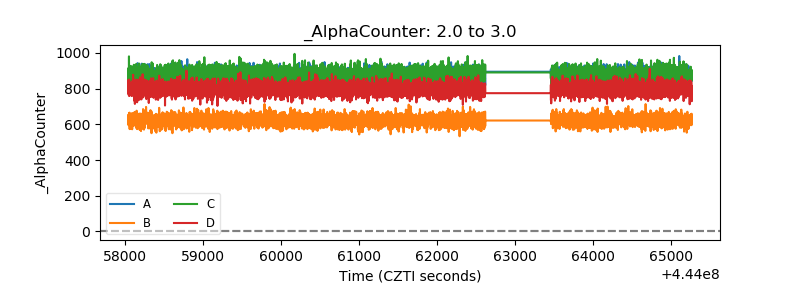 |
| _CPM_Rate | 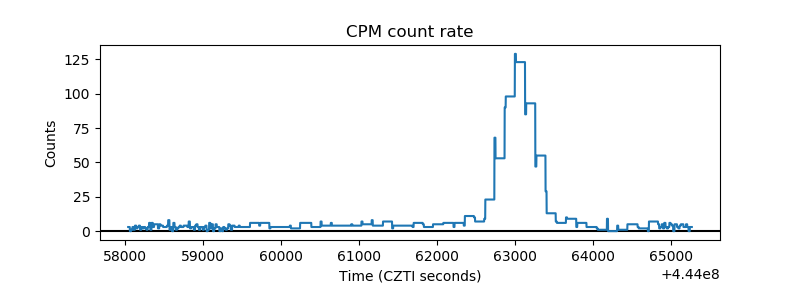 |
| CZT Counter | 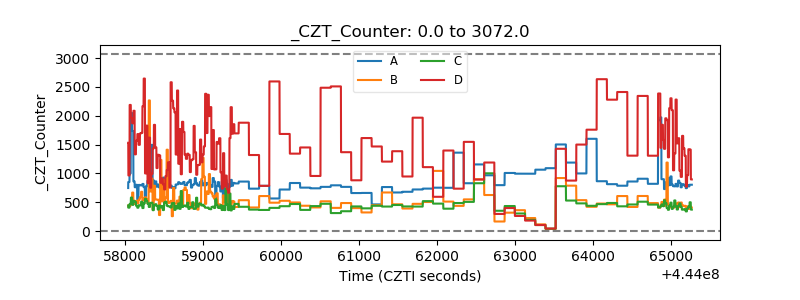 |
| +2.5 Volts monitor | 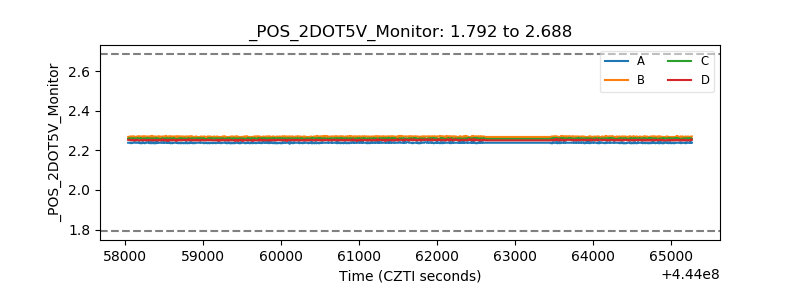 |
| +5 Volts monitor | 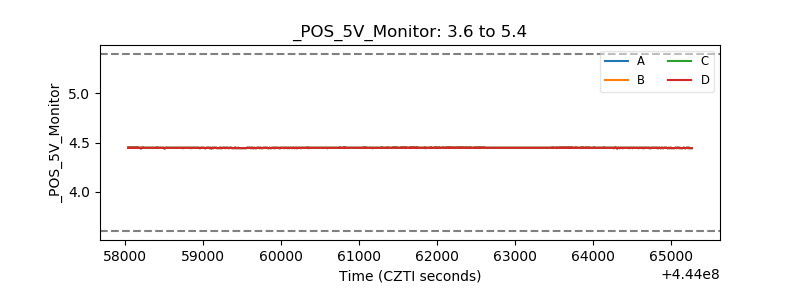 |
| _ROLL_ROT | 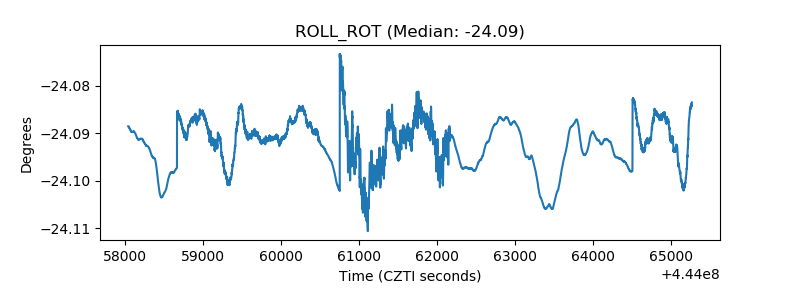 |
| _Roll_DEC | 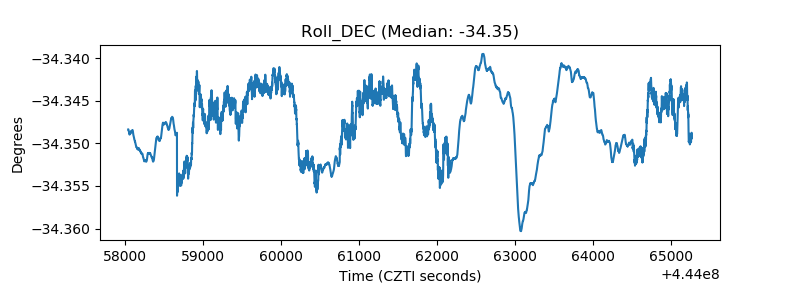 |
| _Roll_RA | 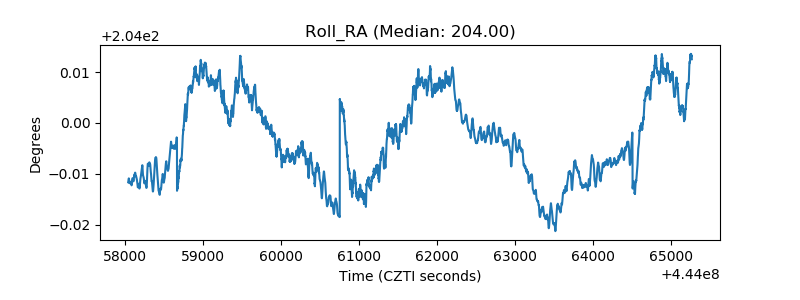 |
| Veto Counter | 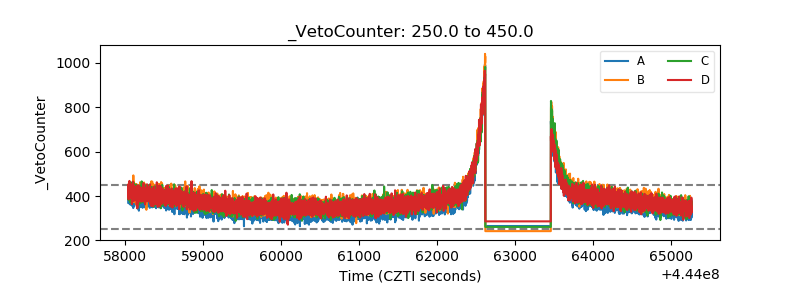 |