| Param | Original file | Final file |
|---|---|---|
| Filename | modeM0/AS1A13_020T01_9000006040_45057cztM0_level2.fits | modeM0/AS1A13_020T01_9000006040_45057cztM0_level2_quad_clean.evt |
| Size (bytes) | 735,278,400 | 113,385,600 |
| Size | 701.2 MB | 108.1 MB |
| Events in quadrant A | 6,256,267 | 784,057 |
| Events in quadrant B | 3,824,948 | 815,134 |
| Events in quadrant C | 3,562,621 | 806,849 |
| Events in quadrant D | 12,997,749 | 508,523 |
| Mode SS | |||
|---|---|---|---|
| Quadrant | BADHDUFLAG | Total packets | Discarded packets |
| A | 0 | 152 | 0 |
| B | 0 | 152 | 0 |
| C | 0 | 152 | 0 |
| D | 0 | 152 | 0 |
| Mode M9 | |||
|---|---|---|---|
| Quadrant | BADHDUFLAG | Total packets | Discarded packets |
| A | 0 | 6 | 0 |
| B | 0 | 7 | 0 |
| C | 0 | 7 | 0 |
| D | 0 | 7 | 0 |
| Mode M0 | |||
|---|---|---|---|
| Quadrant | BADHDUFLAG | Total packets | Discarded packets |
| A | 0 | 23834 | 3 |
| B | 0 | 16428 | 3 |
| C | 0 | 15909 | 3 |
| D | 0 | 43803 | 3 |
| Quadrant | Total seconds | Saturated seconds | Saturation percentage |
|---|---|---|---|
| A | 7444 | 372 | 4.997313% |
| B | 7444 | 255 | 3.425578% |
| C | 7444 | 95 | 1.276196% |
| D | 7444 | 2737 | 36.767867% |
Noise dominated data is calculated using 1-second bins in cleaned event files. If a bin has >2000 counts, and if more than 50% of those come from <1% of pixels, then it is considered to be noise-dominated and hence unusable.
| Quadrant | # 1 sec bins | Bins with >0 counts | Bins with >2000 counts | High rate bins dominated by noise | Noise dominated (total time) | Noise dominated (detector-on time) | Marked lightcurve |
|---|---|---|---|---|---|---|---|
| A | 7974 | 7446 | 18 | 18 | 0.23% | 0.24% | 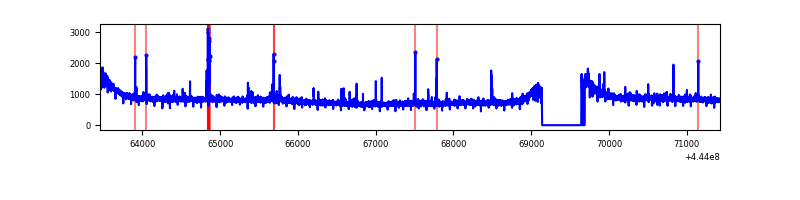 |
| B | 7974 | 7446 | 44 | 44 | 0.55% | 0.59% | 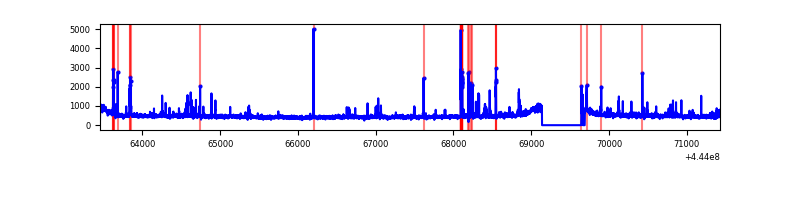 |
| C | 7974 | 7446 | 18 | 18 | 0.23% | 0.24% | 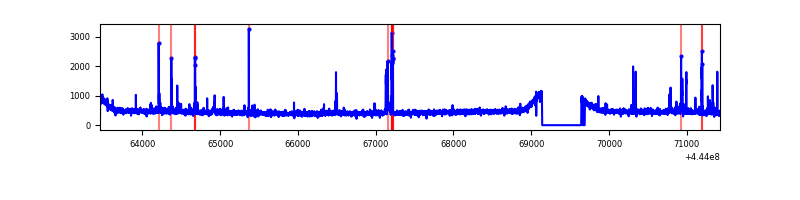 |
| D | 7974 | 7446 | 2446 | 2446 | 30.67% | 32.85% | 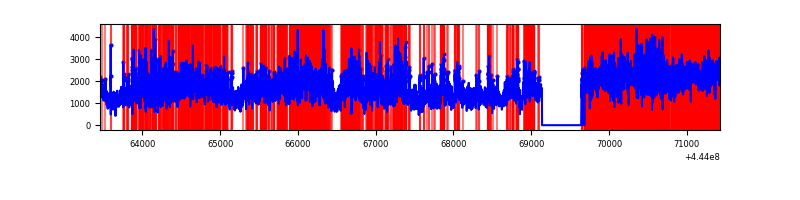 |
Top three noisy pixels from each quadrant. If the there are fewer than three noisy pixels in the level2.evt file, extra rows are filled as -1
| Pixel properties | Quadrant properties | ||||||
|---|---|---|---|---|---|---|---|
| Quadrant | DetID | PixID | Counts | Sigma | Mean | Median | Sigma |
| A | 10 | 83 | 2747959 | 15294.28 | 866 | 845 | 179.6 |
| A | 13 | 248 | 64949 | 356.89 | 866 | 845 | 179.6 |
| A | 0 | 243 | 40513 | 220.85 | 866 | 845 | 179.6 |
| B | 5 | 255 | 100813 | 579.77 | 868 | 841 | 172.4 |
| B | 5 | 32 | 91071 | 523.27 | 868 | 841 | 172.4 |
| B | 0 | 183 | 74175 | 425.28 | 868 | 841 | 172.4 |
| C | 1 | 3 | 115568 | 562.11 | 863 | 867 | 204.1 |
| C | 12 | 250 | 40746 | 195.43 | 863 | 867 | 204.1 |
| C | 12 | 2 | 19106 | 89.38 | 863 | 867 | 204.1 |
| D | 11 | 241 | 4621285 | 23338.2 | 764 | 739 | 198.0 |
| D | 13 | 174 | 2753471 | 13903.94 | 764 | 739 | 198.0 |
| D | 5 | 235 | 779751 | 3934.76 | 764 | 739 | 198.0 |
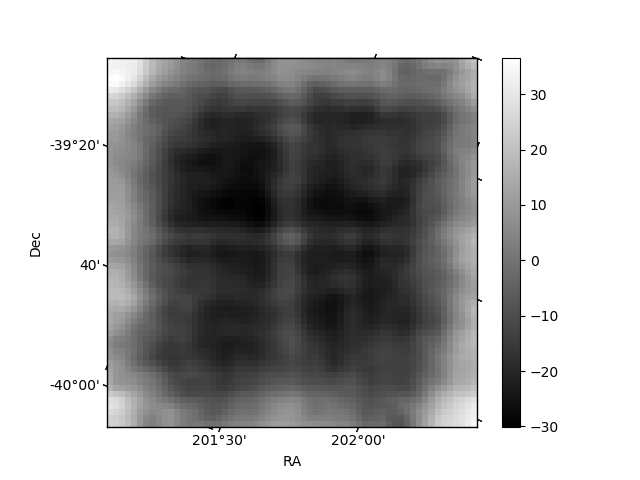
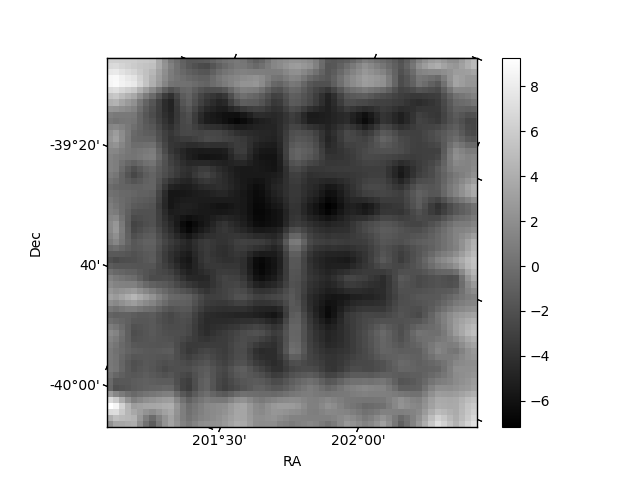
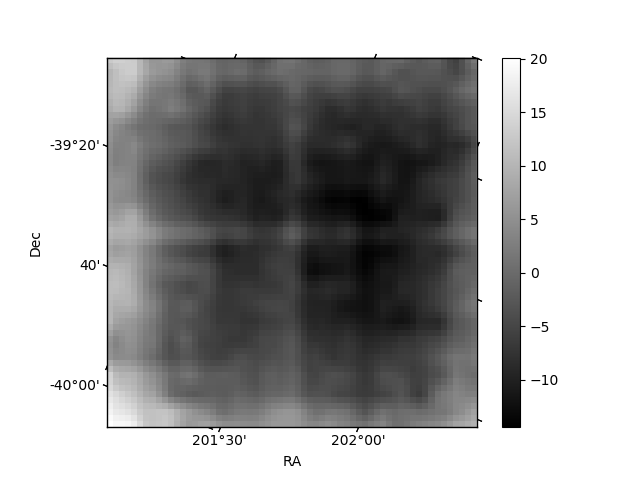
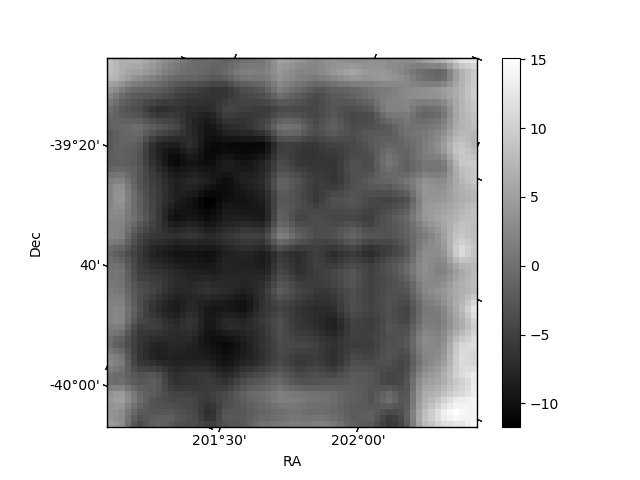
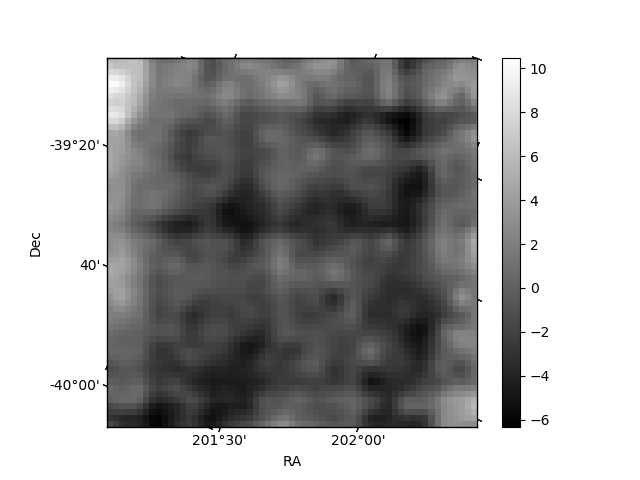
Histogram calculated using DETX and DETY for each event in the final _common_clean file
| Quadrant A | 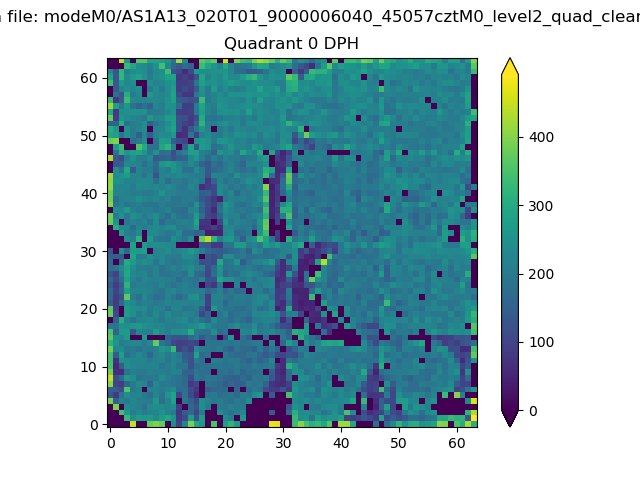 |
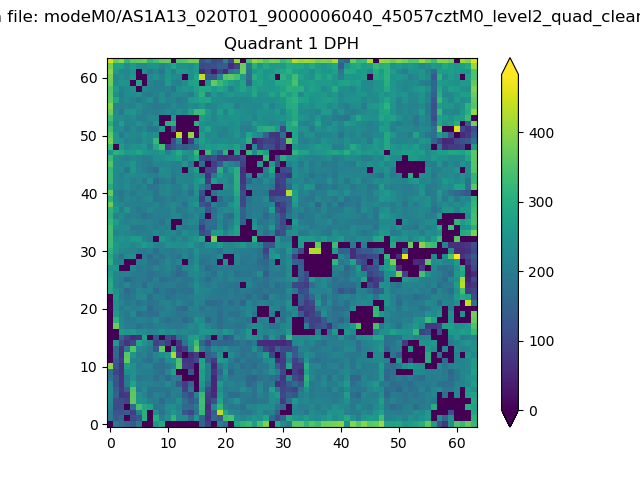 |
Quadrant B |
|---|---|---|---|
| Quadrant D | 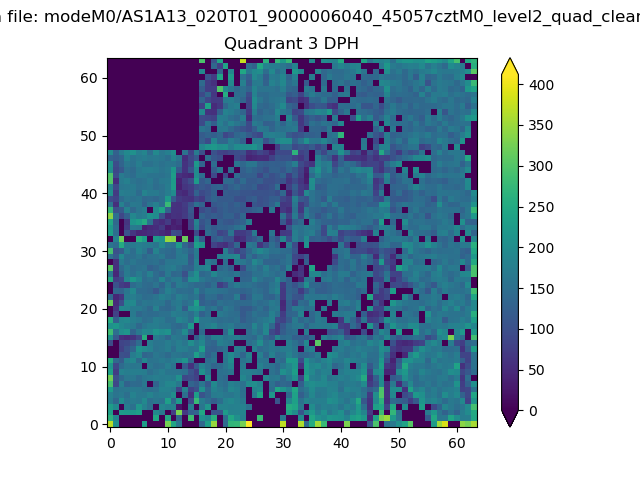 |
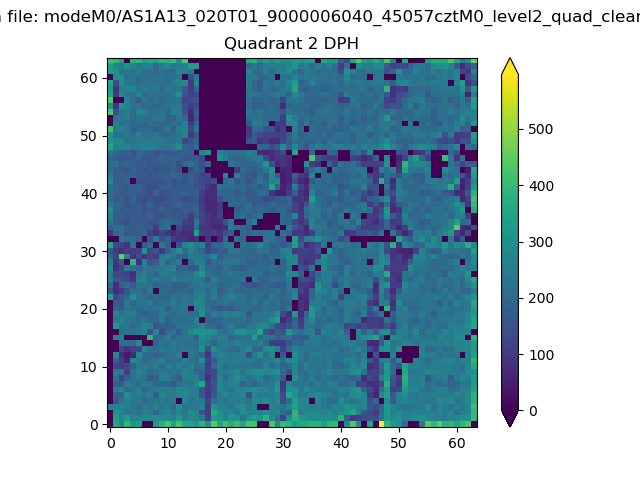 |
Quadrant C |
| Plot type | Count rate plots | Images |
|---|---|---|
| Comparison with Poisson distribution Blue bars denote a histogram of data divided into 1 sec bins. Red curve is a Poisson curve with rate = median count rate of data. |
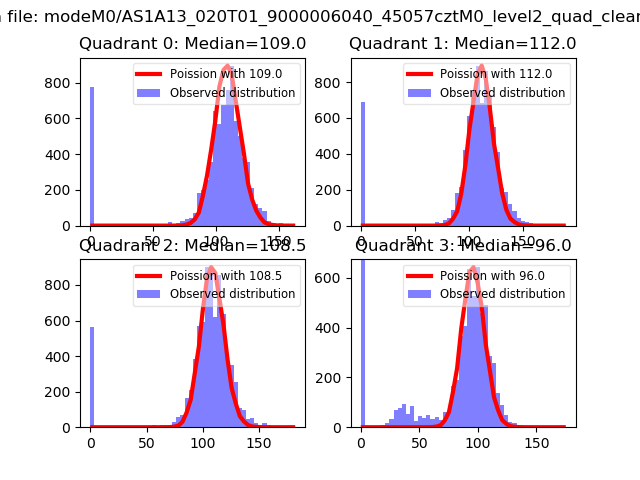 |
 |
| Quadrant-wise count rates Data is divided into 100 sec bins |
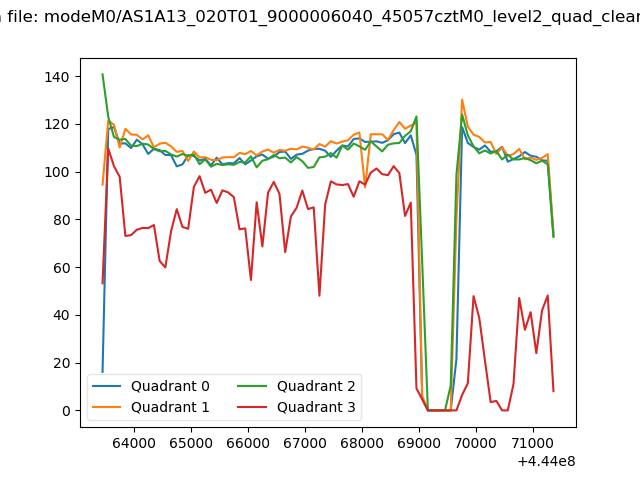 |
|
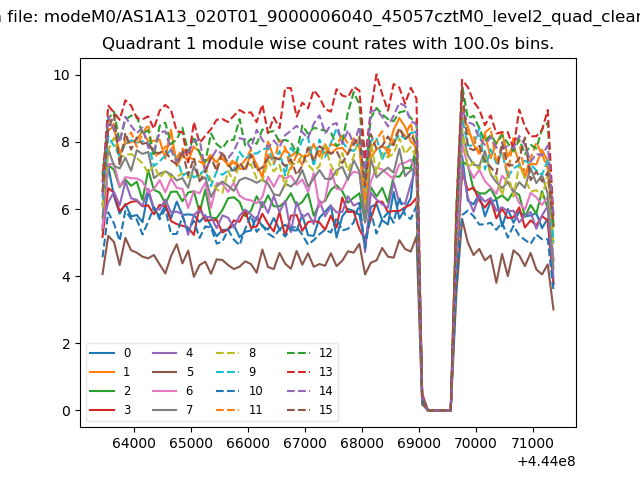
| Module-wise count rates for Quadrant A Data is divided into 100 sec bins |
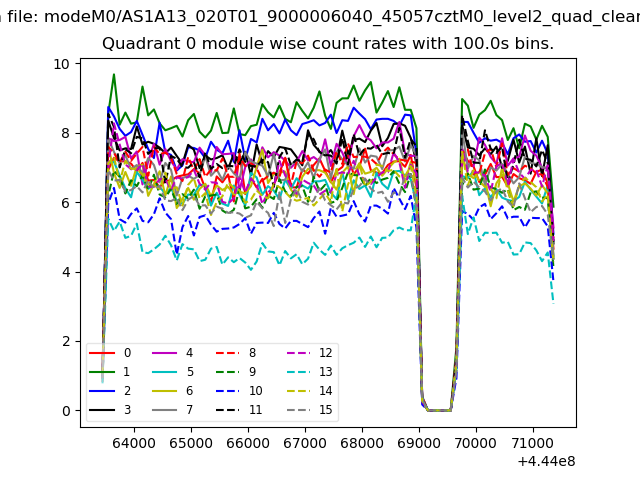 |
 |
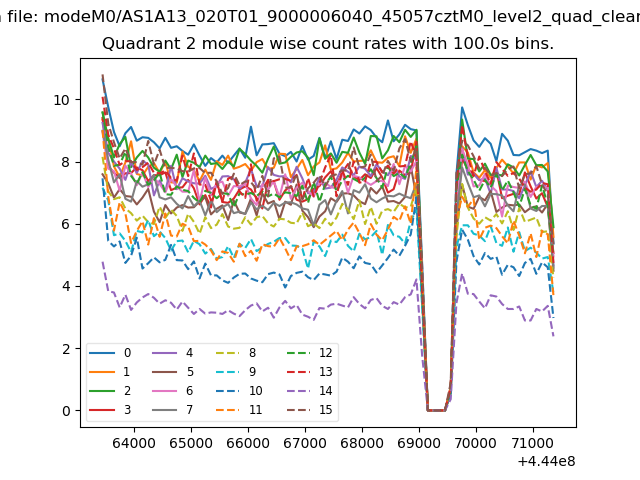
| Module-wise count rates for Quadrant B Data is divided into 100 sec bins |
 |
 |
| Module-wise count rates for Quadrant C Data is divided into 100 sec bins |
 |
 |
| Module-wise count rates for Quadrant D Data is divided into 100 sec bins |
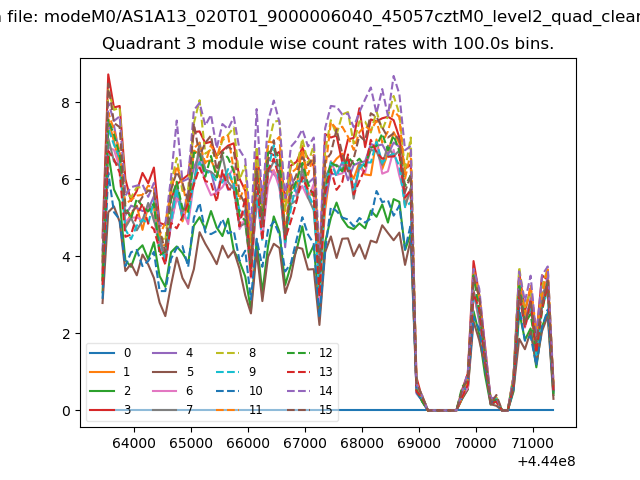 |
 |
| Parameter | Plot |
|---|---|
| CZT HV Monitor | 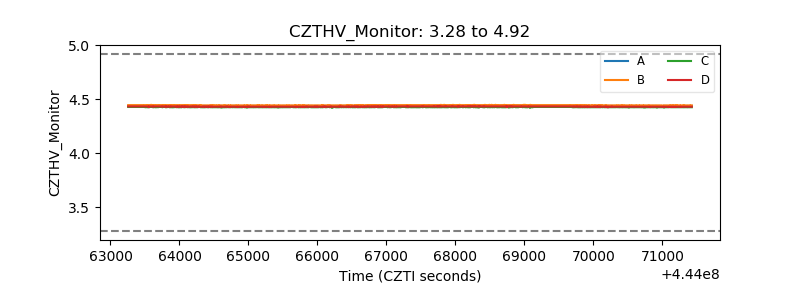 |
| D_VDD | 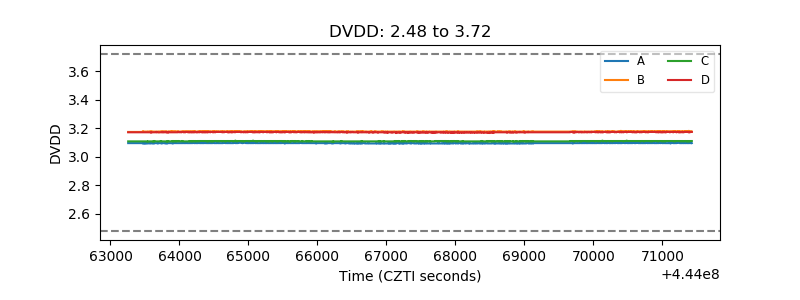 |
| Temperature 1 | 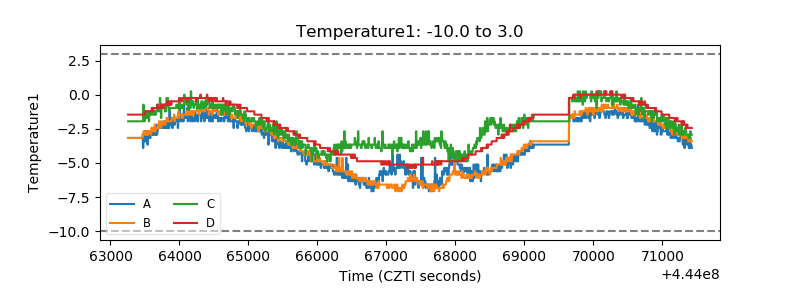 |
| Veto HV Monitor | 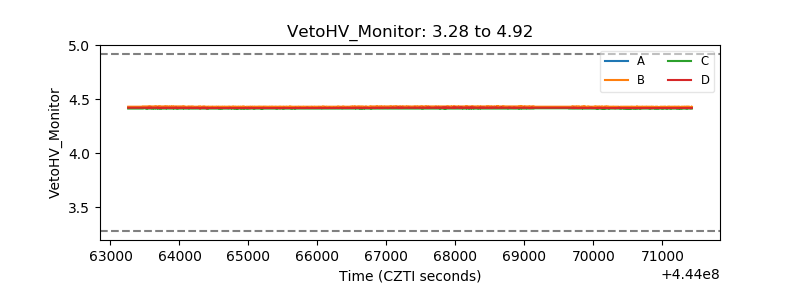 |
| Veto LLD | 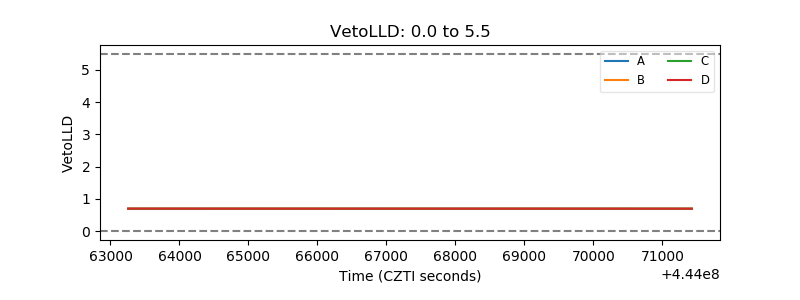 |
| Alpha Counter | 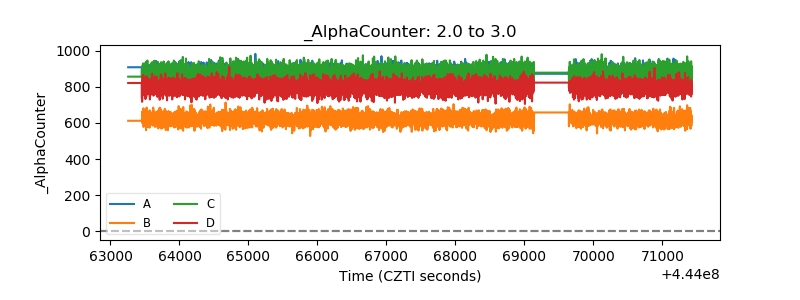 |
| _CPM_Rate | 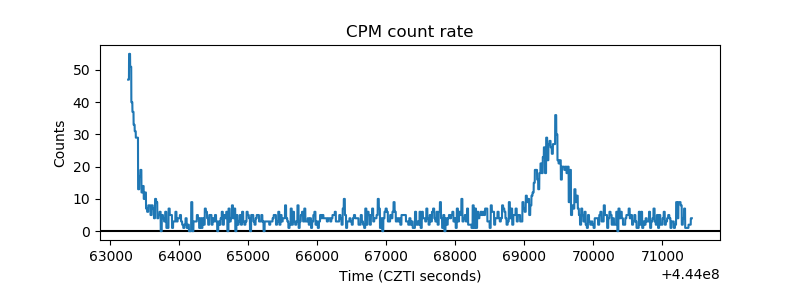 |
| CZT Counter | 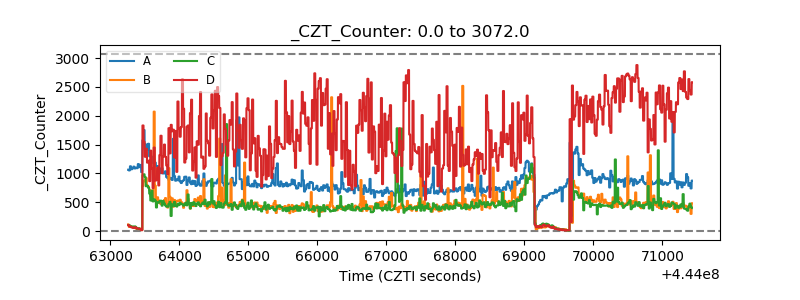 |
| +2.5 Volts monitor | 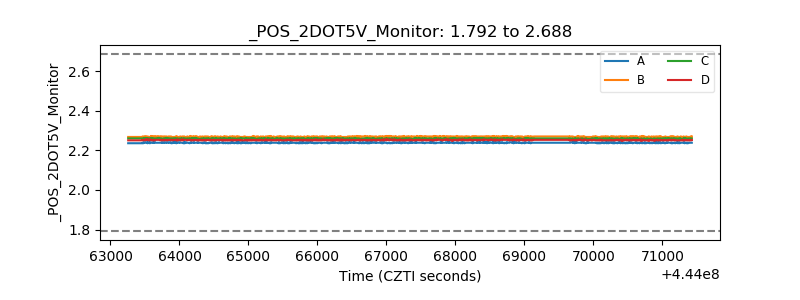 |
| +5 Volts monitor | 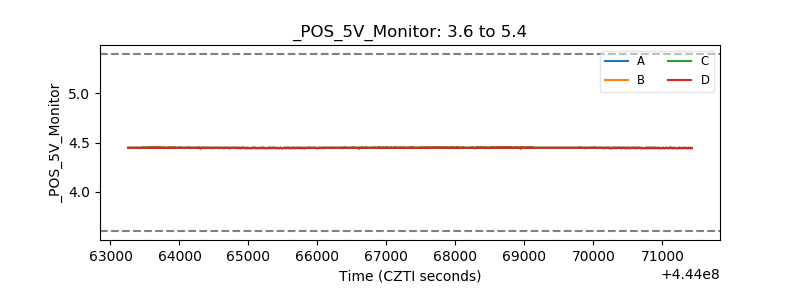 |
| _ROLL_ROT | 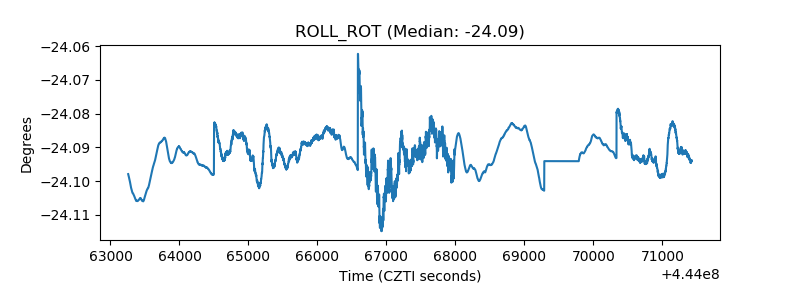 |
| _Roll_DEC | 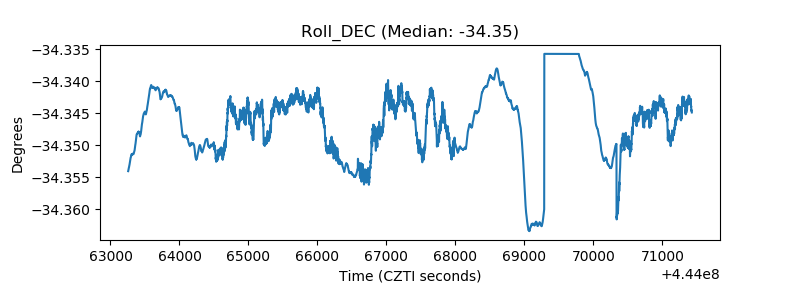 |
| _Roll_RA | 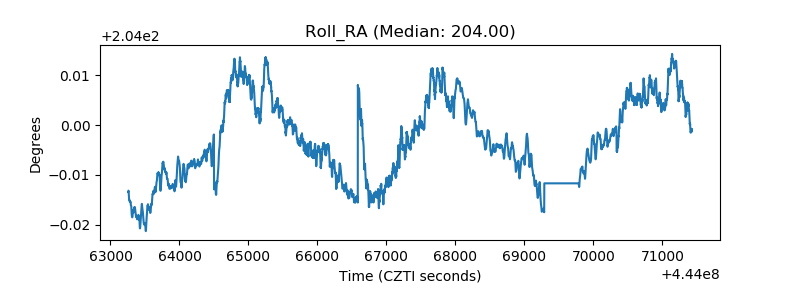 |
| Veto Counter | 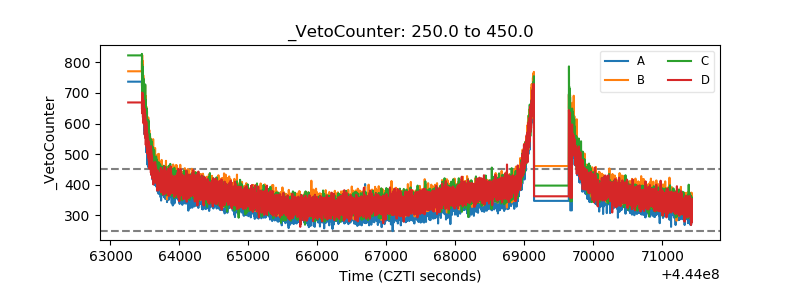 |