| Param | Original file | Final file |
|---|---|---|
| Filename | modeM0/AS1A13_020T01_9000006040_45059cztM0_level2.fits | modeM0/AS1A13_020T01_9000006040_45059cztM0_level2_quad_clean.evt |
| Size (bytes) | 863,461,440 | 117,601,920 |
| Size | 823.5 MB | 112.2 MB |
| Events in quadrant A | 6,731,706 | 864,119 |
| Events in quadrant B | 4,274,826 | 893,482 |
| Events in quadrant C | 4,034,763 | 873,523 |
| Events in quadrant D | 16,286,369 | 359,585 |
| Mode SS | |||
|---|---|---|---|
| Quadrant | BADHDUFLAG | Total packets | Discarded packets |
| A | 0 | 164 | 0 |
| B | 0 | 164 | 0 |
| C | 0 | 164 | 0 |
| D | 0 | 164 | 0 |
| Mode M0 | |||
|---|---|---|---|
| Quadrant | BADHDUFLAG | Total packets | Discarded packets |
| A | 0 | 25975 | 0 |
| B | 0 | 18468 | 0 |
| C | 0 | 18016 | 0 |
| D | 0 | 53996 | 4 |
| Quadrant | Total seconds | Saturated seconds | Saturation percentage |
|---|---|---|---|
| A | 8196 | 363 | 4.428990% |
| B | 8196 | 276 | 3.367496% |
| C | 8196 | 128 | 1.561737% |
| D | 8196 | 4853 | 59.211811% |
Noise dominated data is calculated using 1-second bins in cleaned event files. If a bin has >2000 counts, and if more than 50% of those come from <1% of pixels, then it is considered to be noise-dominated and hence unusable.
| Quadrant | # 1 sec bins | Bins with >0 counts | Bins with >2000 counts | High rate bins dominated by noise | Noise dominated (total time) | Noise dominated (detector-on time) | Marked lightcurve |
|---|---|---|---|---|---|---|---|
| A | 8196 | 8196 | 18 | 18 | 0.22% | 0.22% | 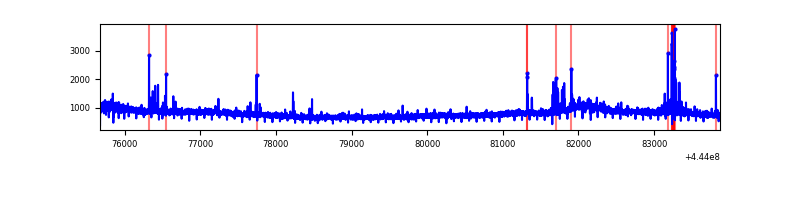 |
| B | 8196 | 8196 | 32 | 32 | 0.39% | 0.39% | 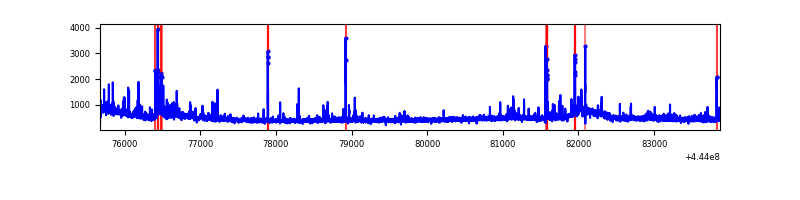 |
| C | 8196 | 8196 | 47 | 47 | 0.57% | 0.57% | 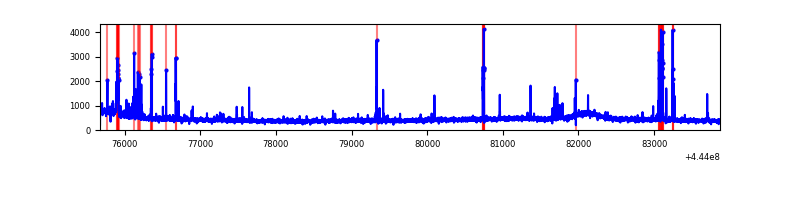 |
| D | 8196 | 8196 | 4096 | 4096 | 49.98% | 49.98% | 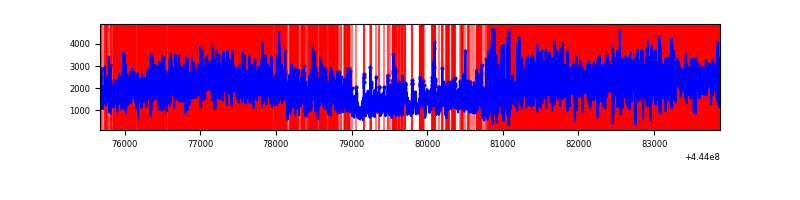 |
Top three noisy pixels from each quadrant. If the there are fewer than three noisy pixels in the level2.evt file, extra rows are filled as -1
| Pixel properties | Quadrant properties | ||||||
|---|---|---|---|---|---|---|---|
| Quadrant | DetID | PixID | Counts | Sigma | Mean | Median | Sigma |
| A | 10 | 83 | 2835138 | 14130.59 | 956 | 936 | 200.6 |
| A | 13 | 248 | 120418 | 595.71 | 956 | 936 | 200.6 |
| A | 0 | 243 | 40963 | 199.56 | 956 | 936 | 200.6 |
| B | 5 | 255 | 167387 | 877.02 | 953 | 922 | 189.8 |
| B | 0 | 155 | 106146 | 554.37 | 953 | 922 | 189.8 |
| B | 0 | 168 | 77839 | 405.24 | 953 | 922 | 189.8 |
| C | 14 | 254 | 186120 | 842.32 | 939 | 944 | 219.8 |
| C | 1 | 3 | 98796 | 445.11 | 939 | 944 | 219.8 |
| C | 12 | 250 | 55649 | 248.84 | 939 | 944 | 219.8 |
| D | 13 | 174 | 5616781 | 30827.45 | 710 | 686 | 182.2 |
| D | 11 | 241 | 3133747 | 17197.77 | 710 | 686 | 182.2 |
| D | 12 | 33 | 1159410 | 6360.38 | 710 | 686 | 182.2 |
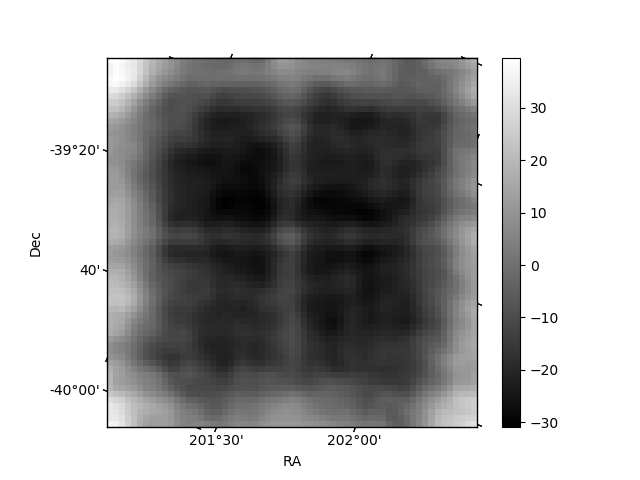
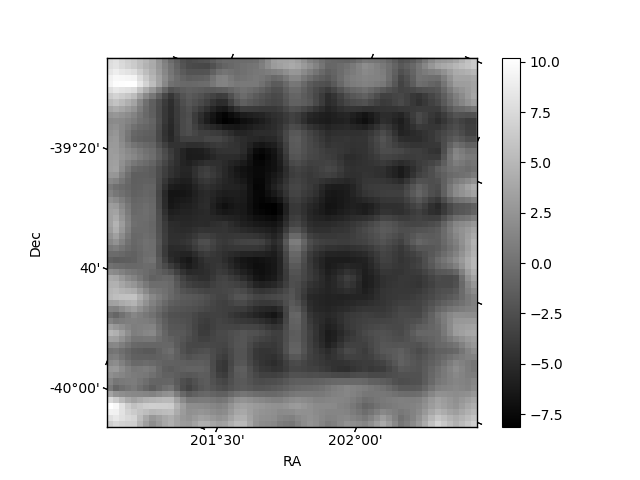
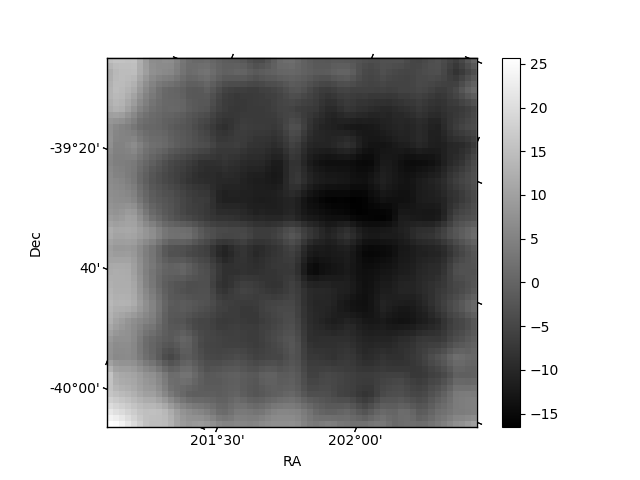
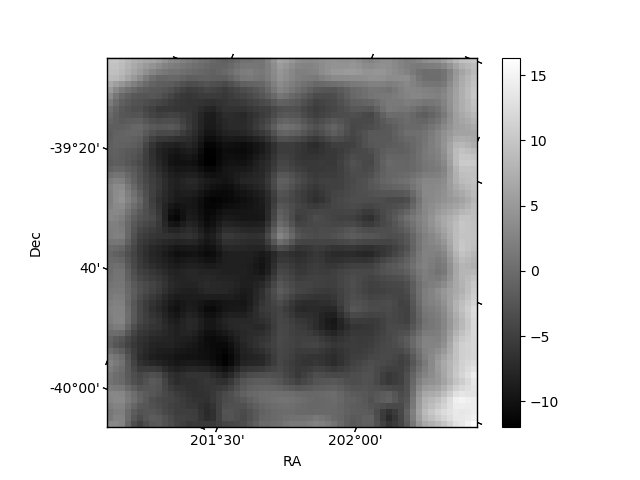
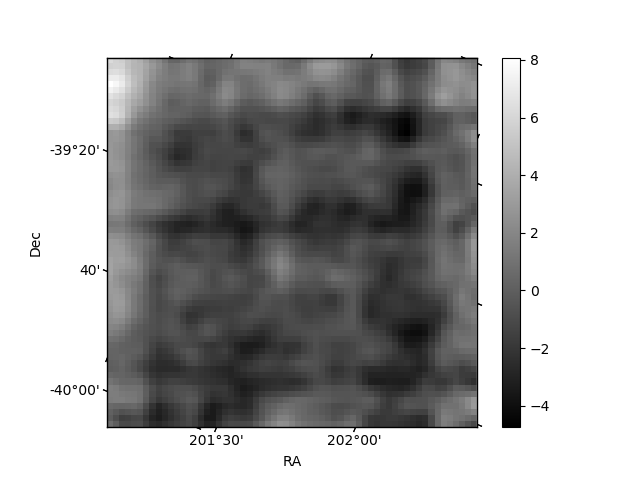
Histogram calculated using DETX and DETY for each event in the final _common_clean file
| Quadrant A | 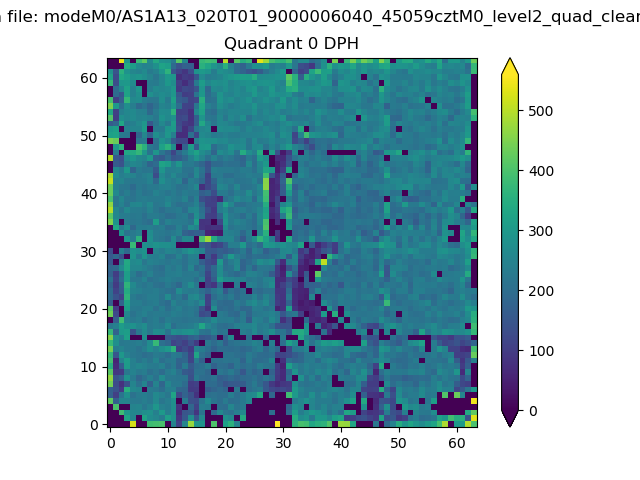 |
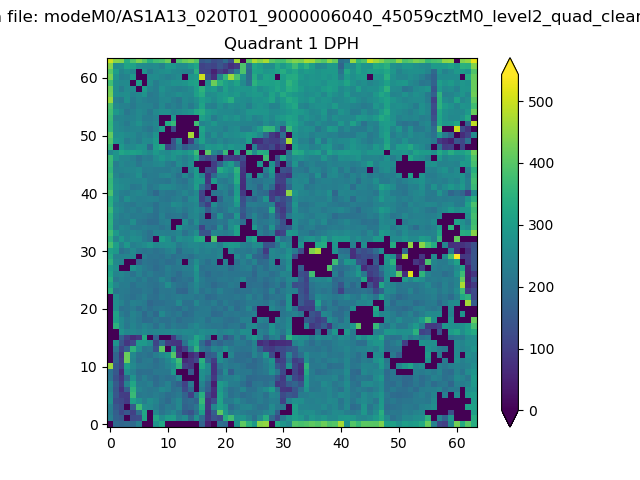 |
Quadrant B |
|---|---|---|---|
| Quadrant D | 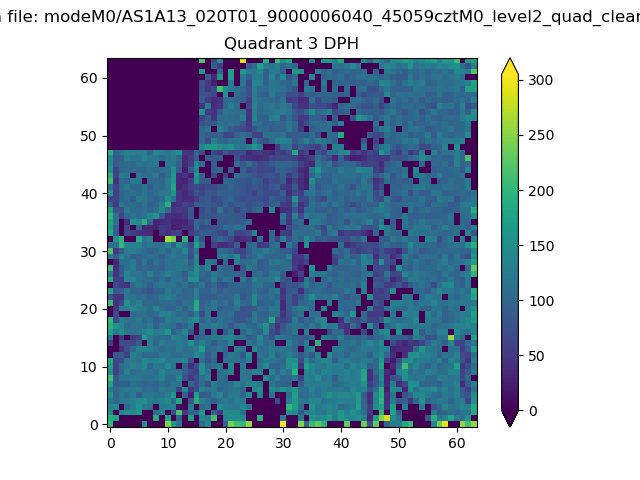 |
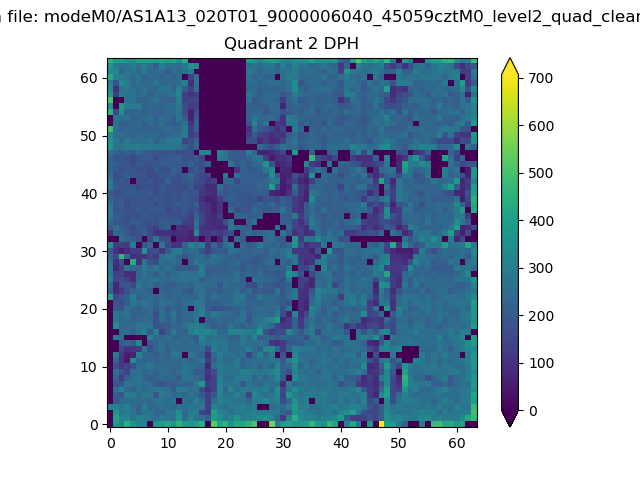 |
Quadrant C |
| Plot type | Count rate plots | Images |
|---|---|---|
| Comparison with Poisson distribution Blue bars denote a histogram of data divided into 1 sec bins. Red curve is a Poisson curve with rate = median count rate of data. |
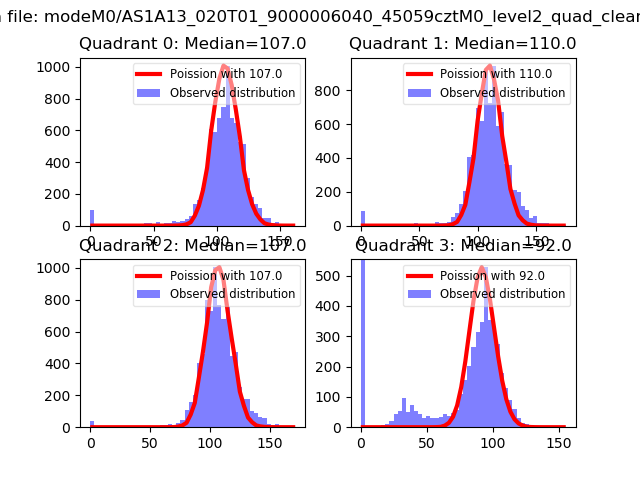 |
 |
| Quadrant-wise count rates Data is divided into 100 sec bins |
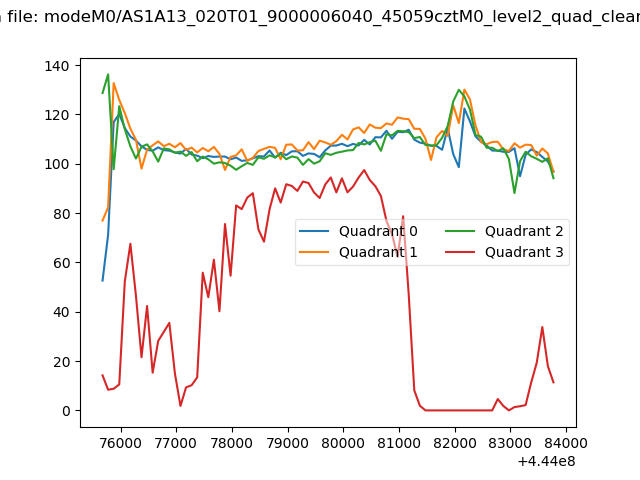 |
|
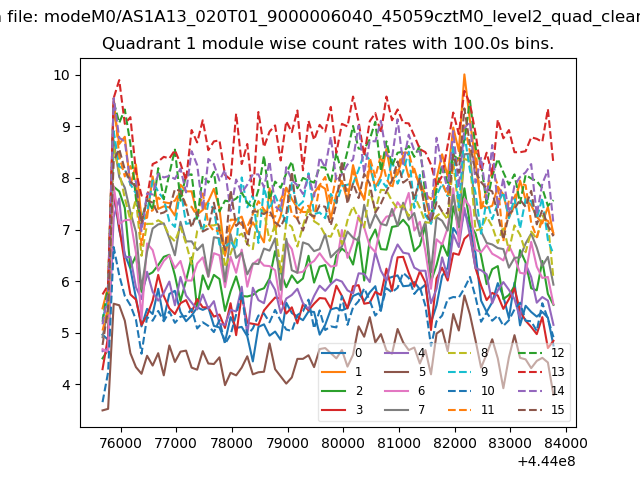
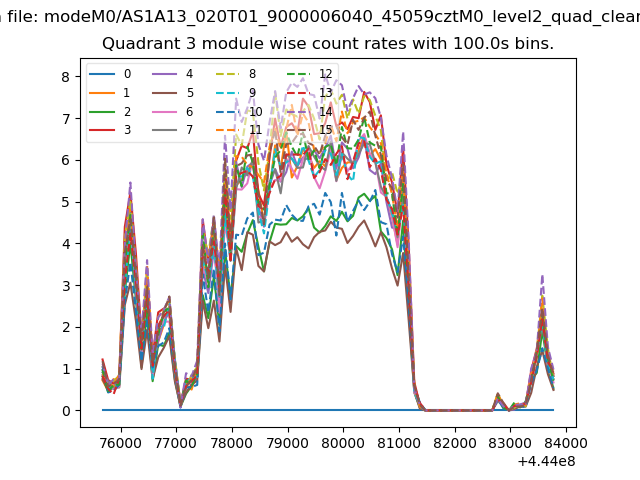
| Module-wise count rates for Quadrant A Data is divided into 100 sec bins |
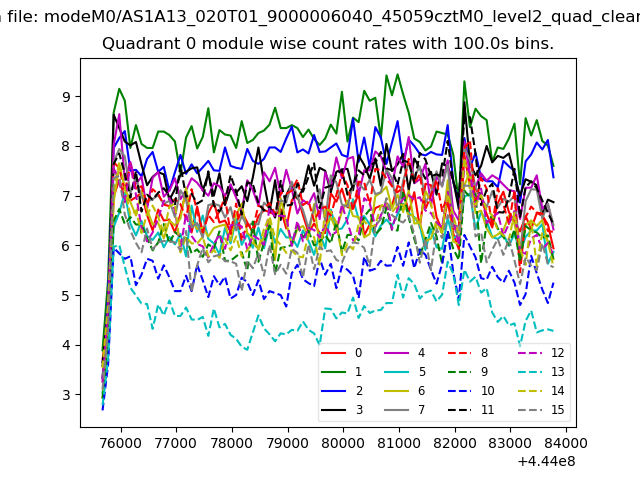 |
 |
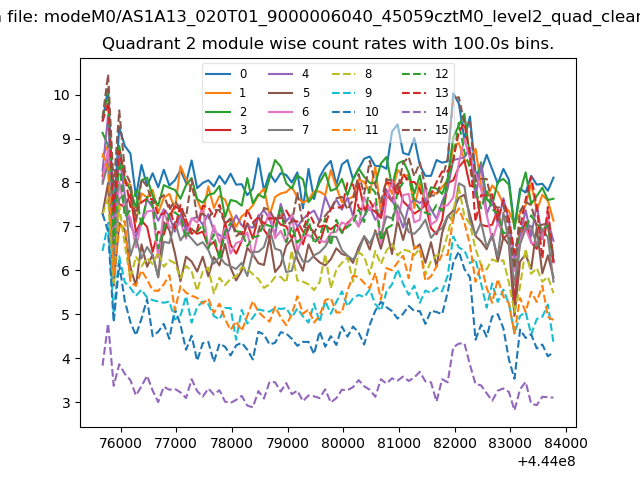
| Module-wise count rates for Quadrant B Data is divided into 100 sec bins |
 |
 |
| Module-wise count rates for Quadrant C Data is divided into 100 sec bins |
 |
 |
| Module-wise count rates for Quadrant D Data is divided into 100 sec bins |
 |
 |
| Parameter | Plot |
|---|---|
| CZT HV Monitor | 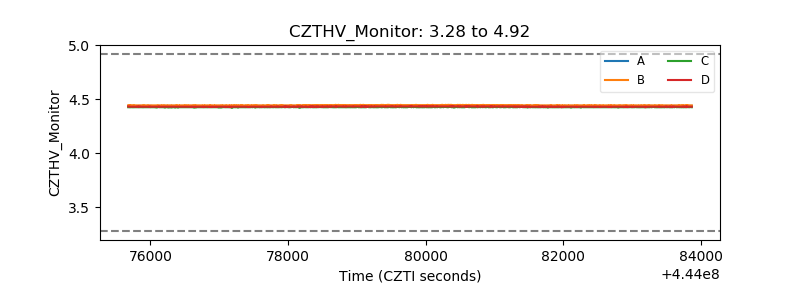 |
| D_VDD | 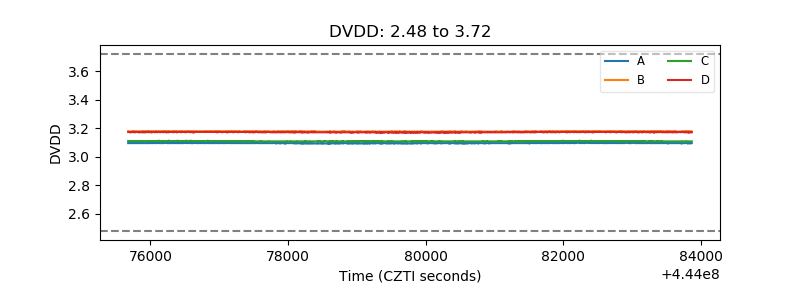 |
| Temperature 1 | 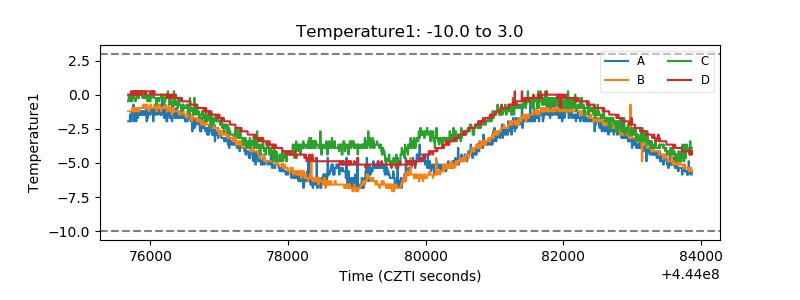 |
| Veto HV Monitor | 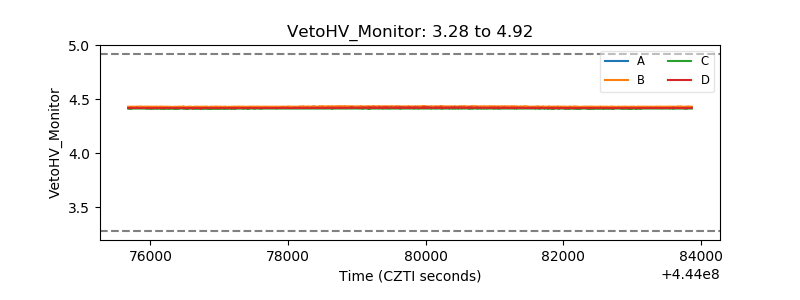 |
| Veto LLD | 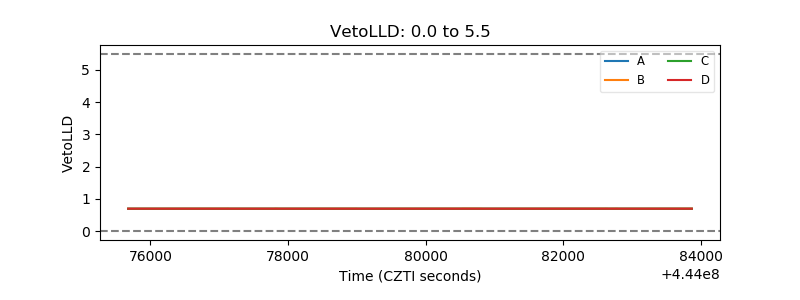 |
| Alpha Counter | 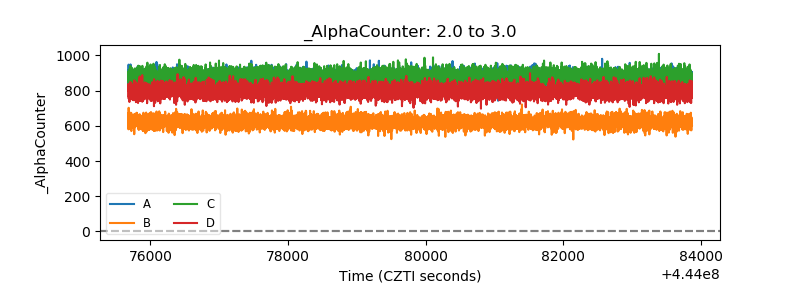 |
| _CPM_Rate | 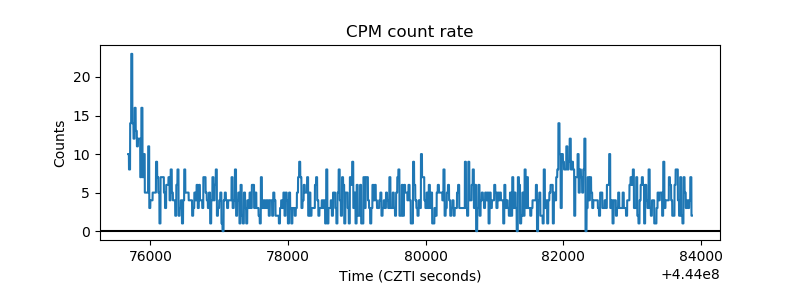 |
| CZT Counter | 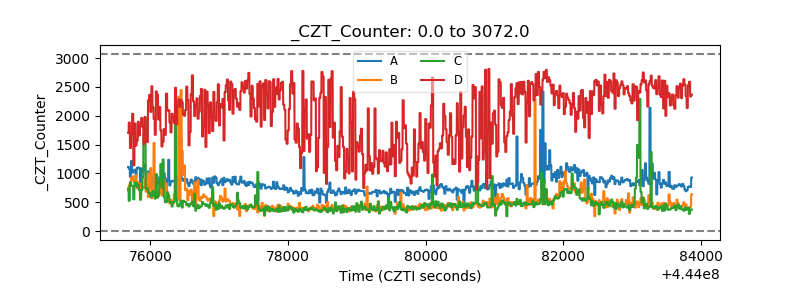 |
| +2.5 Volts monitor | 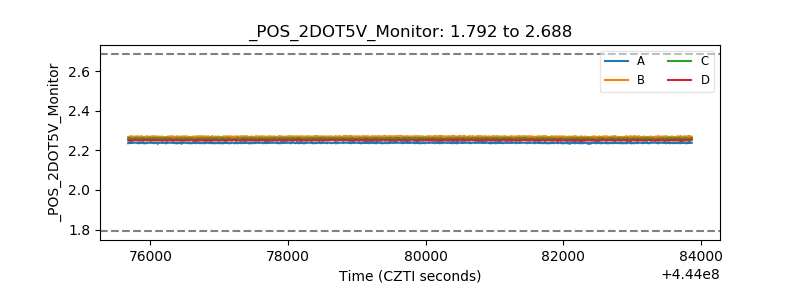 |
| +5 Volts monitor | 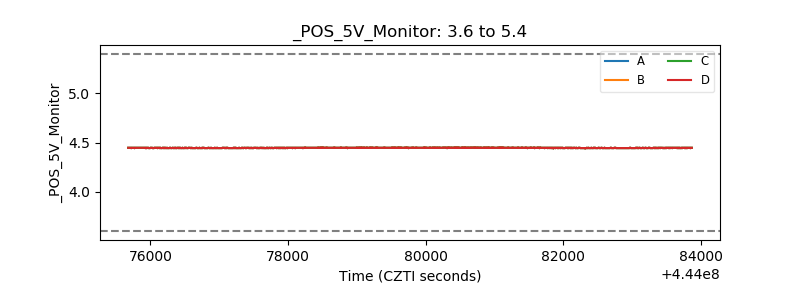 |
| _ROLL_ROT | 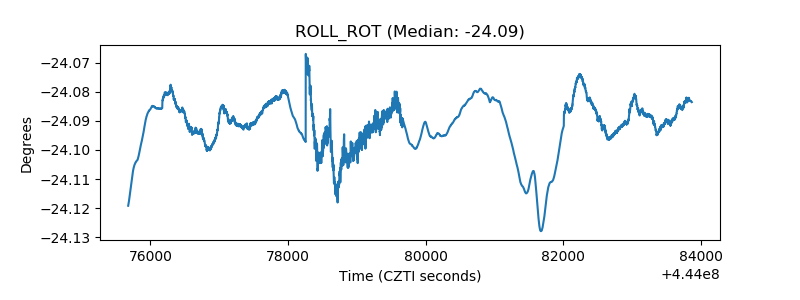 |
| _Roll_DEC | 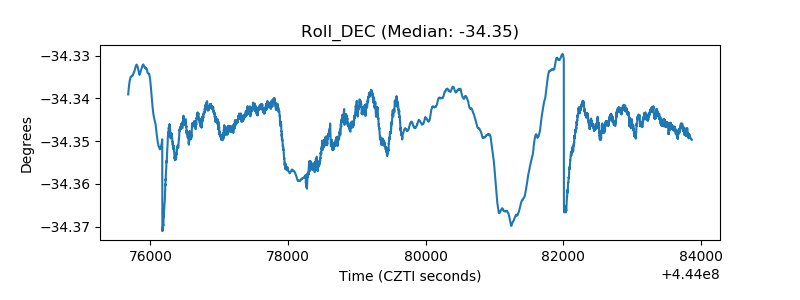 |
| _Roll_RA | 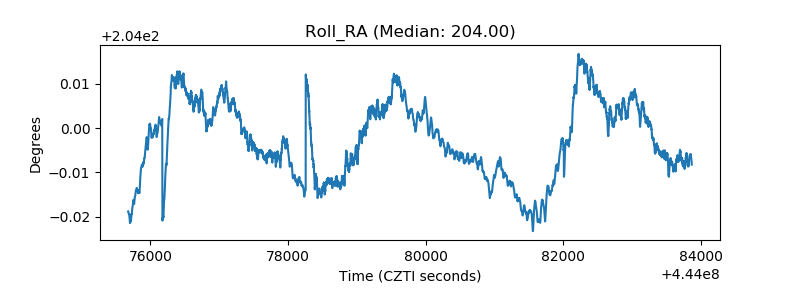 |
| Veto Counter | 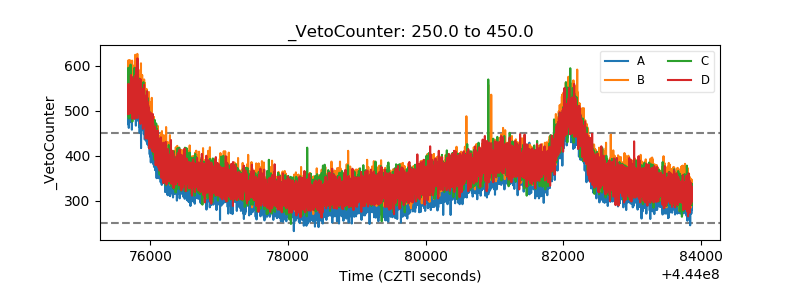 |