| Param | Original file | Final file |
|---|---|---|
| Filename | modeM0/AS1A13_020T01_9000006040_45063cztM0_level2.fits | modeM0/AS1A13_020T01_9000006040_45063cztM0_level2_quad_clean.evt |
| Size (bytes) | 1,729,586,880 | 256,340,160 |
| Size | 1.6 GB | 244.5 MB |
| Events in quadrant A | 14,011,462 | 1,847,859 |
| Events in quadrant B | 8,451,437 | 1,883,714 |
| Events in quadrant C | 8,393,893 | 1,800,856 |
| Events in quadrant D | 31,785,863 | 994,413 |
| Mode SS | |||
|---|---|---|---|
| Quadrant | BADHDUFLAG | Total packets | Discarded packets |
| A | 0 | 370 | 2 |
| B | 0 | 369 | 1 |
| C | 0 | 370 | 0 |
| D | 0 | 368 | 4 |
| Mode M9 | |||
|---|---|---|---|
| Quadrant | BADHDUFLAG | Total packets | Discarded packets |
| A | 0 | 15 | 2 |
| B | 0 | 15 | 2 |
| C | 0 | 15 | 0 |
| D | 0 | 16 | 2 |
| Mode M0 | |||
|---|---|---|---|
| Quadrant | BADHDUFLAG | Total packets | Discarded packets |
| A | 0 | 56539 | 888 |
| B | 0 | 37957 | 511 |
| C | 0 | 38680 | 584 |
| D | 0 | 108473 | 1728 |
| Quadrant | Total seconds | Saturated seconds | Saturation percentage |
|---|---|---|---|
| A | 17889 | 345 | 1.928559% |
| B | 17932 | 187 | 1.042828% |
| C | 17936 | 255 | 1.421722% |
| D | 17791 | 7734 | 43.471418% |
Noise dominated data is calculated using 1-second bins in cleaned event files. If a bin has >2000 counts, and if more than 50% of those come from <1% of pixels, then it is considered to be noise-dominated and hence unusable.
| Quadrant | # 1 sec bins | Bins with >0 counts | Bins with >2000 counts | High rate bins dominated by noise | Noise dominated (total time) | Noise dominated (detector-on time) | Marked lightcurve |
|---|---|---|---|---|---|---|---|
| A | 19580 | 18012 | 45 | 45 | 0.23% | 0.25% | 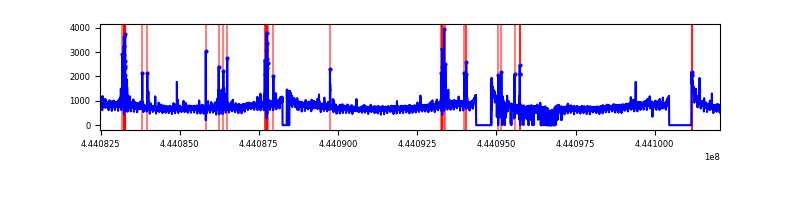 |
| B | 19579 | 18058 | 24 | 24 | 0.12% | 0.13% |  |
| C | 19580 | 18061 | 163 | 163 | 0.83% | 0.90% | 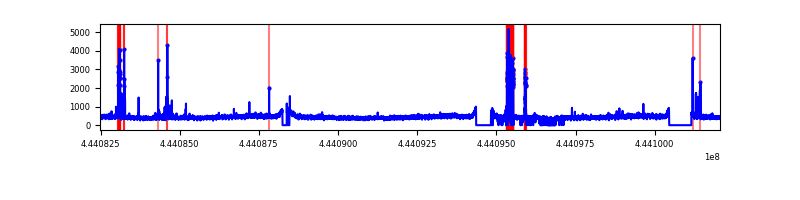 |
| D | 19579 | 17945 | 6894 | 6894 | 35.21% | 38.42% | 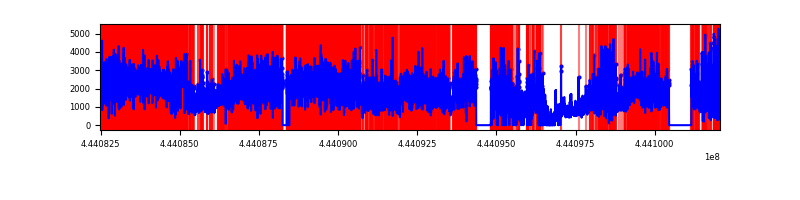 |
Top three noisy pixels from each quadrant. If the there are fewer than three noisy pixels in the level2.evt file, extra rows are filled as -1
| Pixel properties | Quadrant properties | ||||||
|---|---|---|---|---|---|---|---|
| Quadrant | DetID | PixID | Counts | Sigma | Mean | Median | Sigma |
| A | 10 | 83 | 6000537 | 14461.51 | 1997 | 1954 | 414.8 |
| A | 13 | 248 | 118453 | 280.86 | 1997 | 1954 | 414.8 |
| A | 7 | 3 | 53923 | 125.29 | 1997 | 1954 | 414.8 |
| B | 5 | 255 | 153536 | 384.56 | 2005 | 1940 | 394.2 |
| B | 0 | 155 | 121047 | 302.14 | 2005 | 1940 | 394.2 |
| B | 5 | 32 | 96625 | 240.19 | 2005 | 1940 | 394.2 |
| C | 14 | 254 | 528055 | 1141.02 | 1970 | 1979 | 461.1 |
| C | 1 | 3 | 81742 | 173.0 | 1970 | 1979 | 461.1 |
| C | 2 | 14 | 56498 | 118.25 | 1970 | 1979 | 461.1 |
| D | 13 | 174 | 12249754 | 28819.44 | 1653 | 1596 | 425.0 |
| D | 11 | 241 | 5073784 | 11934.66 | 1653 | 1596 | 425.0 |
| D | 1 | 52 | 1856530 | 4364.59 | 1653 | 1596 | 425.0 |
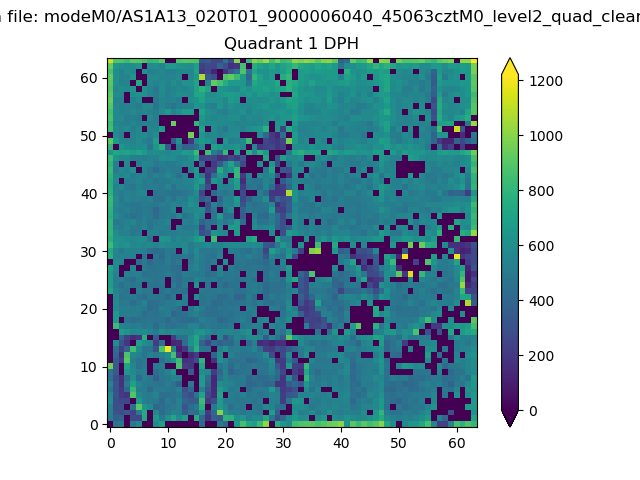
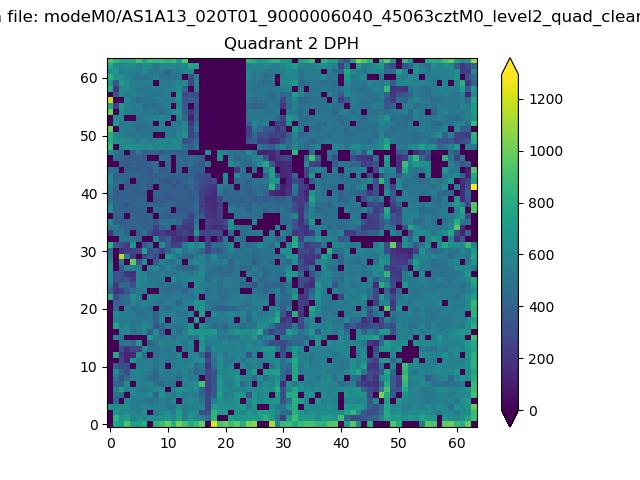
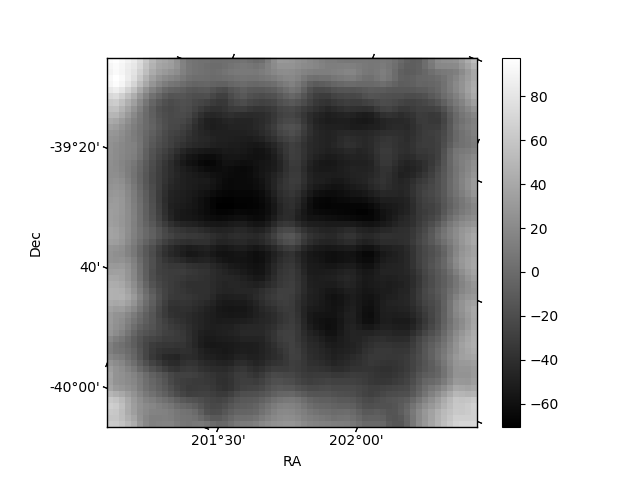
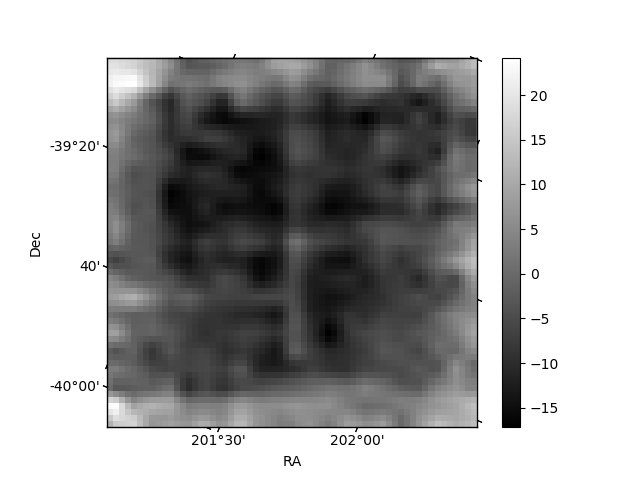
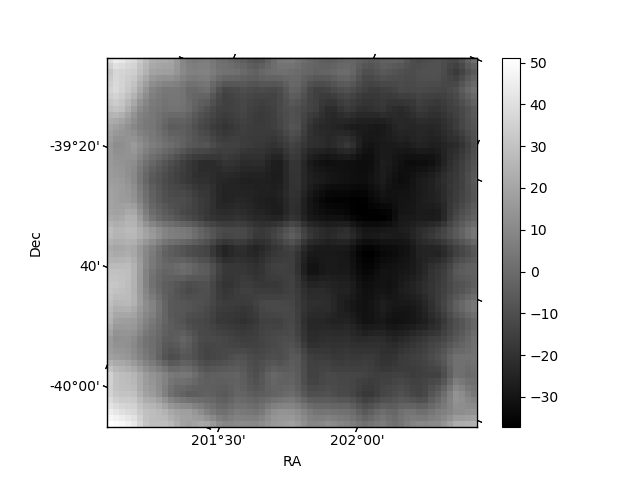
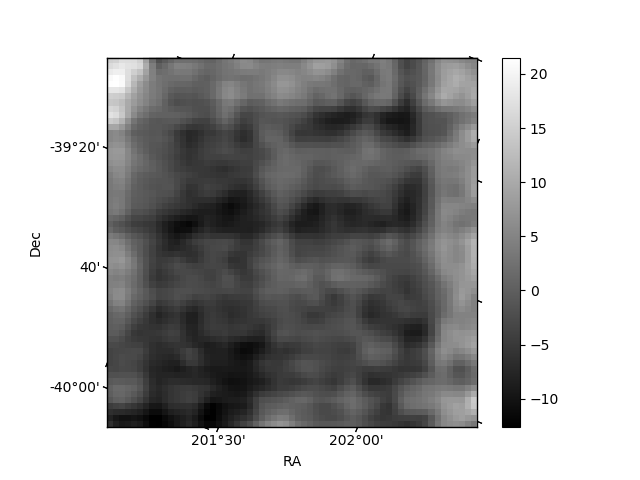
Histogram calculated using DETX and DETY for each event in the final _common_clean file
| Quadrant A | 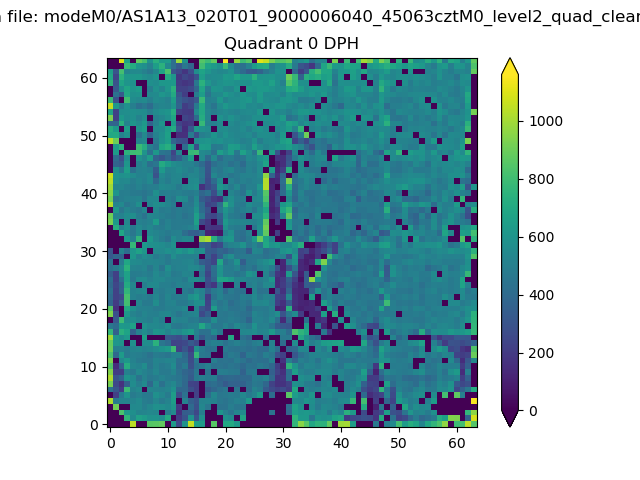 |
 |
Quadrant B |
|---|---|---|---|
| Quadrant D | 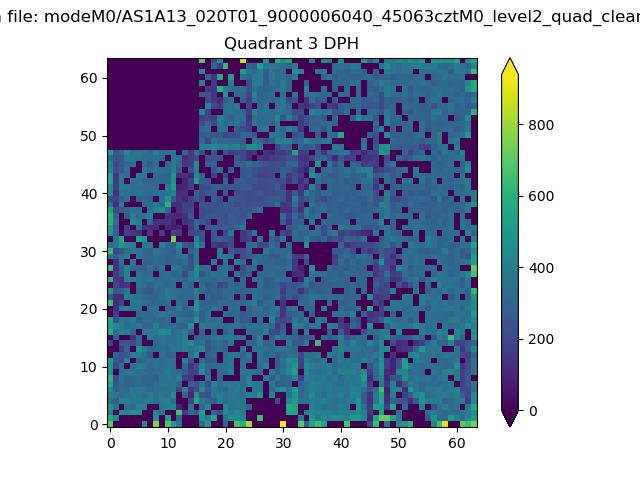 |
 |
Quadrant C |
| Plot type | Count rate plots | Images |
|---|---|---|
| Comparison with Poisson distribution Blue bars denote a histogram of data divided into 1 sec bins. Red curve is a Poisson curve with rate = median count rate of data. |
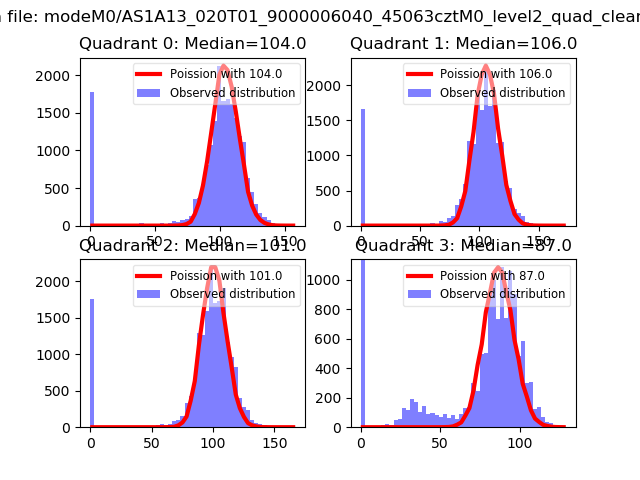 |
 |
| Quadrant-wise count rates Data is divided into 100 sec bins |
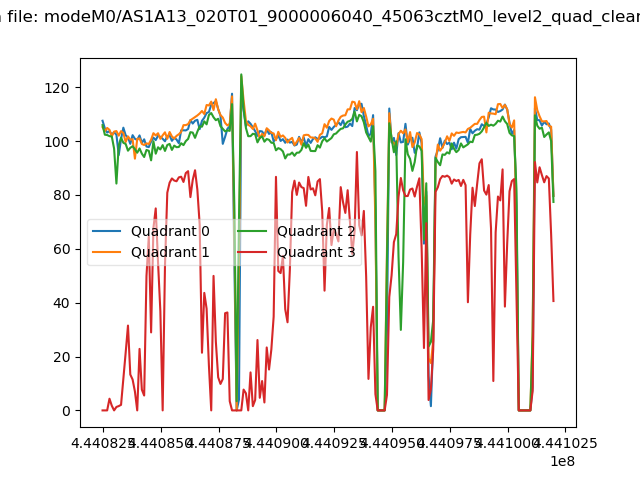 |
|
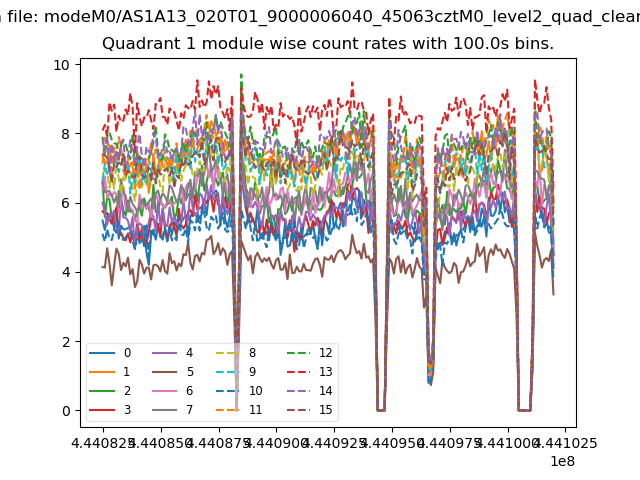
| Module-wise count rates for Quadrant A Data is divided into 100 sec bins |
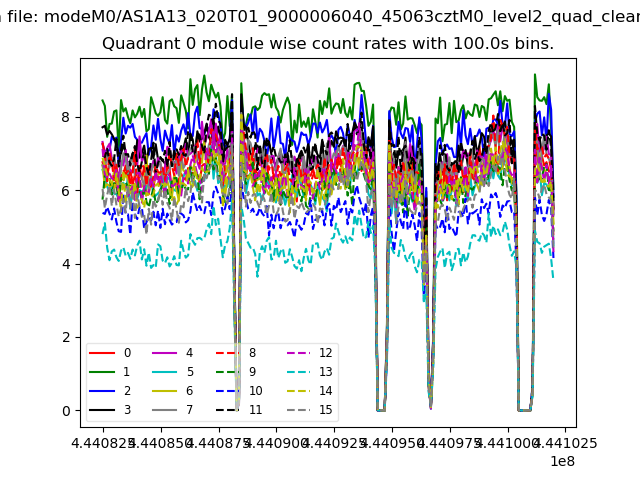 |
 |
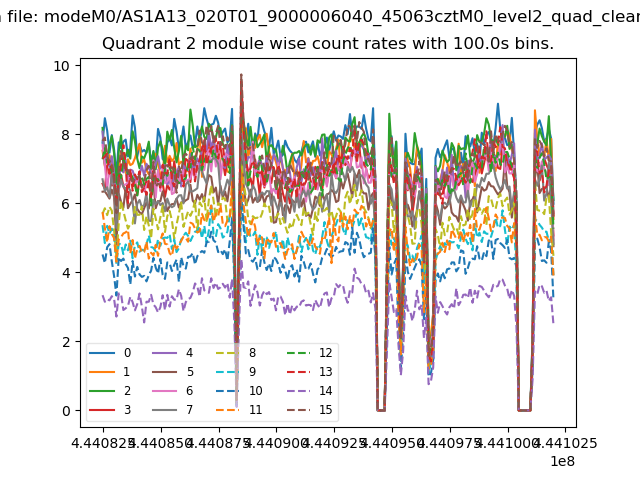
| Module-wise count rates for Quadrant B Data is divided into 100 sec bins |
 |
 |
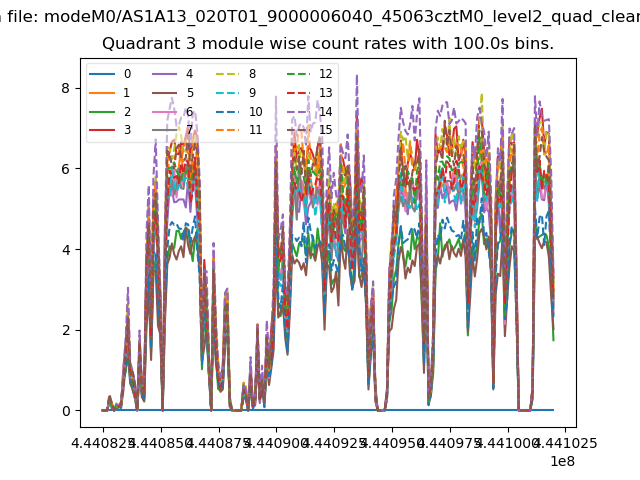
| Module-wise count rates for Quadrant C Data is divided into 100 sec bins |
 |
 |
| Module-wise count rates for Quadrant D Data is divided into 100 sec bins |
 |
 |
| Parameter | Plot |
|---|---|
| CZT HV Monitor | 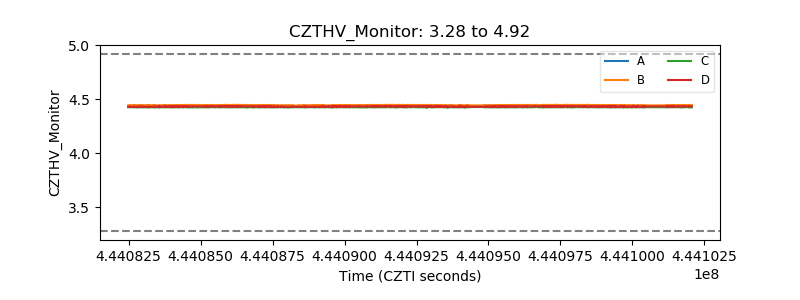 |
| D_VDD | 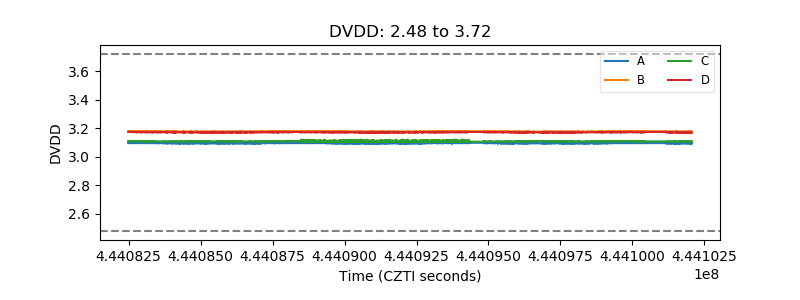 |
| Temperature 1 | 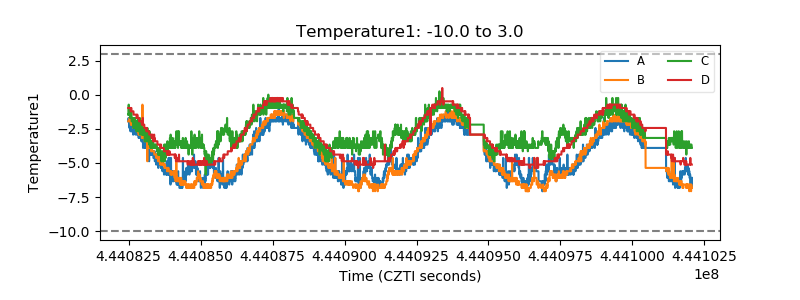 |
| Veto HV Monitor | 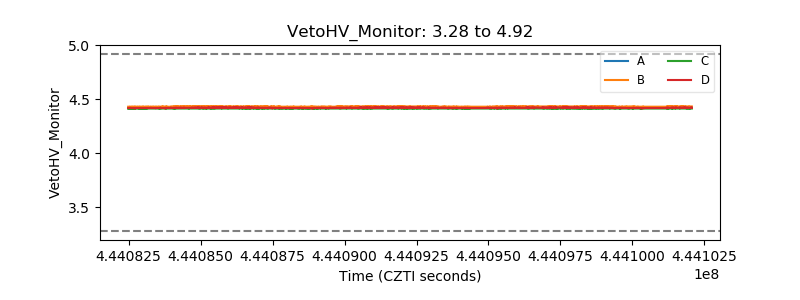 |
| Veto LLD | 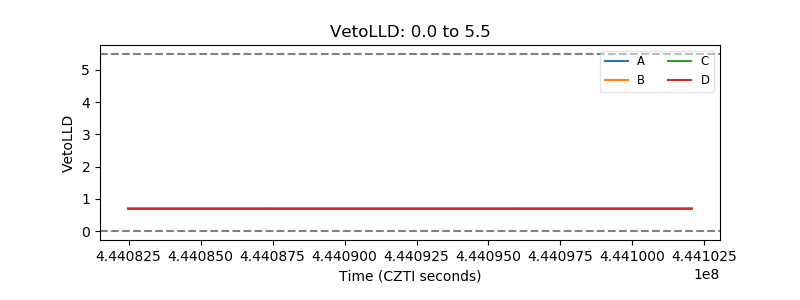 |
| Alpha Counter | 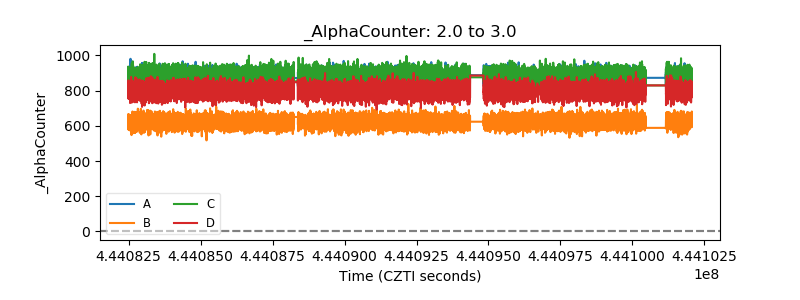 |
| _CPM_Rate | 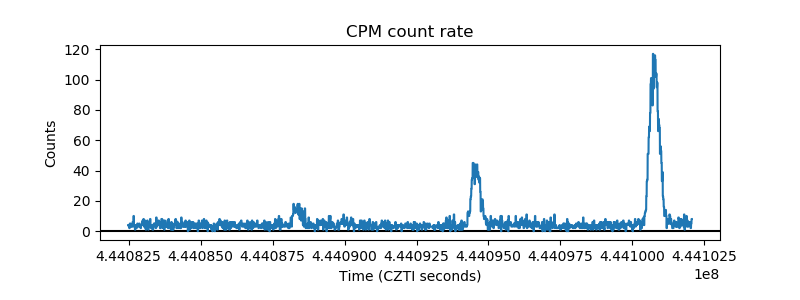 |
| CZT Counter | 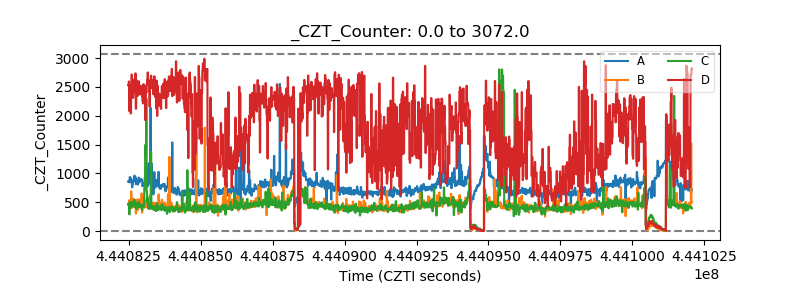 |
| +2.5 Volts monitor | 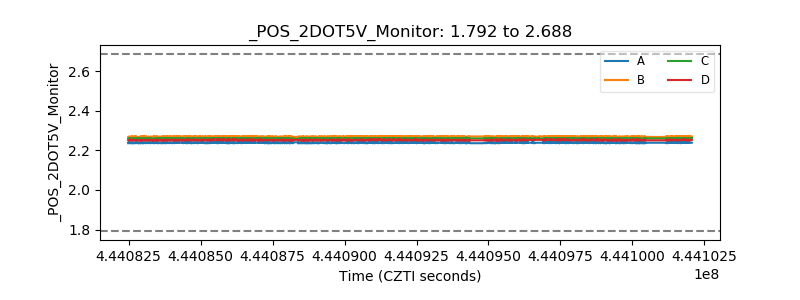 |
| +5 Volts monitor | 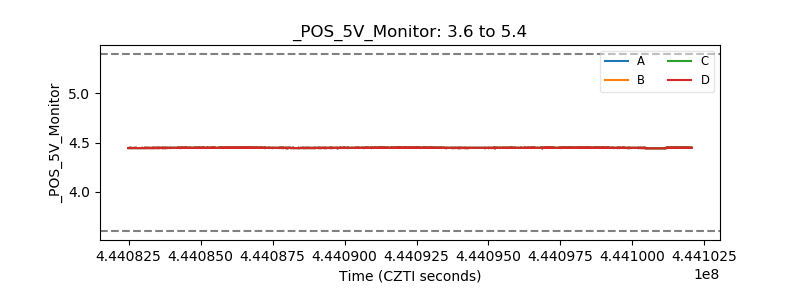 |
| _ROLL_ROT | 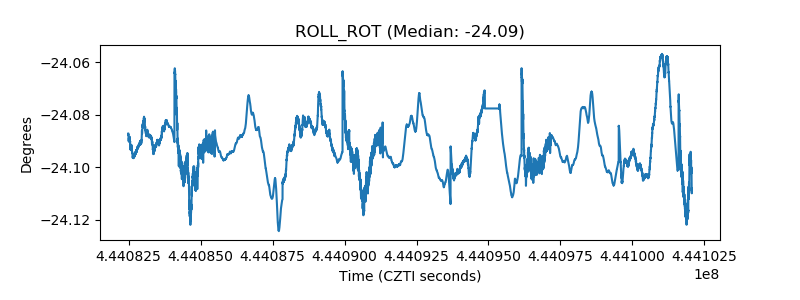 |
| _Roll_DEC |  |
| _Roll_RA | 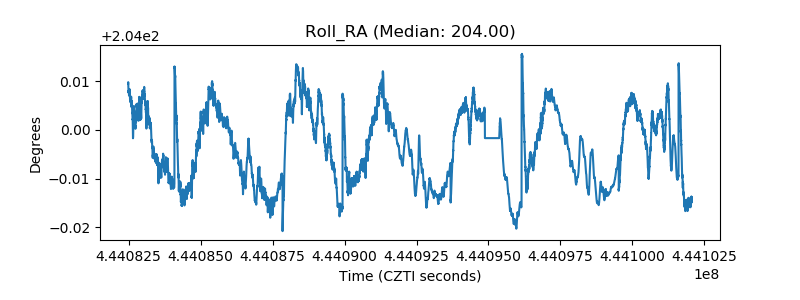 |
| Veto Counter | 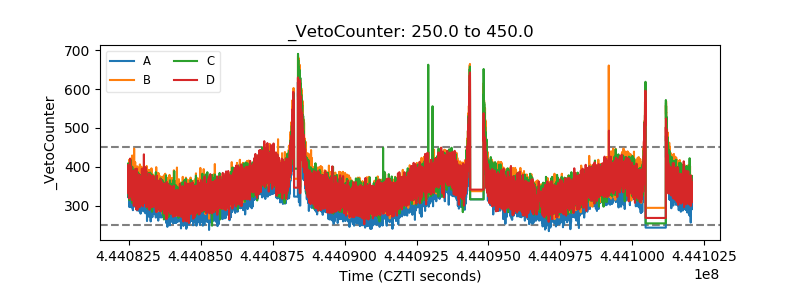 |