| Param | Original file | Final file |
|---|---|---|
| Filename | modeM0/AS1A13_020T01_9000006040_45064cztM0_level2.fits | modeM0/AS1A13_020T01_9000006040_45064cztM0_level2_quad_clean.evt |
| Size (bytes) | 1,045,445,760 | 192,265,920 |
| Size | 997.0 MB | 183.4 MB |
| Events in quadrant A | 9,685,475 | 1,313,772 |
| Events in quadrant B | 6,472,823 | 1,346,668 |
| Events in quadrant C | 5,945,475 | 1,296,646 |
| Events in quadrant D | 15,642,129 | 1,010,716 |
| Mode SS | |||
|---|---|---|---|
| Quadrant | BADHDUFLAG | Total packets | Discarded packets |
| A | 0 | 250 | 0 |
| B | 0 | 250 | 0 |
| C | 0 | 250 | 0 |
| D | 0 | 250 | 0 |
| Mode M9 | |||
|---|---|---|---|
| Quadrant | BADHDUFLAG | Total packets | Discarded packets |
| A | 0 | 19 | 0 |
| B | 0 | 19 | 0 |
| C | 0 | 20 | 0 |
| D | 0 | 20 | 0 |
| Mode M0 | |||
|---|---|---|---|
| Quadrant | BADHDUFLAG | Total packets | Discarded packets |
| A | 0 | 38538 | 3 |
| B | 0 | 27691 | 3 |
| C | 0 | 26563 | 3 |
| D | 0 | 55147 | 3 |
| Quadrant | Total seconds | Saturated seconds | Saturation percentage |
|---|---|---|---|
| A | 12341 | 202 | 1.636820% |
| B | 12341 | 244 | 1.977149% |
| C | 12341 | 198 | 1.604408% |
| D | 12341 | 2100 | 17.016449% |
Noise dominated data is calculated using 1-second bins in cleaned event files. If a bin has >2000 counts, and if more than 50% of those come from <1% of pixels, then it is considered to be noise-dominated and hence unusable.
| Quadrant | # 1 sec bins | Bins with >0 counts | Bins with >2000 counts | High rate bins dominated by noise | Noise dominated (total time) | Noise dominated (detector-on time) | Marked lightcurve |
|---|---|---|---|---|---|---|---|
| A | 14167 | 12343 | 19 | 19 | 0.13% | 0.15% | 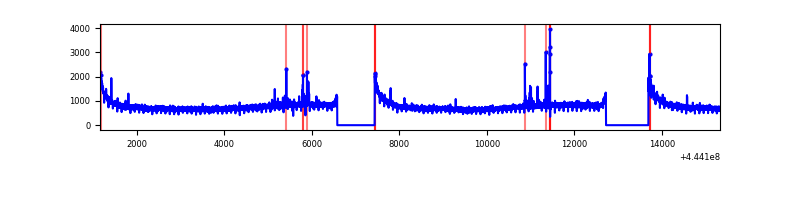 |
| B | 14167 | 12343 | 135 | 135 | 0.95% | 1.09% | 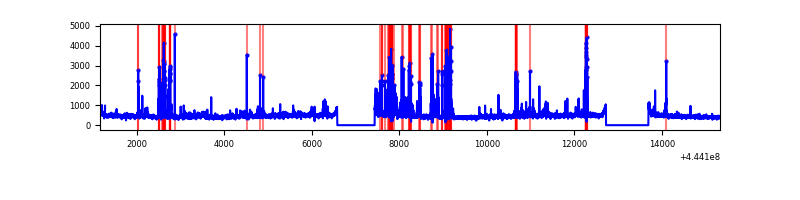 |
| C | 14167 | 12343 | 136 | 136 | 0.96% | 1.10% | 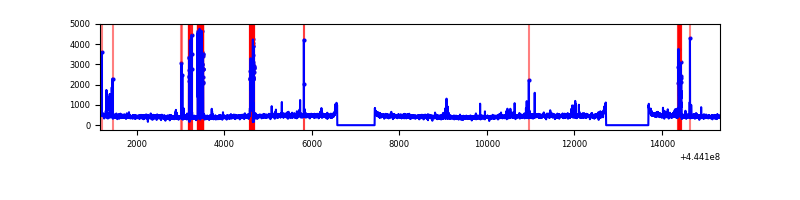 |
| D | 14167 | 12343 | 1705 | 1705 | 12.04% | 13.81% | 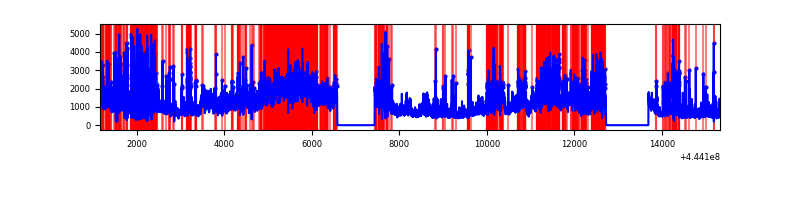 |
Top three noisy pixels from each quadrant. If the there are fewer than three noisy pixels in the level2.evt file, extra rows are filled as -1
| Pixel properties | Quadrant properties | ||||||
|---|---|---|---|---|---|---|---|
| Quadrant | DetID | PixID | Counts | Sigma | Mean | Median | Sigma |
| A | 10 | 83 | 4285648 | 15119.73 | 1371 | 1341 | 283.4 |
| A | 13 | 248 | 59891 | 206.63 | 1371 | 1341 | 283.4 |
| A | 7 | 3 | 22819 | 75.8 | 1371 | 1341 | 283.4 |
| B | 5 | 255 | 496567 | 1828.04 | 1369 | 1323 | 270.9 |
| B | 4 | 171 | 192972 | 707.41 | 1369 | 1323 | 270.9 |
| B | 0 | 186 | 124612 | 455.08 | 1369 | 1323 | 270.9 |
| C | 14 | 254 | 550619 | 1703.78 | 1362 | 1369 | 322.4 |
| C | 1 | 3 | 45817 | 137.88 | 1362 | 1369 | 322.4 |
| C | 3 | 233 | 35095 | 104.62 | 1362 | 1369 | 322.4 |
| D | 13 | 174 | 3466244 | 10743.26 | 1277 | 1239 | 322.5 |
| D | 11 | 241 | 3382299 | 10482.99 | 1277 | 1239 | 322.5 |
| D | 13 | 187 | 988739 | 3061.75 | 1277 | 1239 | 322.5 |
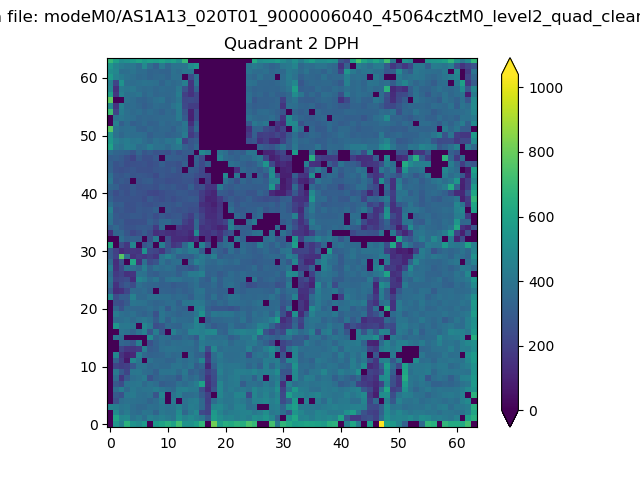
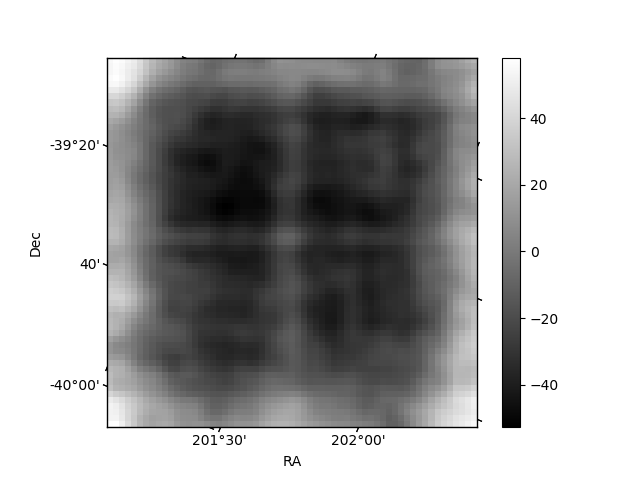
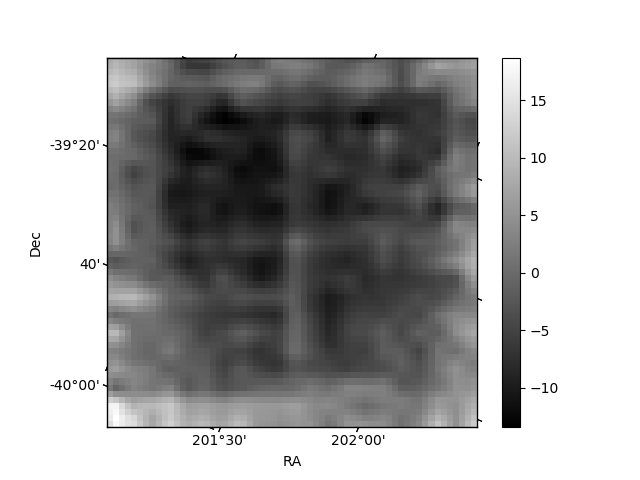
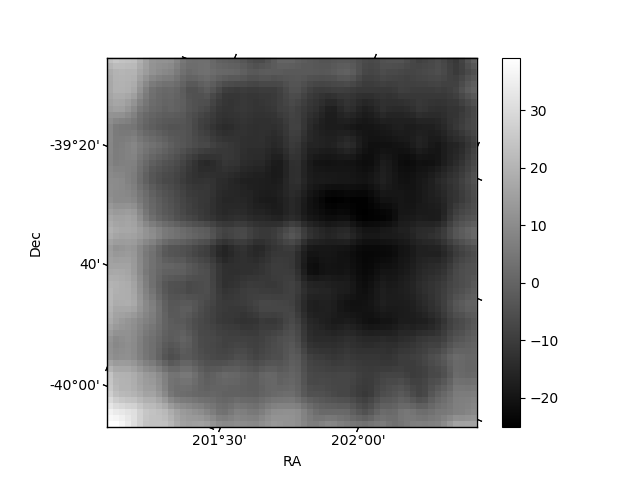
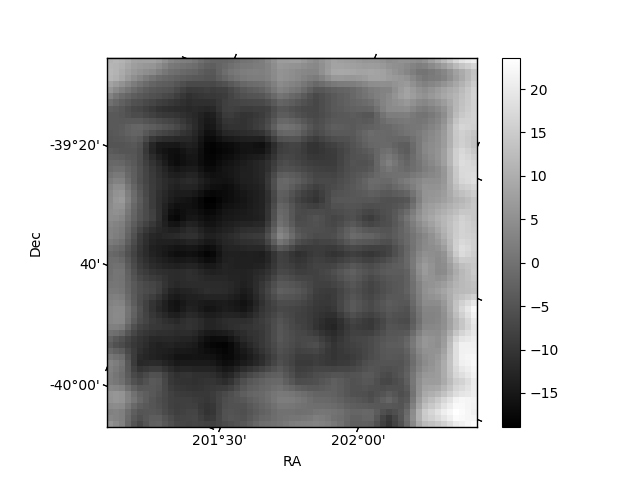
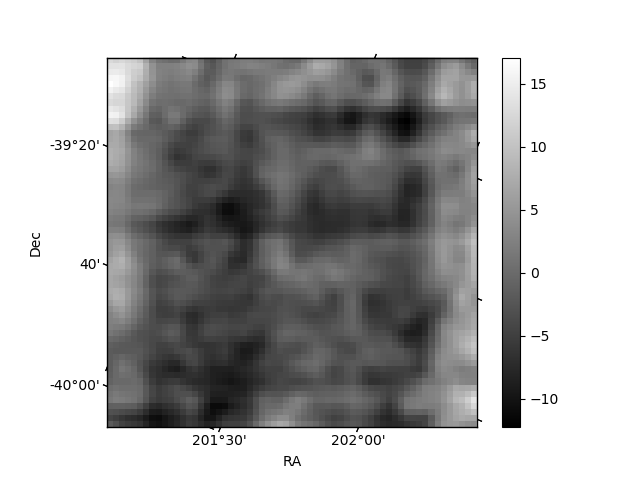
Histogram calculated using DETX and DETY for each event in the final _common_clean file
| Quadrant A | 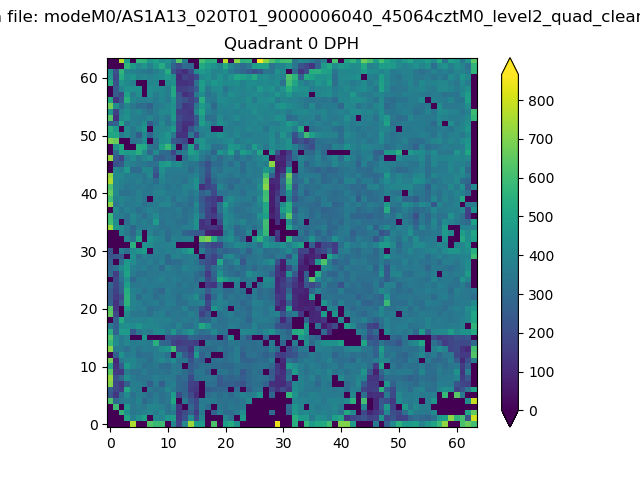 |
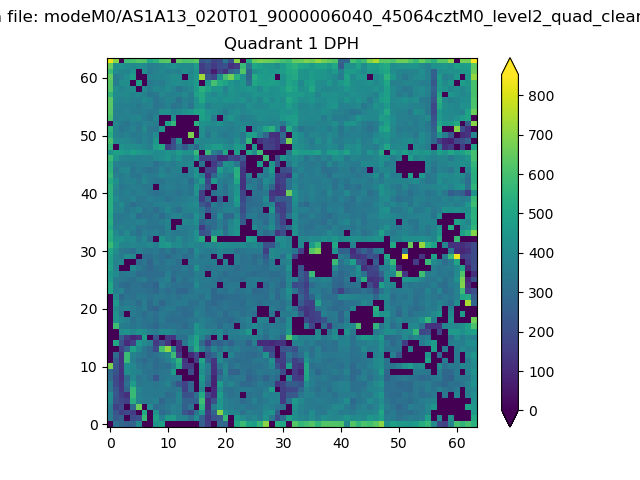 |
Quadrant B |
|---|---|---|---|
| Quadrant D | 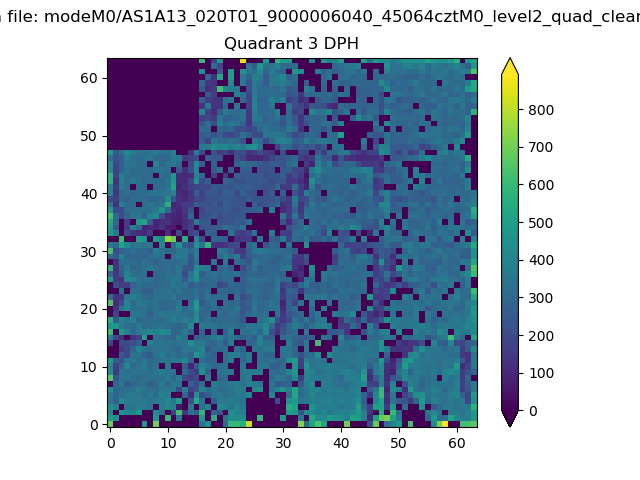 |
 |
Quadrant C |
| Plot type | Count rate plots | Images |
|---|---|---|
| Comparison with Poisson distribution Blue bars denote a histogram of data divided into 1 sec bins. Red curve is a Poisson curve with rate = median count rate of data. |
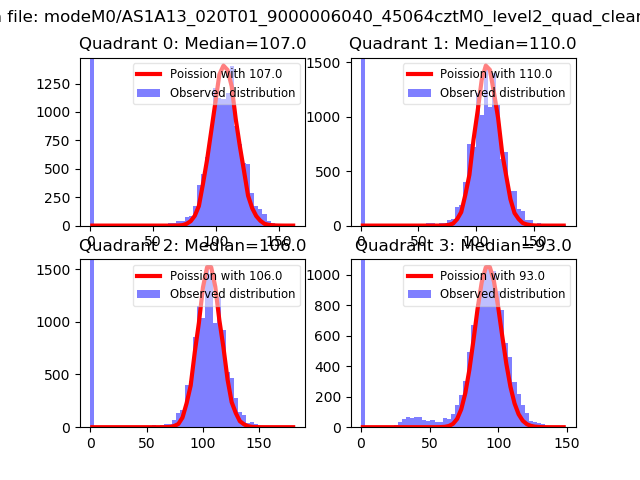 |
 |
| Quadrant-wise count rates Data is divided into 100 sec bins |
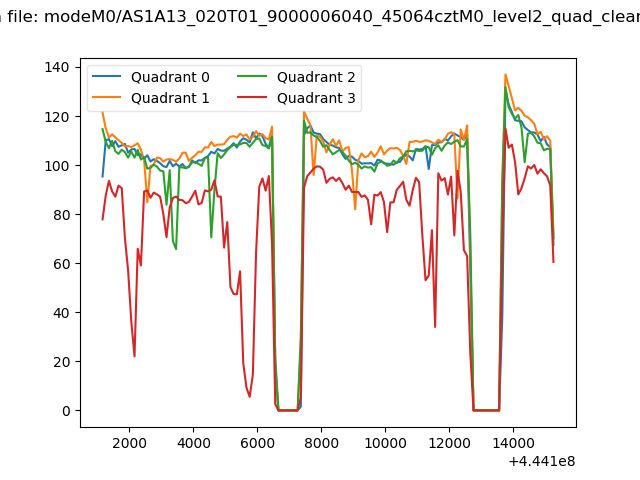 |
|
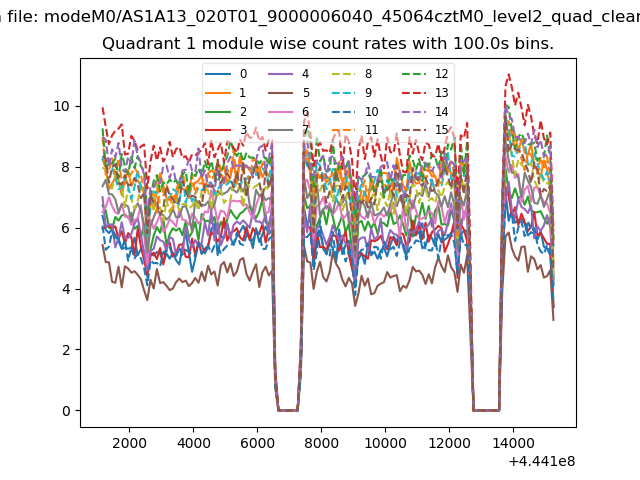
| Module-wise count rates for Quadrant A Data is divided into 100 sec bins |
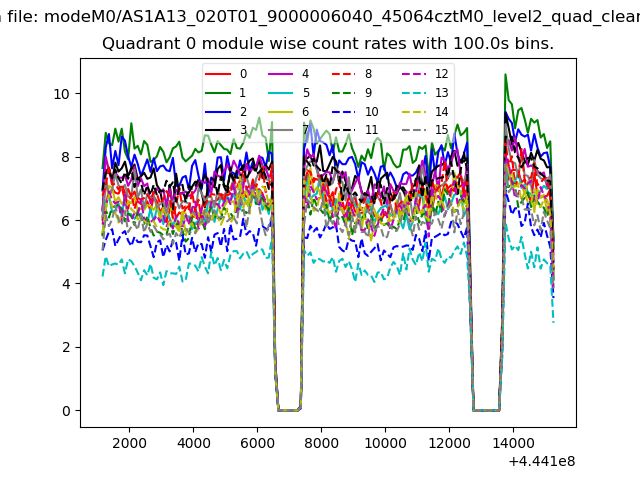 |
 |
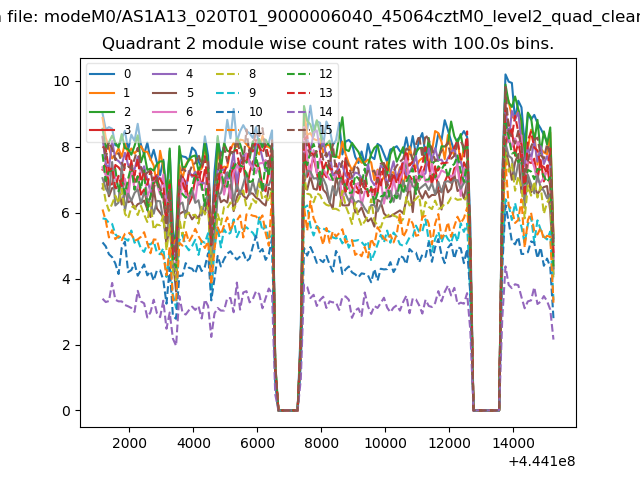
| Module-wise count rates for Quadrant B Data is divided into 100 sec bins |
 |
 |
| Module-wise count rates for Quadrant C Data is divided into 100 sec bins |
 |
 |
| Module-wise count rates for Quadrant D Data is divided into 100 sec bins |
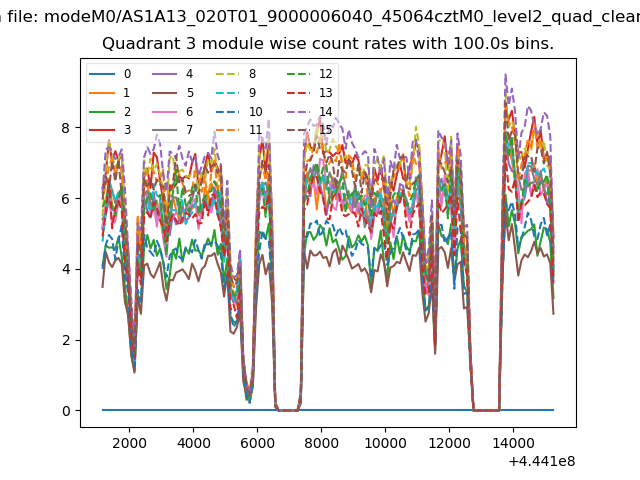 |
 |
| Parameter | Plot |
|---|---|
| CZT HV Monitor | 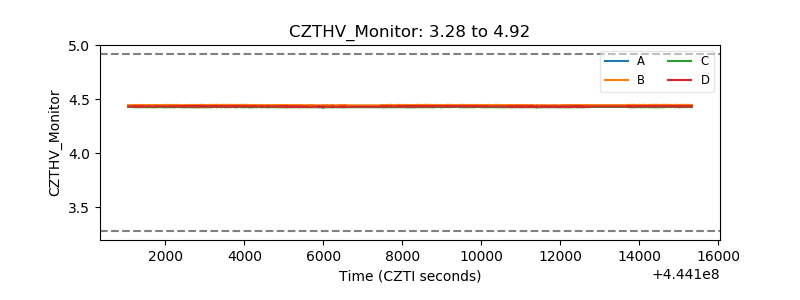 |
| D_VDD | 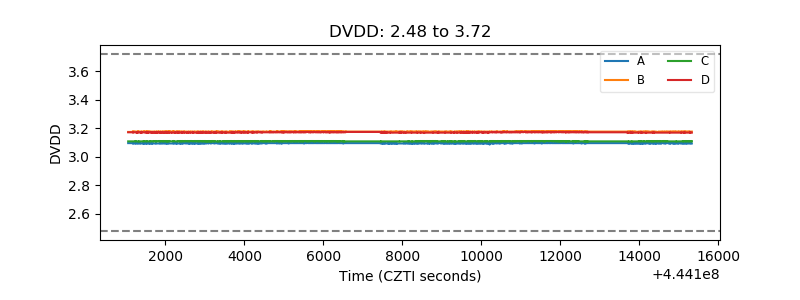 |
| Temperature 1 | 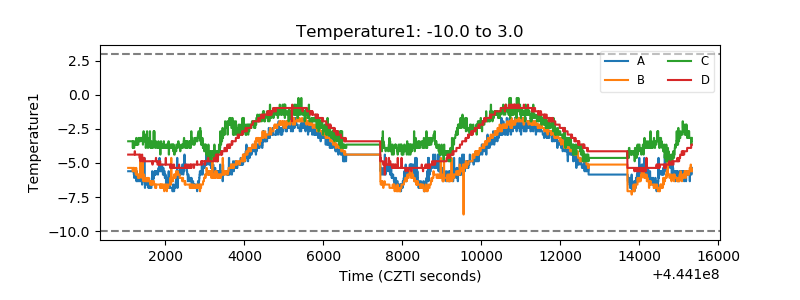 |
| Veto HV Monitor | 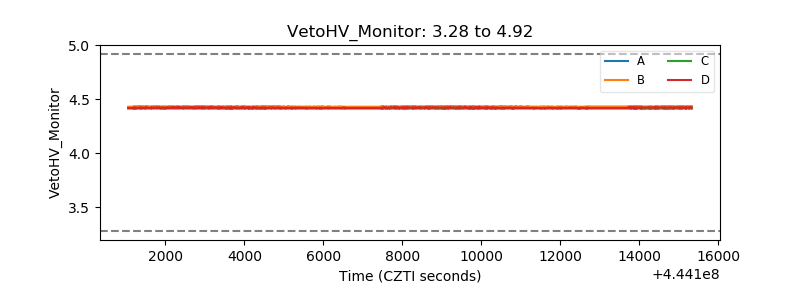 |
| Veto LLD | 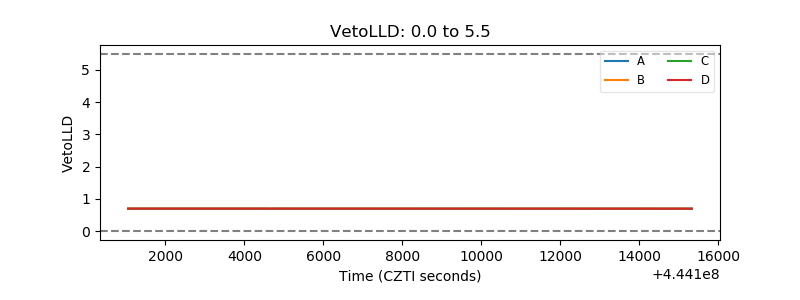 |
| Alpha Counter | 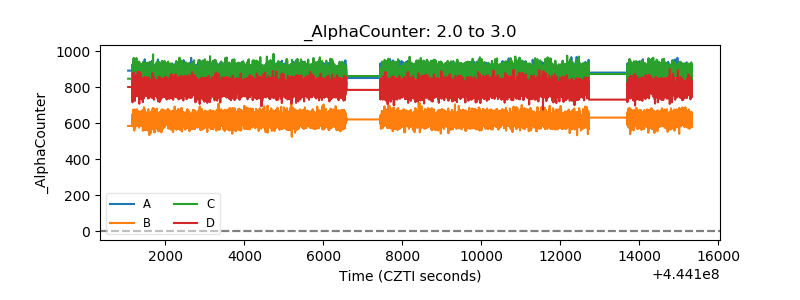 |
| _CPM_Rate | 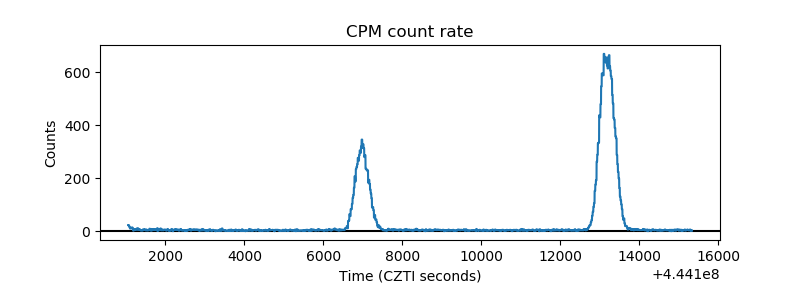 |
| CZT Counter | 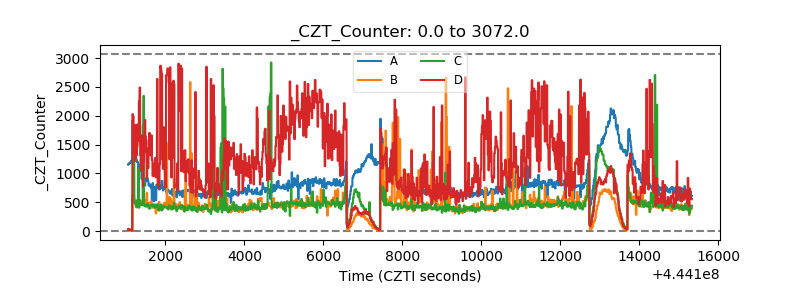 |
| +2.5 Volts monitor | 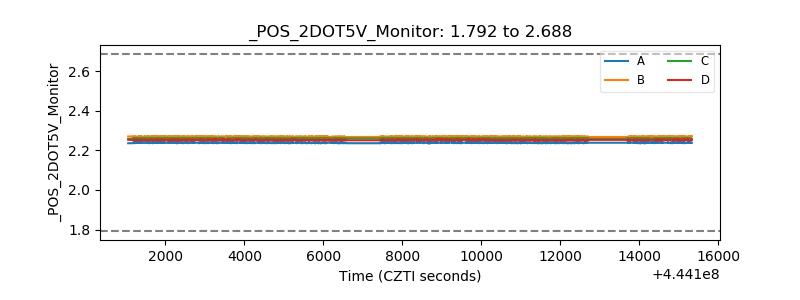 |
| +5 Volts monitor | 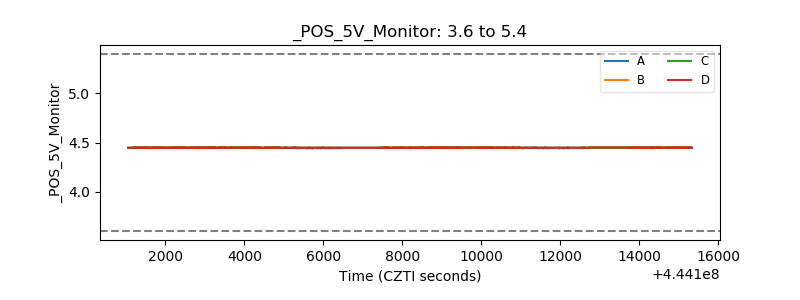 |
| _ROLL_ROT | 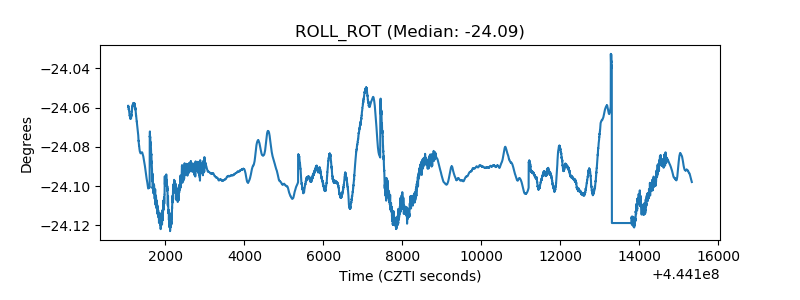 |
| _Roll_DEC |  |
| _Roll_RA | 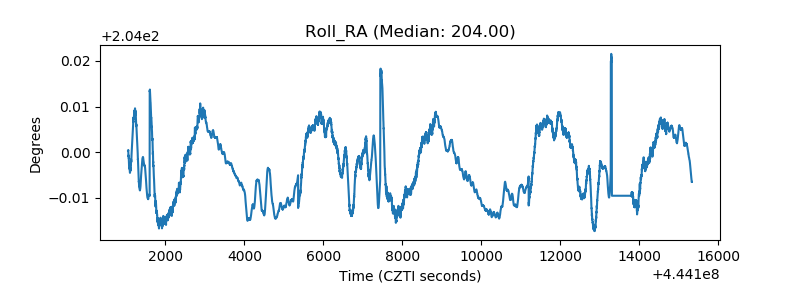 |
| Veto Counter | 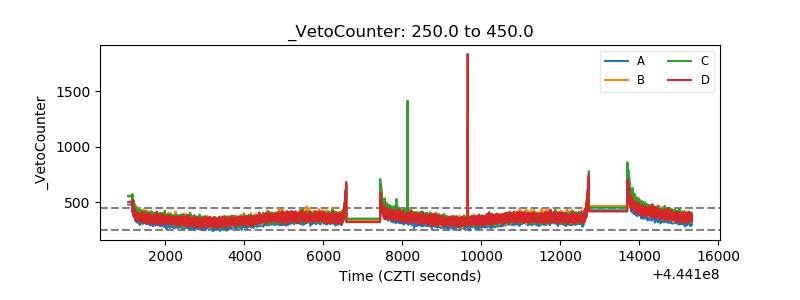 |