| Param | Original file | Final file |
|---|---|---|
| Filename | modeM0/AS1A13_020T01_9000006040_45066cztM0_level2.fits | modeM0/AS1A13_020T01_9000006040_45066cztM0_level2_quad_clean.evt |
| Size (bytes) | 436,138,560 | 98,832,960 |
| Size | 415.9 MB | 94.3 MB |
| Events in quadrant A | 4,656,963 | 659,756 |
| Events in quadrant B | 2,771,959 | 686,010 |
| Events in quadrant C | 2,757,731 | 660,764 |
| Events in quadrant D | 5,499,575 | 573,696 |
| Mode SS | |||
|---|---|---|---|
| Quadrant | BADHDUFLAG | Total packets | Discarded packets |
| A | 0 | 120 | 0 |
| B | 0 | 120 | 0 |
| C | 0 | 120 | 0 |
| D | 0 | 120 | 0 |
| Mode M9 | |||
|---|---|---|---|
| Quadrant | BADHDUFLAG | Total packets | Discarded packets |
| A | 0 | 10 | 0 |
| B | 0 | 10 | 0 |
| C | 0 | 10 | 0 |
| D | 0 | 10 | 0 |
| Mode M0 | |||
|---|---|---|---|
| Quadrant | BADHDUFLAG | Total packets | Discarded packets |
| A | 0 | 18311 | 1 |
| B | 0 | 12264 | 1 |
| C | 0 | 12294 | 1 |
| D | 0 | 20468 | 1 |
| Quadrant | Total seconds | Saturated seconds | Saturation percentage |
|---|---|---|---|
| A | 5901 | 91 | 1.542112% |
| B | 5902 | 57 | 0.965774% |
| C | 5902 | 46 | 0.779397% |
| D | 5902 | 381 | 6.455439% |
Noise dominated data is calculated using 1-second bins in cleaned event files. If a bin has >2000 counts, and if more than 50% of those come from <1% of pixels, then it is considered to be noise-dominated and hence unusable.
| Quadrant | # 1 sec bins | Bins with >0 counts | Bins with >2000 counts | High rate bins dominated by noise | Noise dominated (total time) | Noise dominated (detector-on time) | Marked lightcurve |
|---|---|---|---|---|---|---|---|
| A | 6976 | 5902 | 0 | 0 | 0.00% | 0.00% |  |
| B | 6977 | 5903 | 5 | 5 | 0.07% | 0.08% | 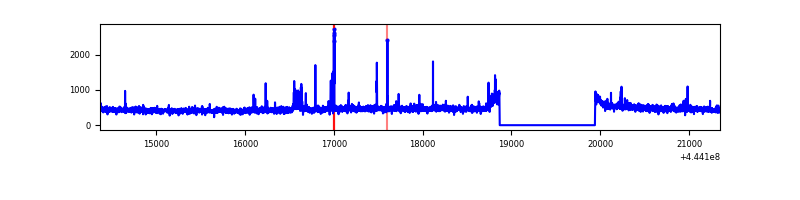 |
| C | 6977 | 5903 | 18 | 18 | 0.26% | 0.30% | 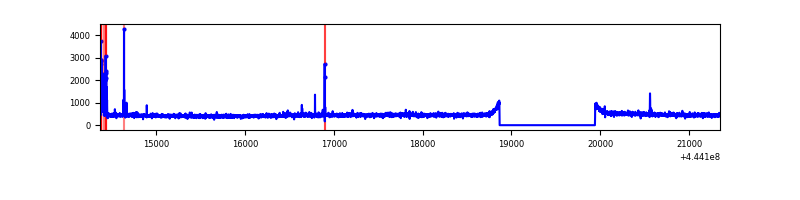 |
| D | 6977 | 5903 | 264 | 264 | 3.78% | 4.47% | 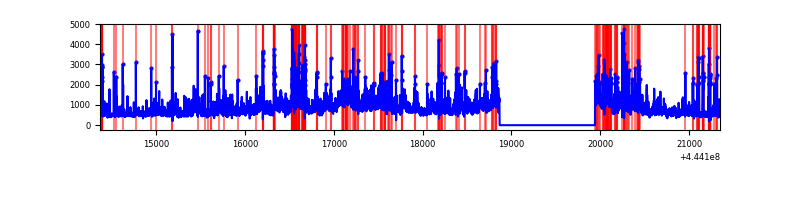 |
Top three noisy pixels from each quadrant. If the there are fewer than three noisy pixels in the level2.evt file, extra rows are filled as -1
| Pixel properties | Quadrant properties | ||||||
|---|---|---|---|---|---|---|---|
| Quadrant | DetID | PixID | Counts | Sigma | Mean | Median | Sigma |
| A | 10 | 83 | 2019692 | 14292.23 | 675 | 660 | 141.3 |
| A | 7 | 3 | 15792 | 107.12 | 675 | 660 | 141.3 |
| A | 3 | 137 | 7565 | 48.88 | 675 | 660 | 141.3 |
| B | 0 | 186 | 35325 | 260.22 | 675 | 654 | 133.2 |
| B | 15 | 201 | 27318 | 200.12 | 675 | 654 | 133.2 |
| B | 5 | 255 | 17939 | 129.73 | 675 | 654 | 133.2 |
| C | 14 | 254 | 91335 | 568.23 | 676 | 681 | 159.5 |
| C | 3 | 233 | 17675 | 106.52 | 676 | 681 | 159.5 |
| C | 1 | 3 | 12781 | 75.84 | 676 | 681 | 159.5 |
| D | 13 | 174 | 747611 | 4488.4 | 655 | 636 | 166.4 |
| D | 1 | 52 | 459622 | 2757.94 | 655 | 636 | 166.4 |
| D | 5 | 235 | 447902 | 2687.52 | 655 | 636 | 166.4 |
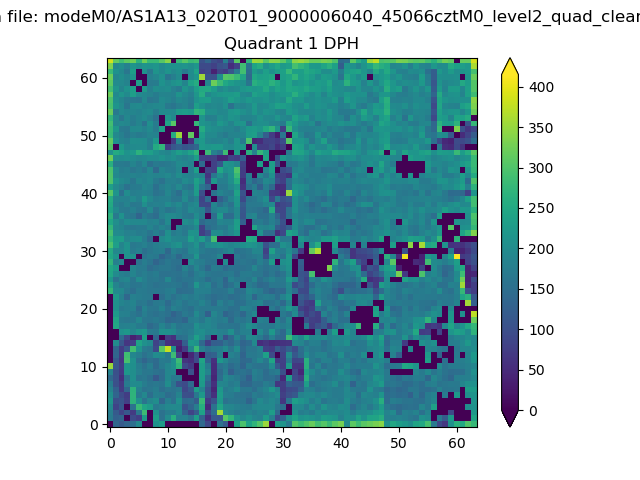
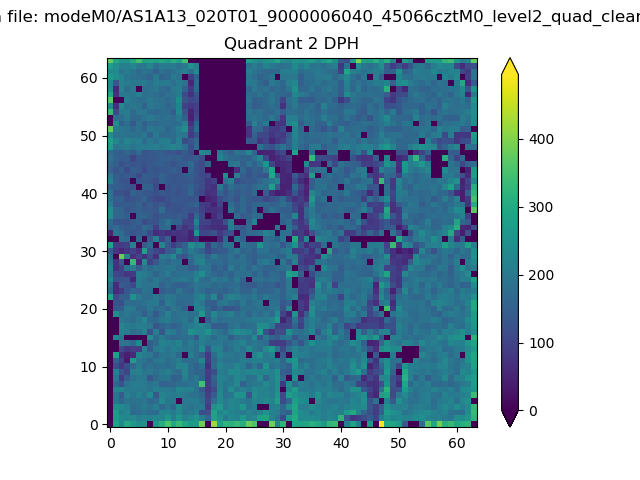
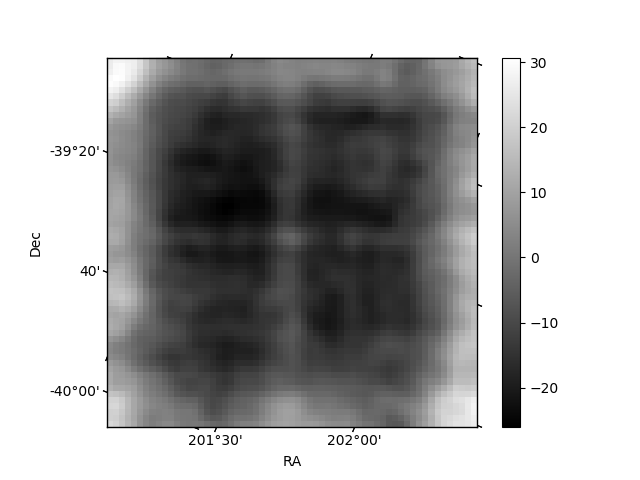
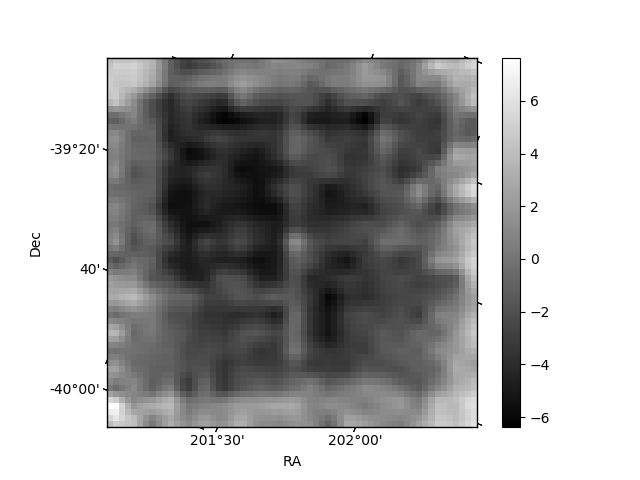
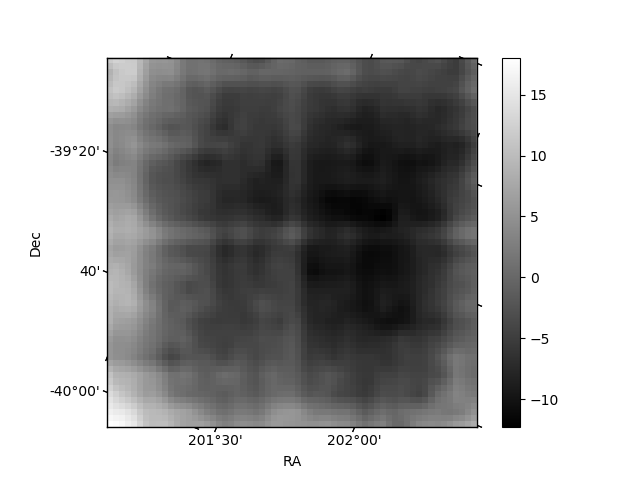
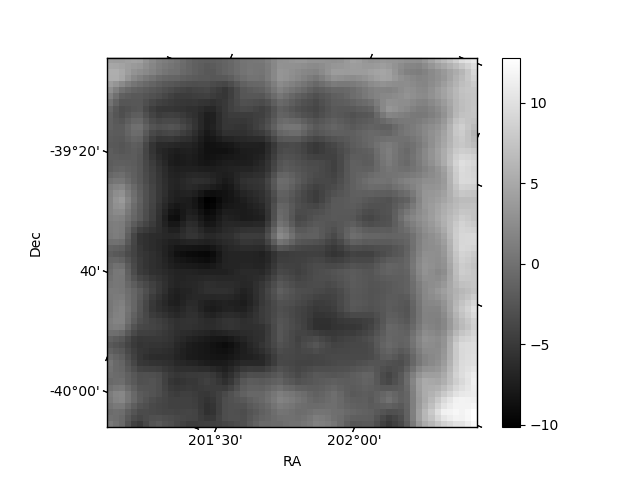
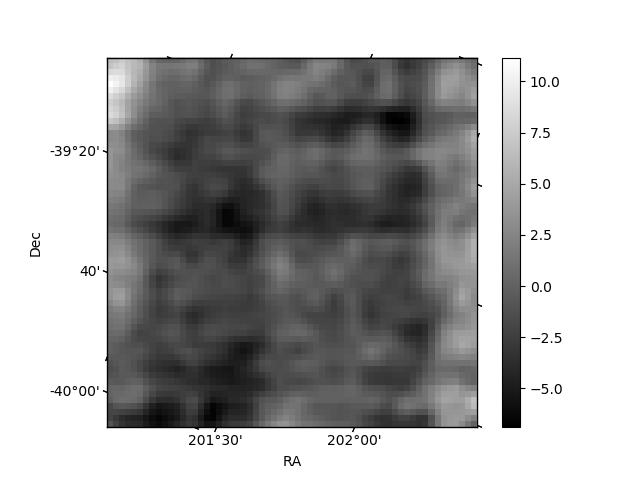
Histogram calculated using DETX and DETY for each event in the final _common_clean file
| Quadrant A | 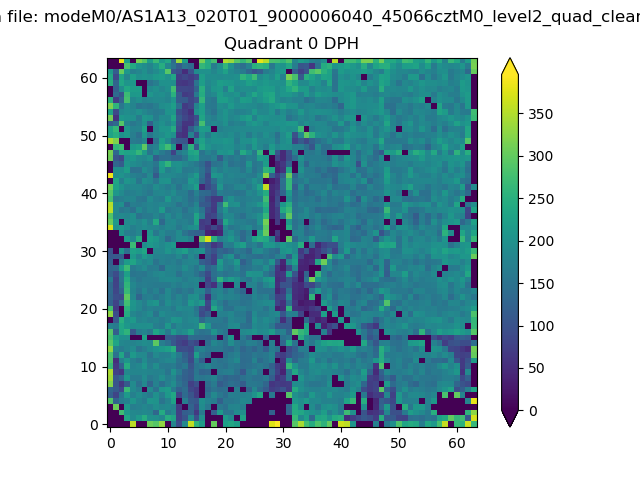 |
 |
Quadrant B |
|---|---|---|---|
| Quadrant D | 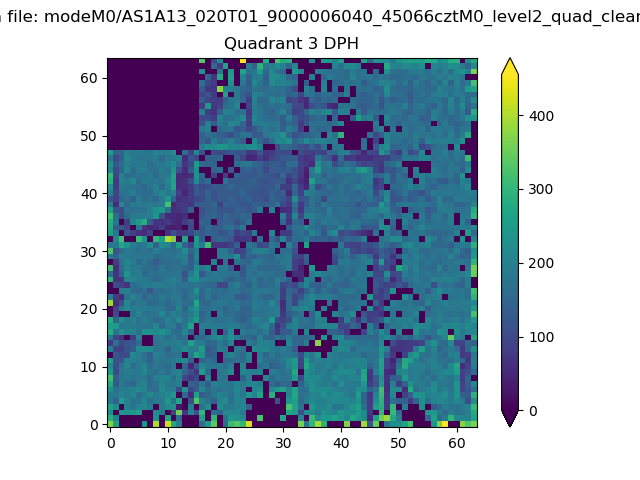 |
 |
Quadrant C |
| Plot type | Count rate plots | Images |
|---|---|---|
| Comparison with Poisson distribution Blue bars denote a histogram of data divided into 1 sec bins. Red curve is a Poisson curve with rate = median count rate of data. |
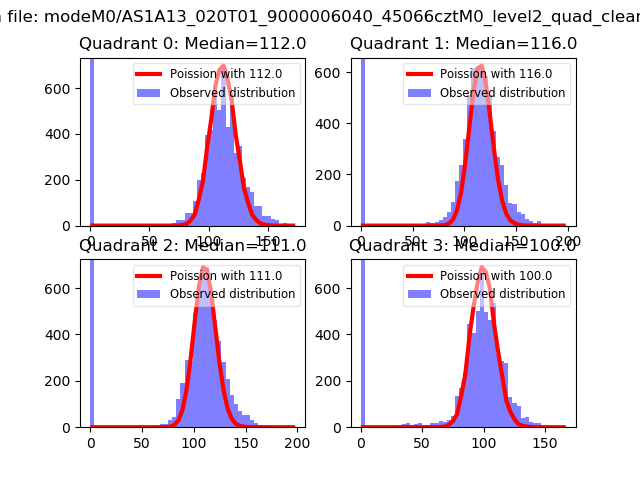 |
 |
| Quadrant-wise count rates Data is divided into 100 sec bins |
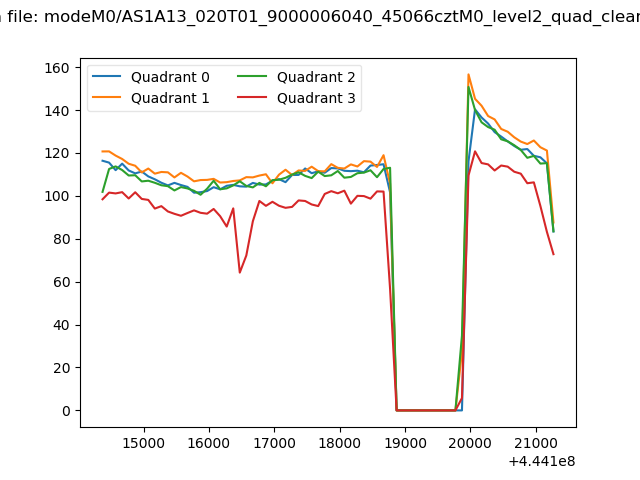 |
|
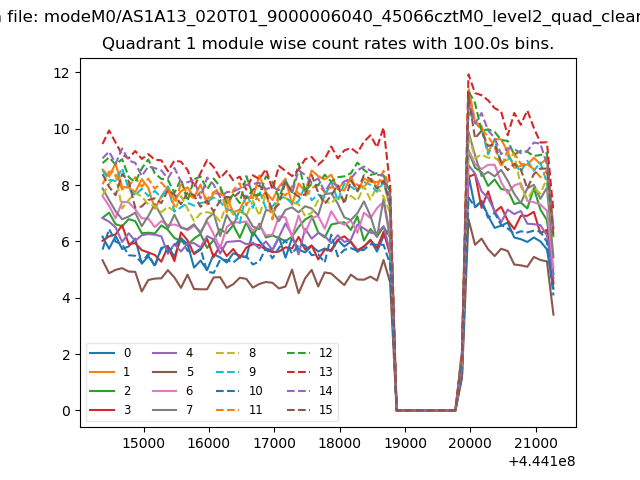
| Module-wise count rates for Quadrant A Data is divided into 100 sec bins |
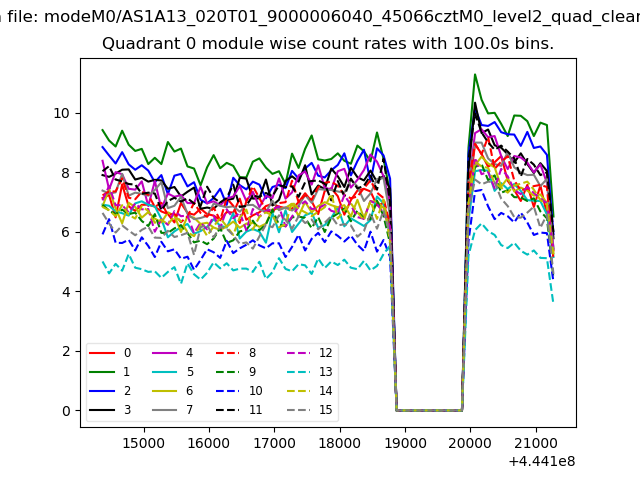 |
 |
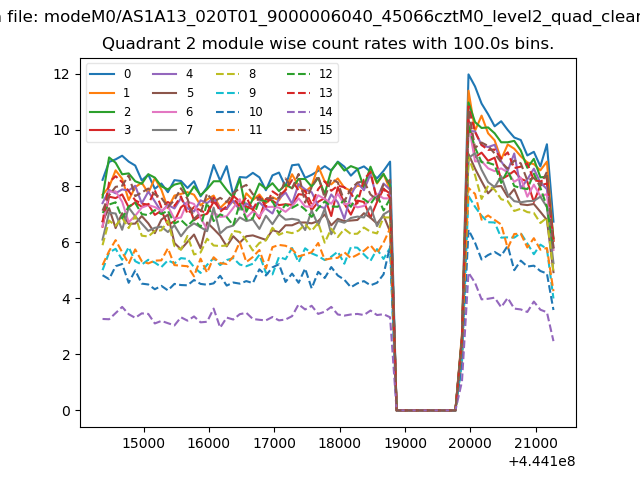
| Module-wise count rates for Quadrant B Data is divided into 100 sec bins |
 |
 |
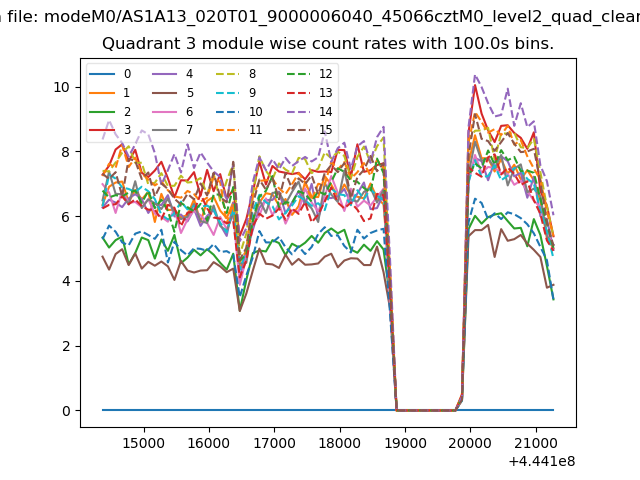
| Module-wise count rates for Quadrant C Data is divided into 100 sec bins |
 |
 |
| Module-wise count rates for Quadrant D Data is divided into 100 sec bins |
 |
 |
| Parameter | Plot |
|---|---|
| CZT HV Monitor | 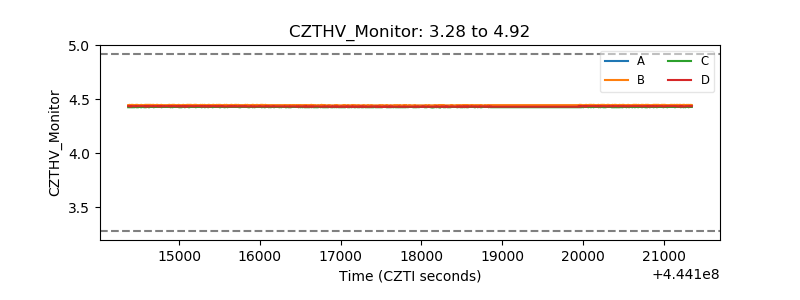 |
| D_VDD | 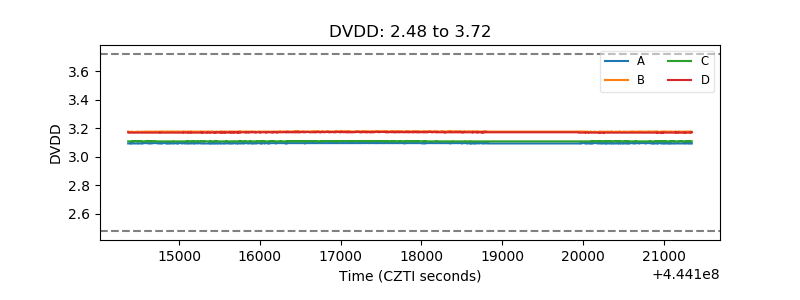 |
| Temperature 1 | 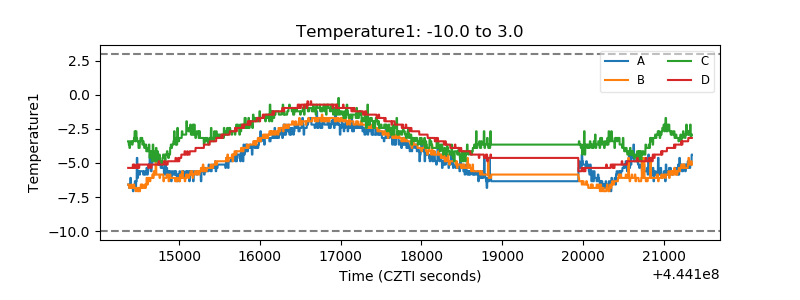 |
| Veto HV Monitor | 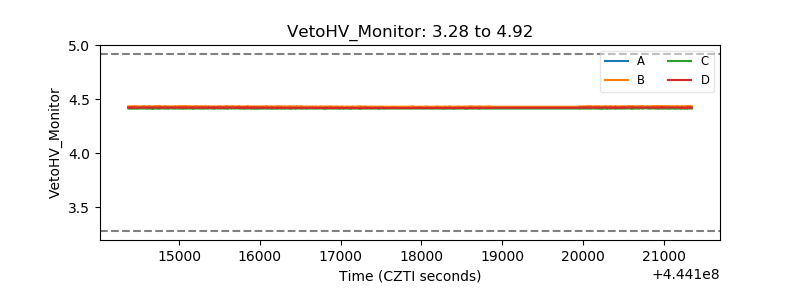 |
| Veto LLD | 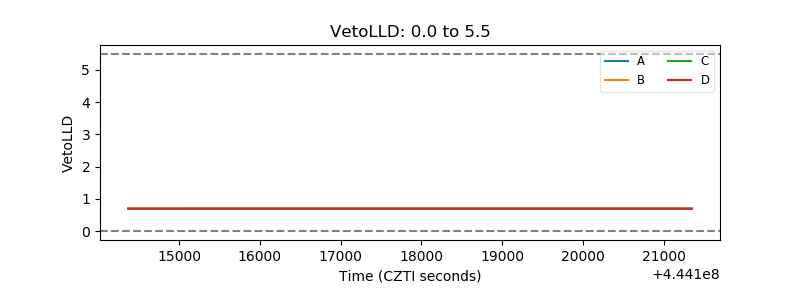 |
| Alpha Counter | 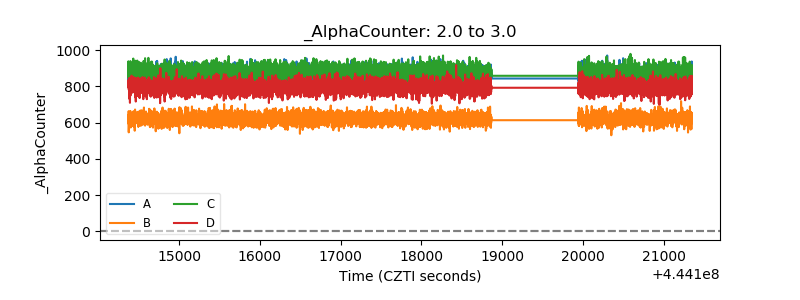 |
| _CPM_Rate | 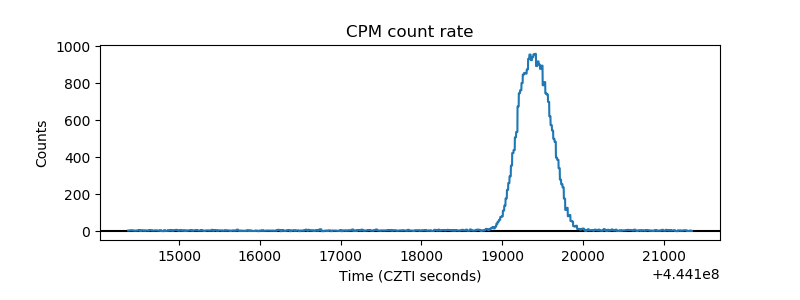 |
| CZT Counter | 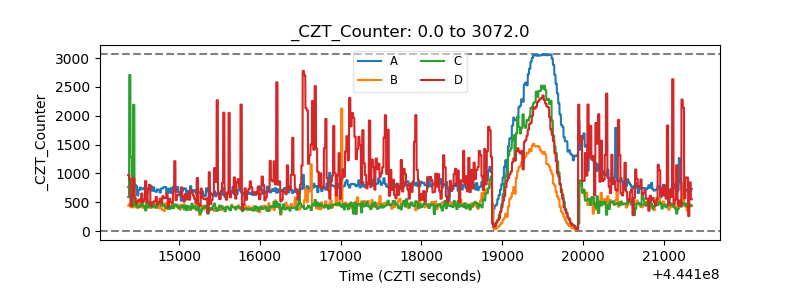 |
| +2.5 Volts monitor | 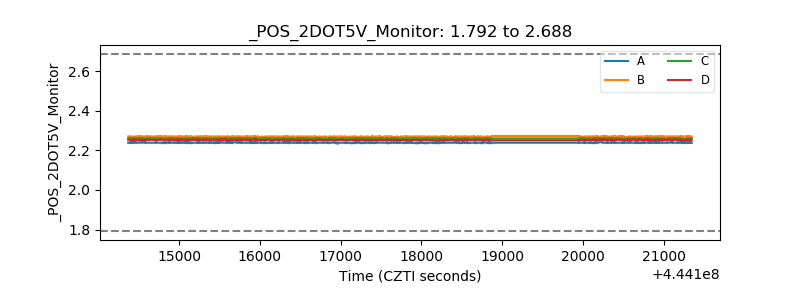 |
| +5 Volts monitor | 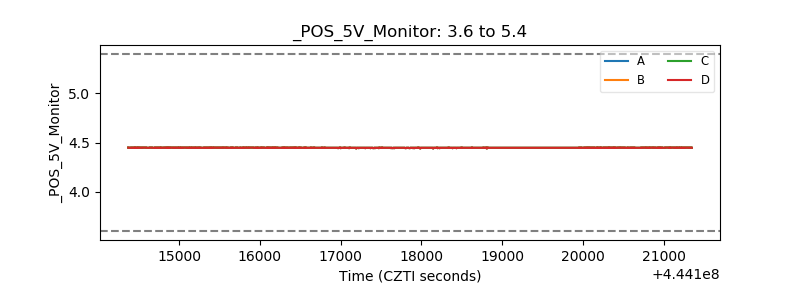 |
| _ROLL_ROT | 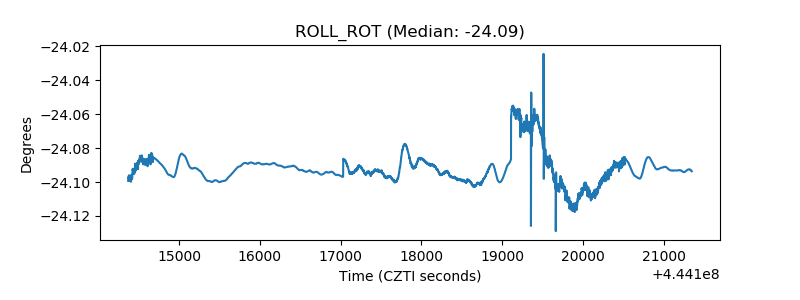 |
| _Roll_DEC | 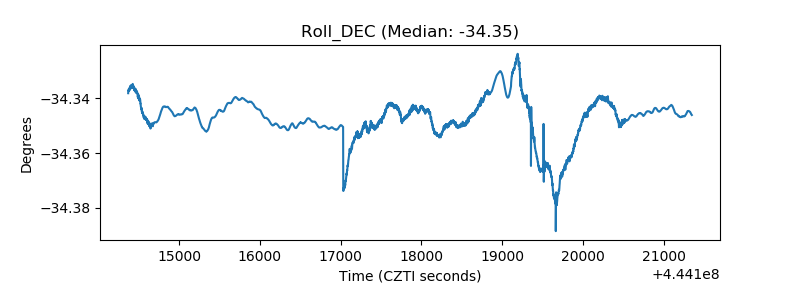 |
| _Roll_RA | 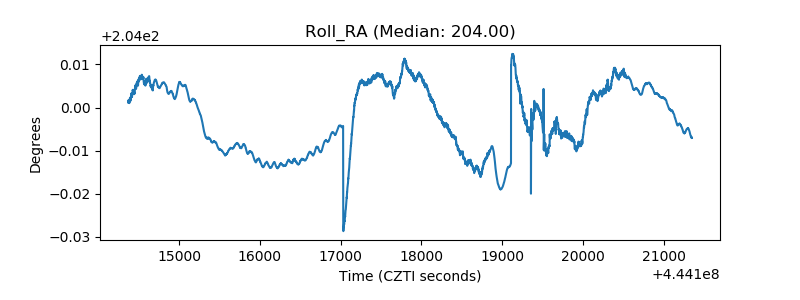 |
| Veto Counter | 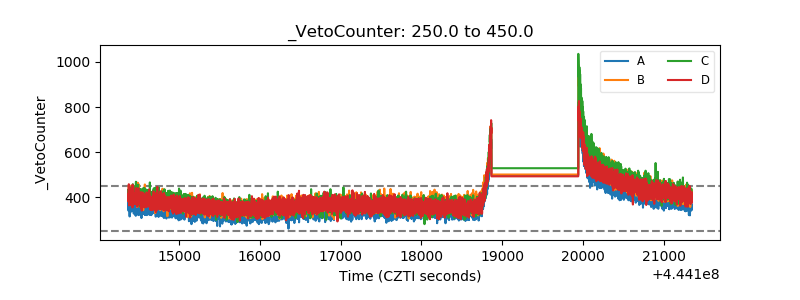 |