| Param | Original file | Final file |
|---|---|---|
| Filename | modeM0/AS1A13_020T01_9000006040_45067cztM0_level2.fits | modeM0/AS1A13_020T01_9000006040_45067cztM0_level2_quad_clean.evt |
| Size (bytes) | 516,870,720 | 112,478,400 |
| Size | 492.9 MB | 107.3 MB |
| Events in quadrant A | 5,465,284 | 756,934 |
| Events in quadrant B | 3,172,889 | 795,372 |
| Events in quadrant C | 3,194,953 | 767,005 |
| Events in quadrant D | 6,797,666 | 634,790 |
| Mode SS | |||
|---|---|---|---|
| Quadrant | BADHDUFLAG | Total packets | Discarded packets |
| A | 0 | 132 | 0 |
| B | 0 | 132 | 0 |
| C | 0 | 132 | 0 |
| D | 0 | 132 | 0 |
| Mode M9 | |||
|---|---|---|---|
| Quadrant | BADHDUFLAG | Total packets | Discarded packets |
| A | 0 | 14 | 0 |
| B | 0 | 15 | 0 |
| C | 0 | 15 | 0 |
| D | 0 | 15 | 0 |
| Mode M0 | |||
|---|---|---|---|
| Quadrant | BADHDUFLAG | Total packets | Discarded packets |
| A | 0 | 20797 | 2 |
| B | 0 | 13566 | 2 |
| C | 0 | 13729 | 2 |
| D | 0 | 24718 | 2 |
| Quadrant | Total seconds | Saturated seconds | Saturation percentage |
|---|---|---|---|
| A | 6475 | 190 | 2.934363% |
| B | 6475 | 91 | 1.405405% |
| C | 6475 | 82 | 1.266409% |
| D | 6475 | 780 | 12.046332% |
Noise dominated data is calculated using 1-second bins in cleaned event files. If a bin has >2000 counts, and if more than 50% of those come from <1% of pixels, then it is considered to be noise-dominated and hence unusable.
| Quadrant | # 1 sec bins | Bins with >0 counts | Bins with >2000 counts | High rate bins dominated by noise | Noise dominated (total time) | Noise dominated (detector-on time) | Marked lightcurve |
|---|---|---|---|---|---|---|---|
| A | 7635 | 6476 | 10 | 10 | 0.13% | 0.15% | 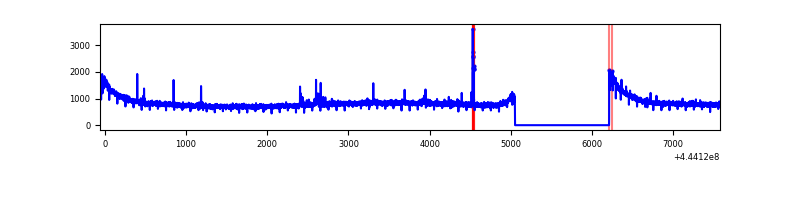 |
| B | 7635 | 6476 | 5 | 5 | 0.07% | 0.08% | 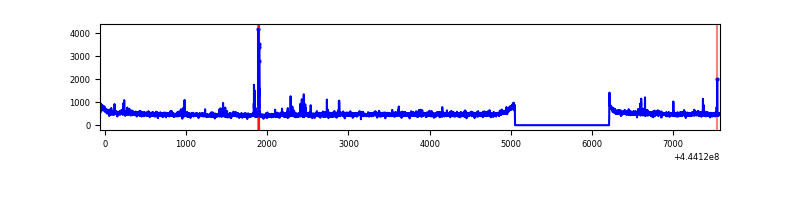 |
| C | 7635 | 6476 | 26 | 26 | 0.34% | 0.40% | 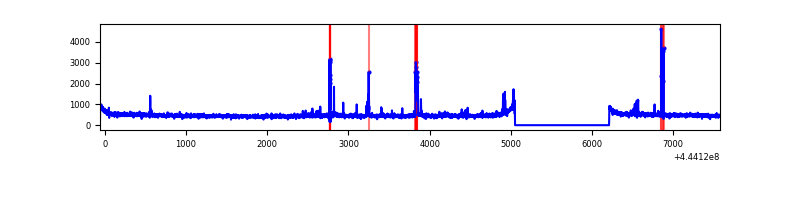 |
| D | 7635 | 6476 | 594 | 594 | 7.78% | 9.17% | 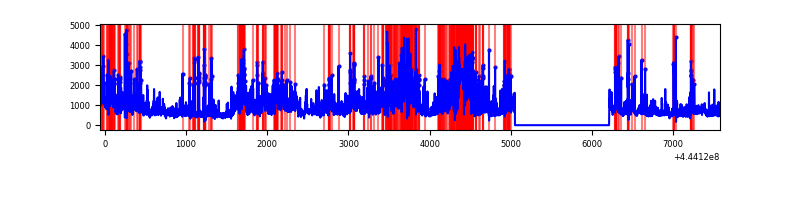 |
Top three noisy pixels from each quadrant. If the there are fewer than three noisy pixels in the level2.evt file, extra rows are filled as -1
| Pixel properties | Quadrant properties | ||||||
|---|---|---|---|---|---|---|---|
| Quadrant | DetID | PixID | Counts | Sigma | Mean | Median | Sigma |
| A | 10 | 83 | 2407188 | 15096.09 | 772 | 756 | 159.4 |
| A | 15 | 174 | 26692 | 162.7 | 772 | 756 | 159.4 |
| A | 10 | 248 | 19196 | 115.68 | 772 | 756 | 159.4 |
| B | 0 | 168 | 37706 | 245.26 | 772 | 750 | 150.7 |
| B | 4 | 171 | 23680 | 152.17 | 772 | 750 | 150.7 |
| B | 12 | 111 | 18403 | 117.15 | 772 | 750 | 150.7 |
| C | 14 | 254 | 90014 | 490.18 | 775 | 780 | 182.0 |
| C | 1 | 3 | 48131 | 260.11 | 775 | 780 | 182.0 |
| C | 0 | 207 | 19681 | 103.83 | 775 | 780 | 182.0 |
| D | 13 | 174 | 1505315 | 8190.39 | 734 | 714 | 183.7 |
| D | 5 | 235 | 503334 | 2736.04 | 734 | 714 | 183.7 |
| D | 1 | 52 | 456895 | 2483.25 | 734 | 714 | 183.7 |
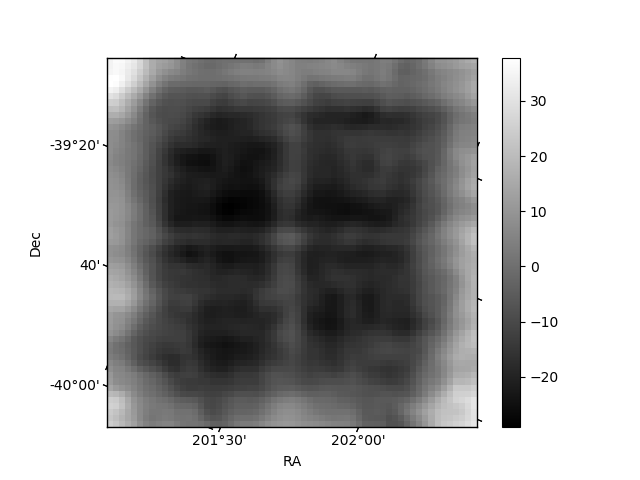
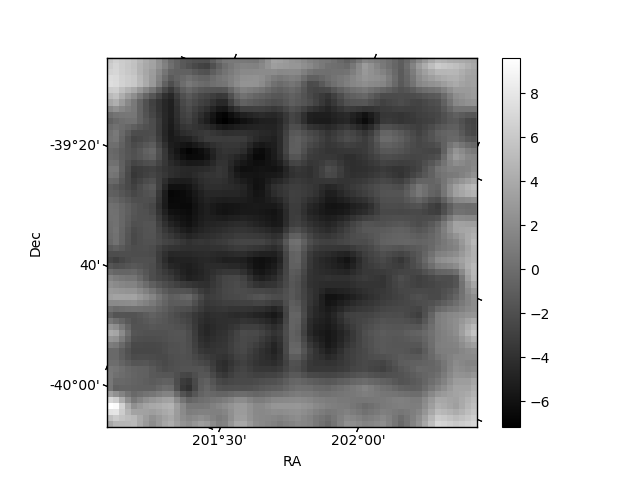
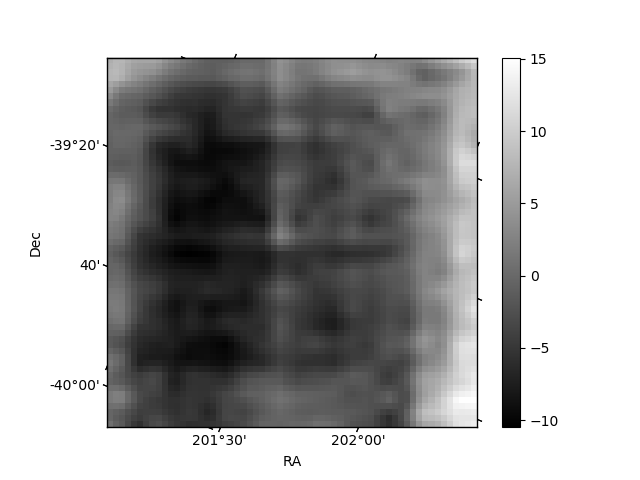
Histogram calculated using DETX and DETY for each event in the final _common_clean file
| Quadrant A | 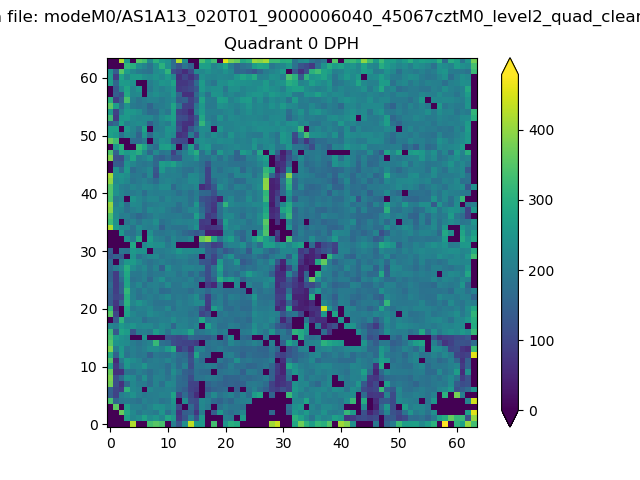 |
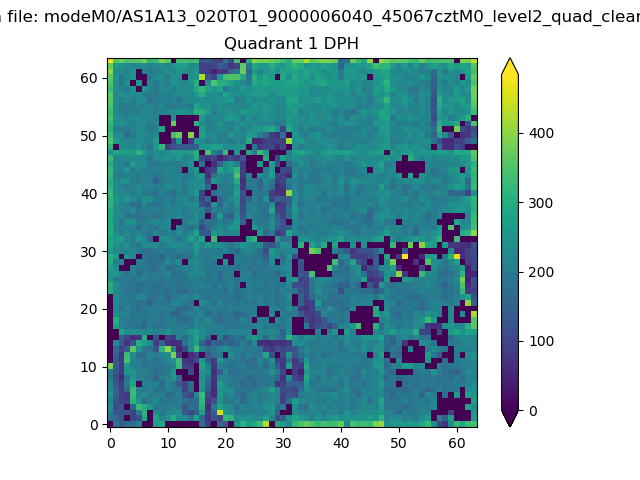 |
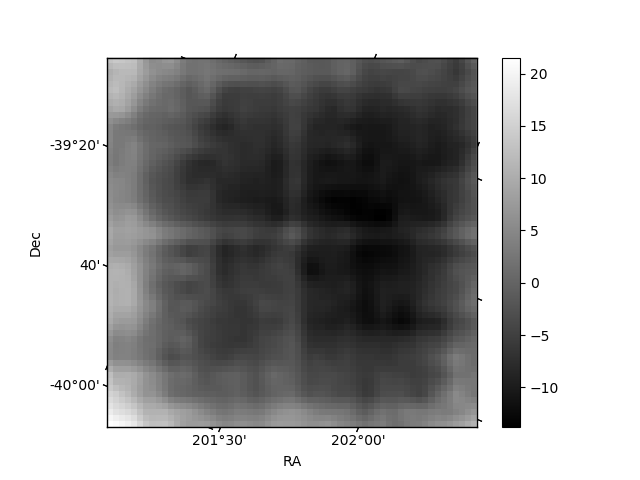
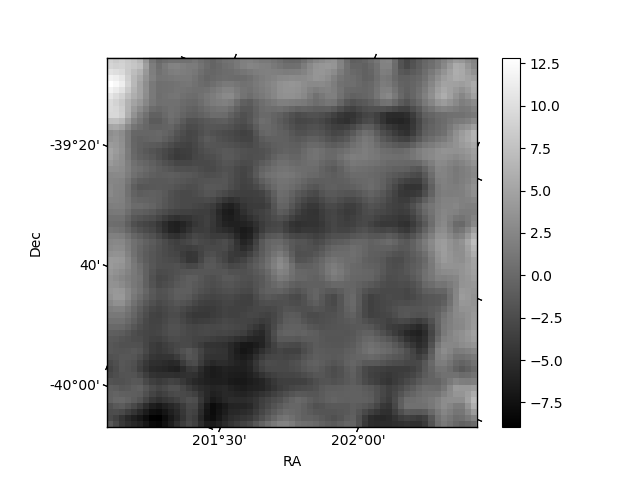
Quadrant B |
|---|---|---|---|
| Quadrant D | 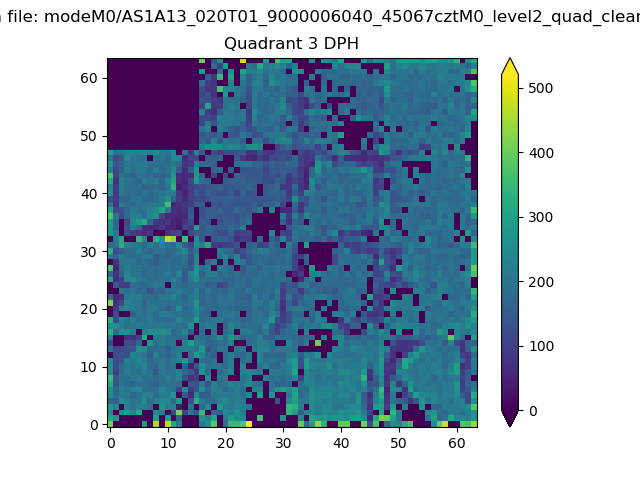 |
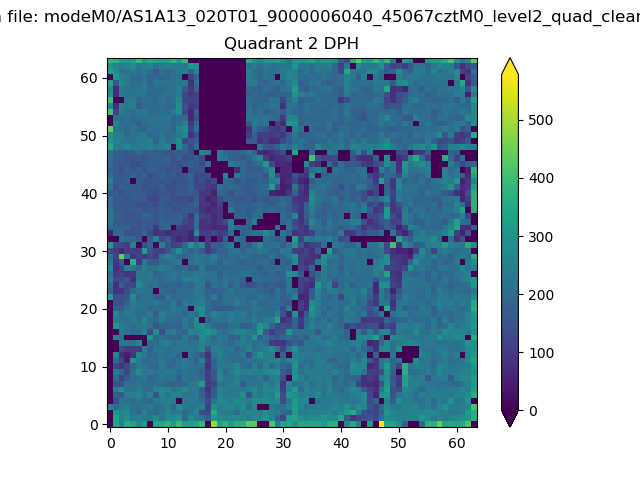 |
Quadrant C |
| Plot type | Count rate plots | Images |
|---|---|---|
| Comparison with Poisson distribution Blue bars denote a histogram of data divided into 1 sec bins. Red curve is a Poisson curve with rate = median count rate of data. |
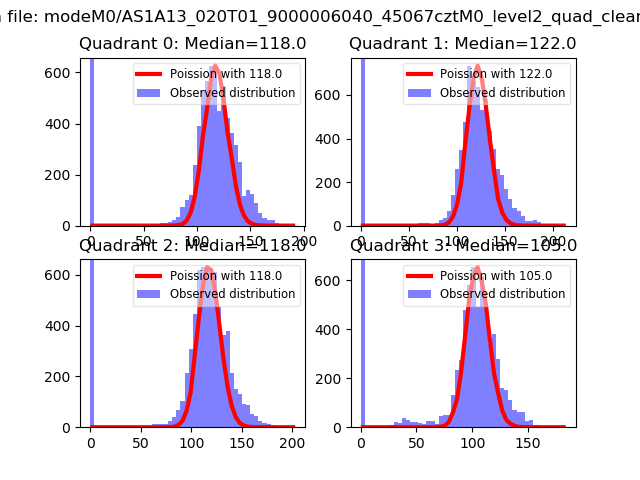 |
 |
| Quadrant-wise count rates Data is divided into 100 sec bins |
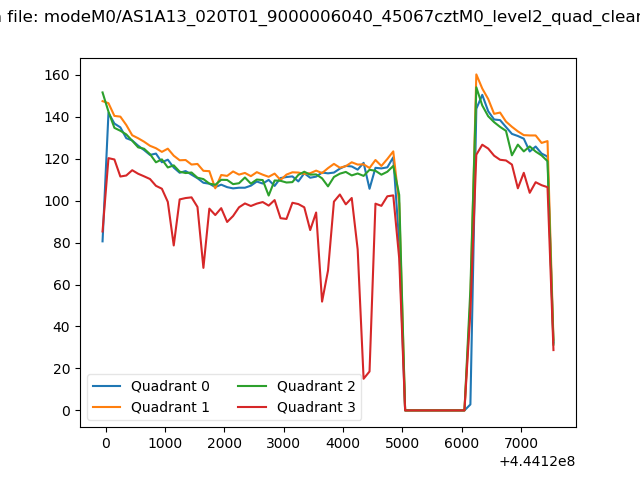 |
|
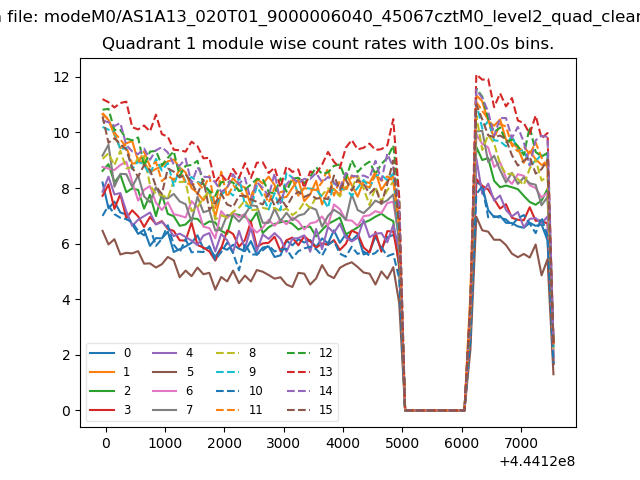
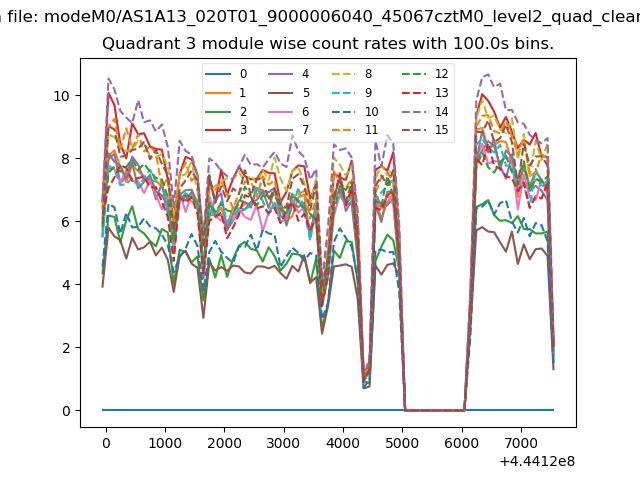
| Module-wise count rates for Quadrant A Data is divided into 100 sec bins |
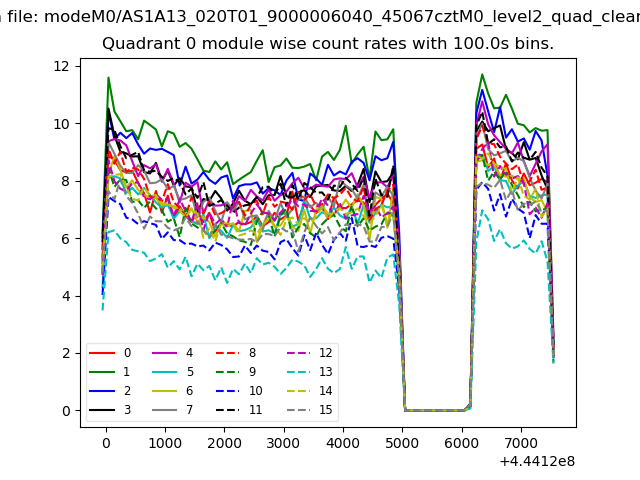 |
 |
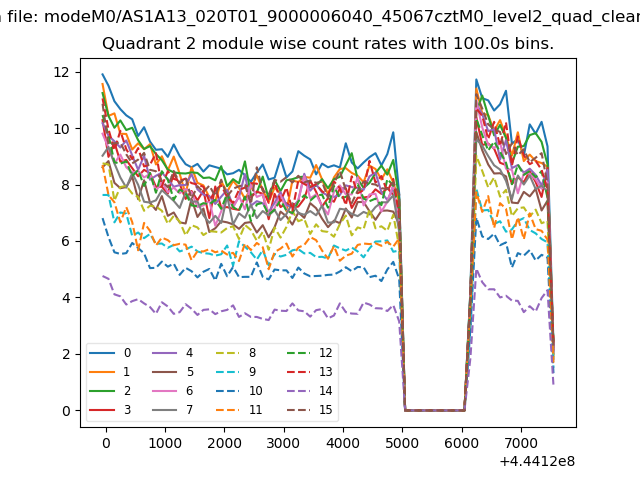
| Module-wise count rates for Quadrant B Data is divided into 100 sec bins |
 |
 |
| Module-wise count rates for Quadrant C Data is divided into 100 sec bins |
 |
 |
| Module-wise count rates for Quadrant D Data is divided into 100 sec bins |
 |
 |
| Parameter | Plot |
|---|---|
| CZT HV Monitor | 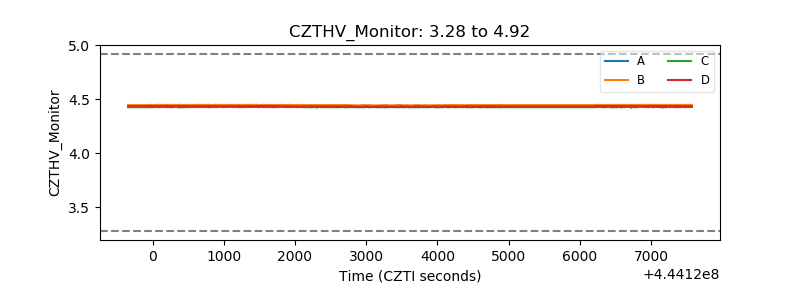 |
| D_VDD | 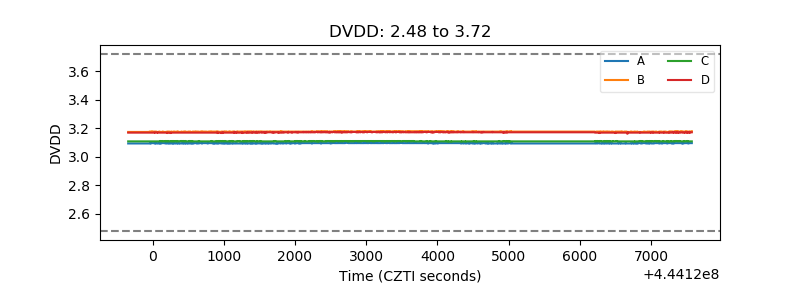 |
| Temperature 1 | 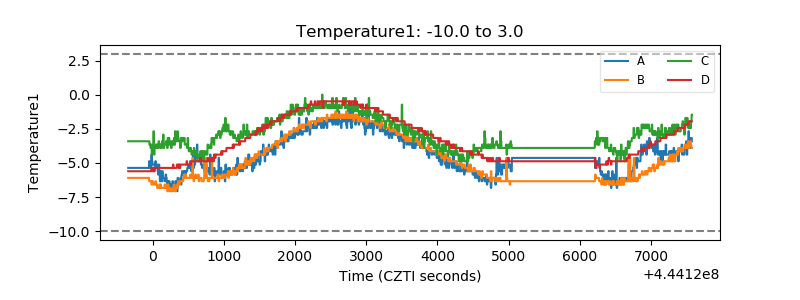 |
| Veto HV Monitor | 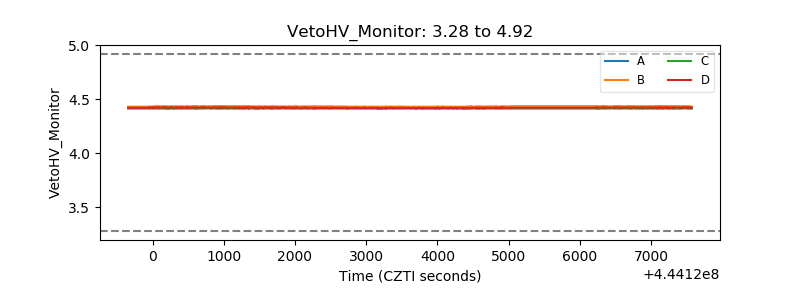 |
| Veto LLD | 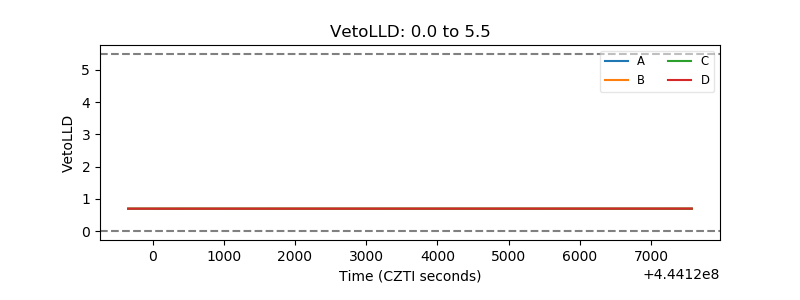 |
| Alpha Counter | 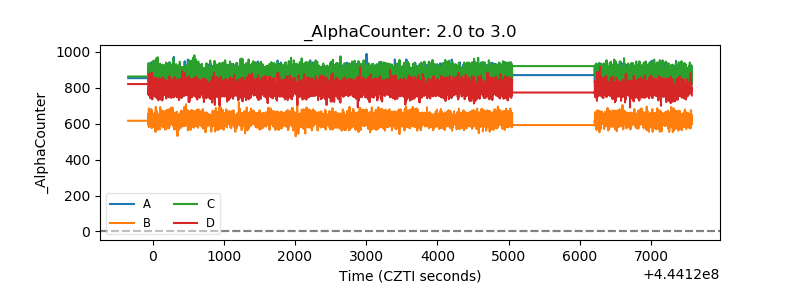 |
| _CPM_Rate | 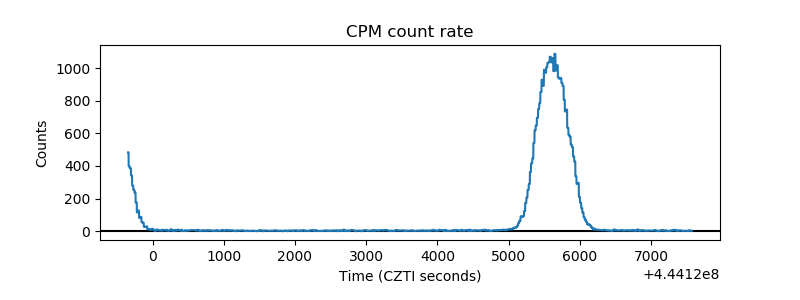 |
| CZT Counter | 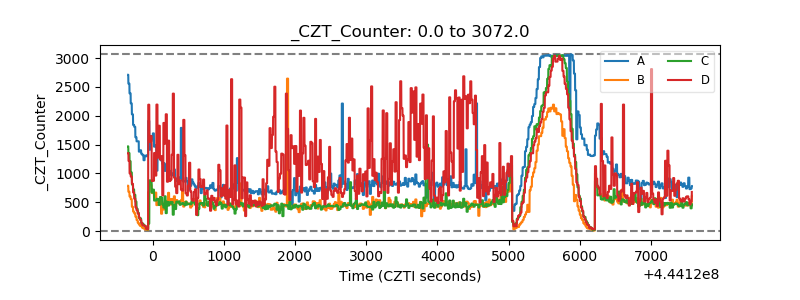 |
| +2.5 Volts monitor | 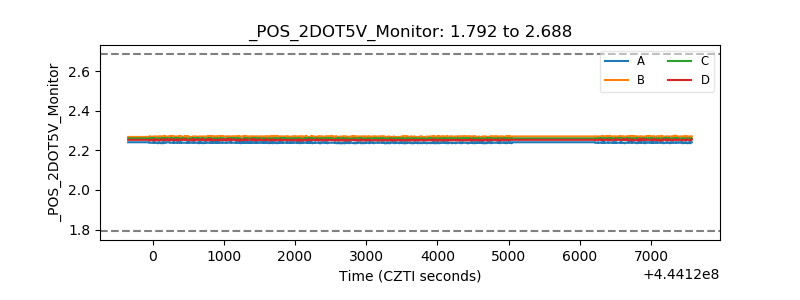 |
| +5 Volts monitor | 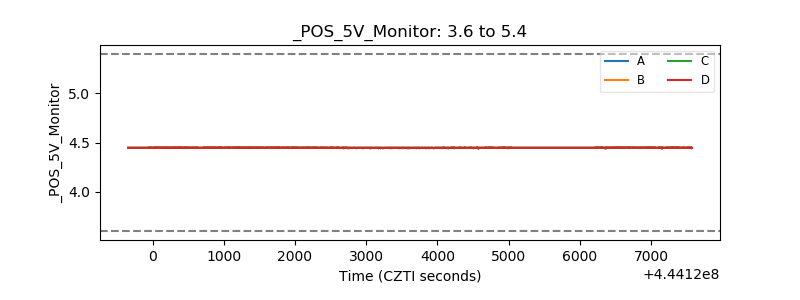 |
| _ROLL_ROT | 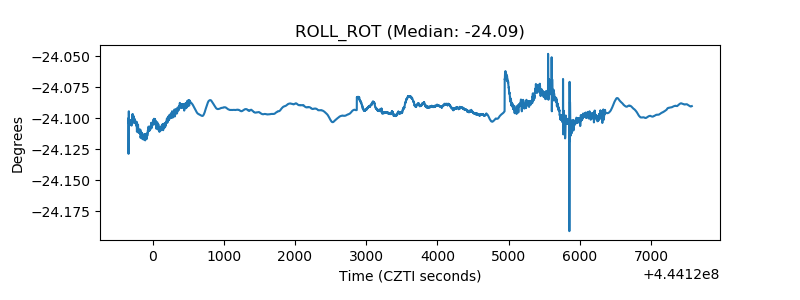 |
| _Roll_DEC | 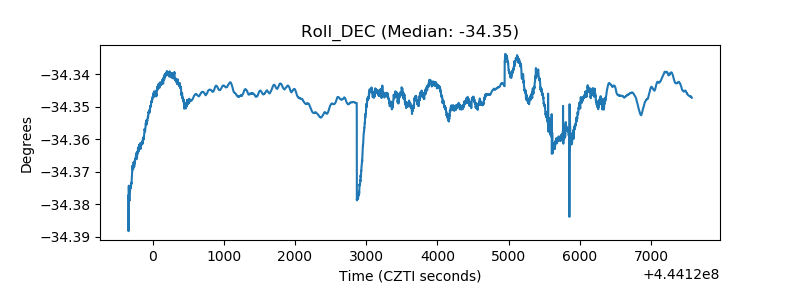 |
| _Roll_RA | 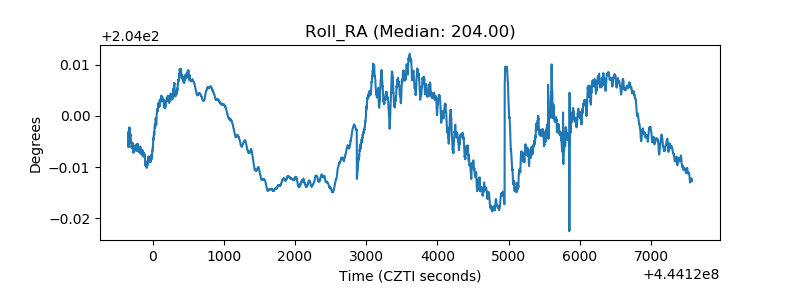 |
| Veto Counter | 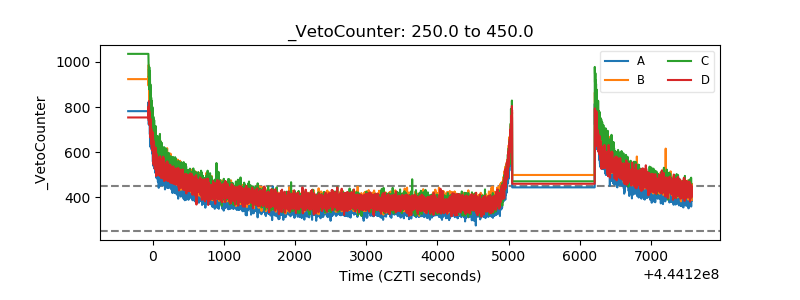 |